Assessment Evolution Visualization - Learning-Dashboard/LD-learning-dashboard GitHub Wiki
:rewind: User Guide >> 1.2. Assessment Evolution Visualization :arrow_backward: 1.1. [Current Assessment Visualization]] ](/Learning-Dashboard/LD-learning-dashboard/wiki/2.-[[Quality-Assessment-Prediction):arrow_forward:
In order to visualise the data for trend analysis, the dashboard provides the view mode option Historical Data (fourth option in the view mode menu).
Project Evolution Video Tutorial
There are two different kind of visualizations:
- Lines charts including one series that shows the evolution of the assessed value, when we only have one number to show. These charts are used in the Strategic Indicators Data View, Quality Factors Data View and Metrics Data View.
- Lines charts including several series that show the evolution of the assessed value for all the elements used to calculate the assessed element. These charts are used in the Detailed Strategic Indicators Data View, showing the assessed value for the factors used to calculate the strategic indicators, and in the Detailed Quality Factors Data View, showing the assessed value for the metrics used to calculate the factor.
Every chart also shows a set of straight lines, representing the different thresholds of the category associated to that element, with the color of the corresponding threshold. In addition for each series of the graph, independent of its kind, there is a dotted line, representing a trendline of showed data.
In the historical data view, the user can select the inspected period using the date filters at the top of the assessment area. The user can also select the fit to content option, which changes the values of the y axis of the charts so the values correspond to the lowest and gratest value found in the data being displayed.
Strategic Indicators


Detailed Strategic Indicators

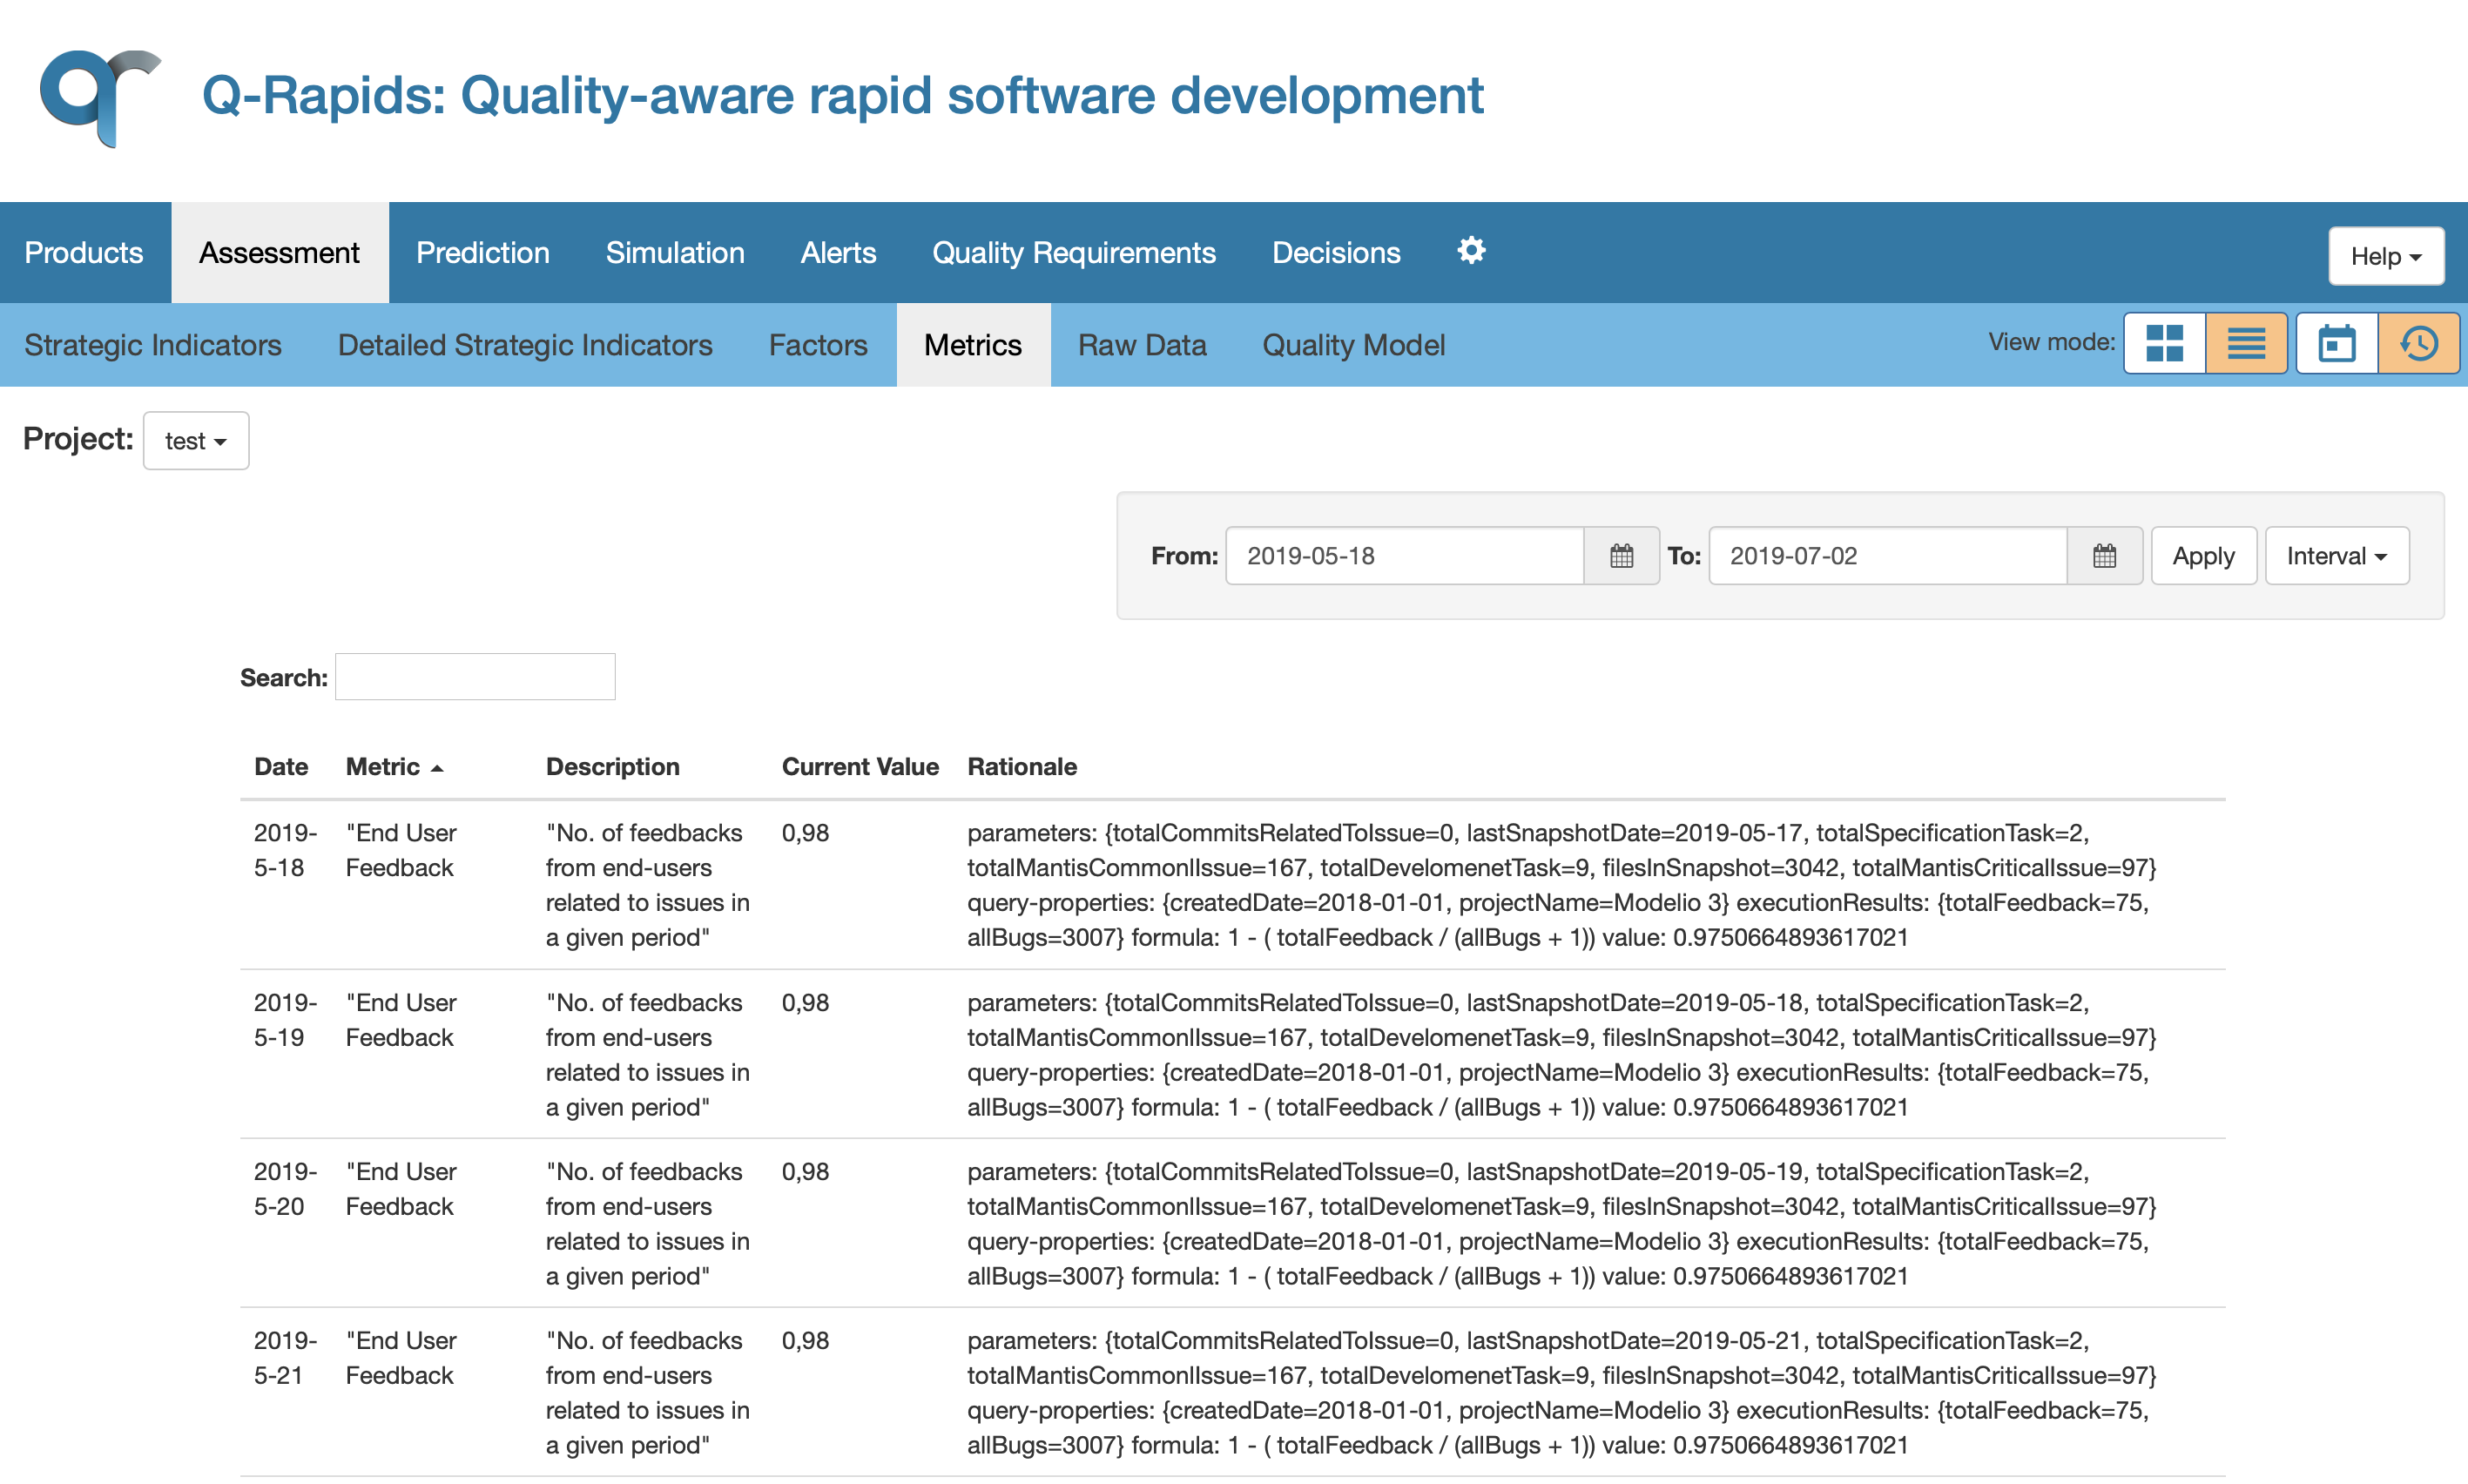
Metrics (textual)
The textual option shows the data in a table, where each row corresponds to the assessment of the element for a specific day.