Statistics Done Wrong - KeynesYouDigIt/Knowledge GitHub Wiki
Statistical Significance
A statistically significant difference is one that is larger than could easily be produced by luck.
p Values
The p value is the probability of collecting data that shows a difference equal to or greater than what you actually observed. p values force you to reason about results that never actually occurred. It was originally just intended to be combined with your domain knowledge and give you a tool for interpretting data.
p < 0.05 is commonly regarded as statistically significant.
- Not how right you are
- It's a measure of "surprise" - A smaller value means you should be more surprised
- "My data is inconsistent with the result not being true"
- Doesn't tell you whether to the mean, median, or mode is more appropriate
You can get statistically significant results by:
* By collecting a ton of data and measuring a huge effect
* Measuring extremely tiny (but unimportant) differences
Null-Hypothesis
Ensure that false-positives occurred at a predefined rate, called α.
You make a null hypothesis (that there is no effect), as well as an alternative hypothesis (that there is some effect). You perform a test, and reject the null hypothesis whenever p < α
Confidence Intervals
Combine a point estimate with a confidence in that estimate.
- "I'm 95% confident that the result will be between these two boundaries"
- A wide range lowers the value
Answer the same question as p values, but provide more information and are more straight-forward to interpret. They also require much less context. That makes them preferrable to p values.
Errors
- False positives - Thinking there's an effect when there isn't
- False negatives - Failing to notice a real effect
The results of experiments don't have these, procedures do.
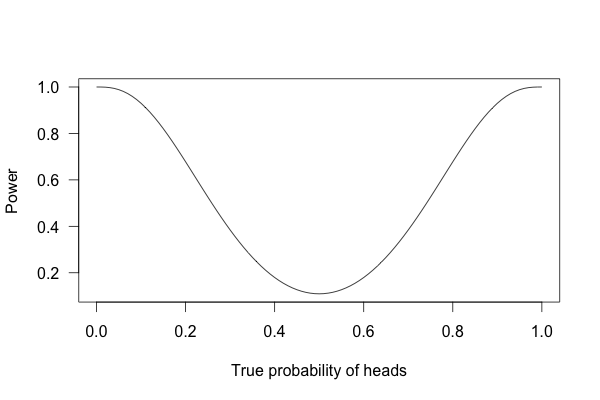
Statistical Power
Tells you how much data to collect. Power is affected by:
- Size of bias you're looking for (big is easier to detect than small)
- Sample size (more data helps find smaller biases)
- Measurement error (how easy it is to miscapture data)
- 80% statistical power is generally accepted as valid.
Measured by a curve:
