Overlays - Keenny38/ModernTinyPedals GitHub Wiki
Overlays
NeoPedal has 88 overlays (called widgets in the settings files). Turn them on and configure them on the Overlays page: see Getting Started. Every option is described in the settings reference.
To give the settings of one overlay or of several to someone else, use Share on the Overlays page or in Overlay Options: see Share overlay settings.
The pictures of the Overlays page, of Overlay Options and of the setup wizard show each overlay on a simulated race: a GT3 mid race at Road Atlanta, in a 20 car multi-class field. Your game data, presets and running overlays are never touched by these pictures, even while you race. In Overlay Options, the live preview is drawn with your unsaved values: zoom it from 50 % to 300 % (buttons under it, Ctrl+wheel, double click to switch between actual size and fit) and widen the panel with the button at its bottom right. A zoomed overlay is drawn at that size, as the global overlay scale does, so text stays sharp.
On the game screen, overlays show only real game data. The sample content of Chat, Spotter, Race Notifications and Pit Lane Helper is drawn only in edit mode (right-click an overlay > Edit Mode), to place the overlay.
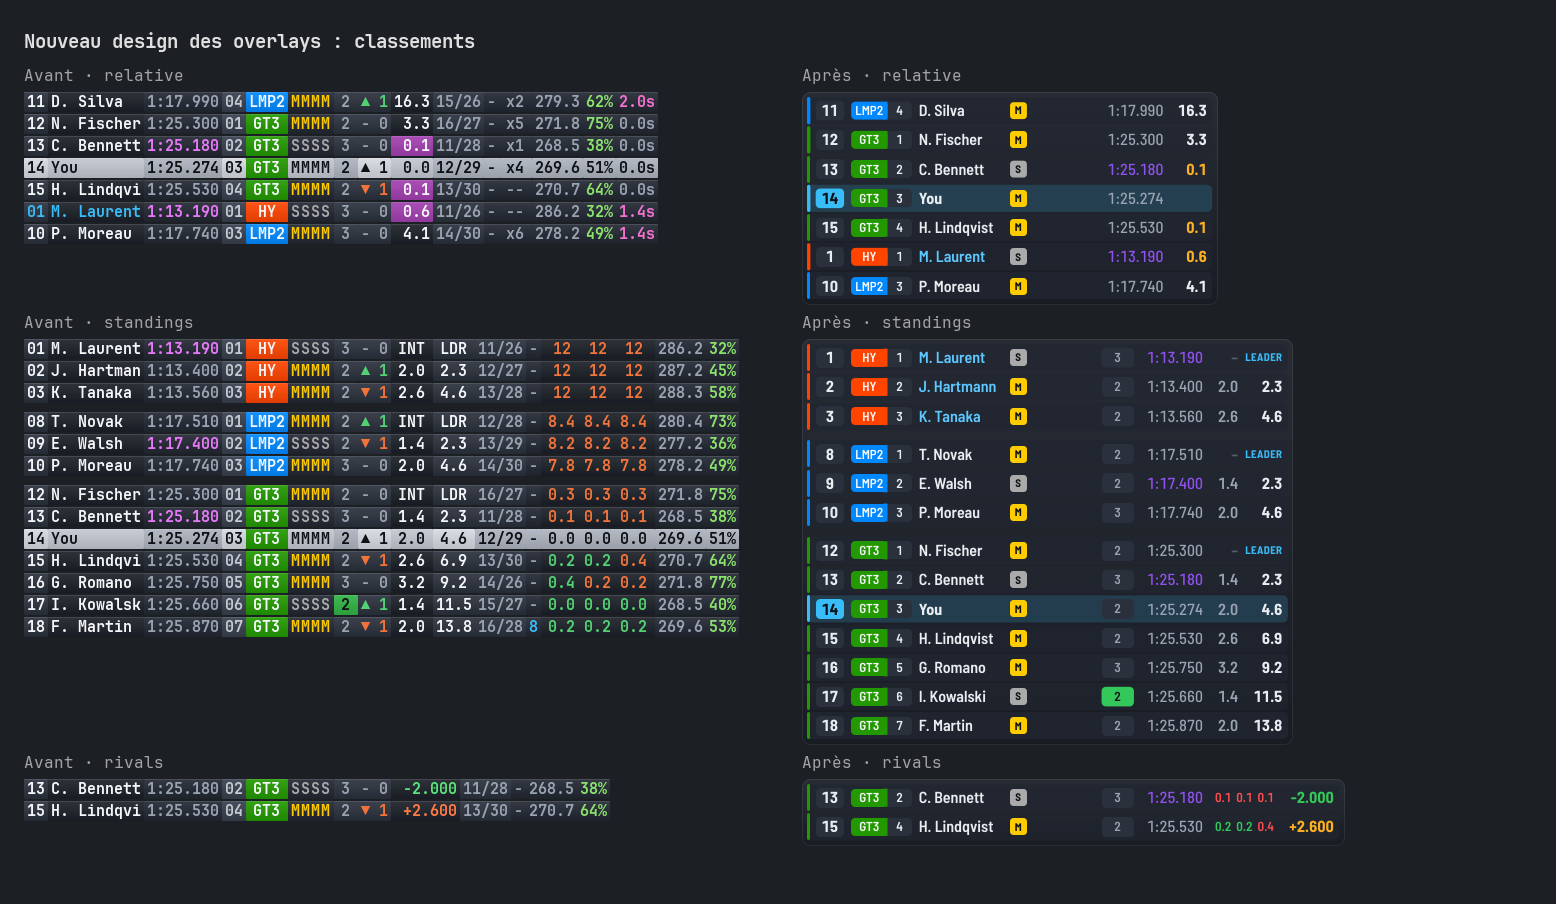
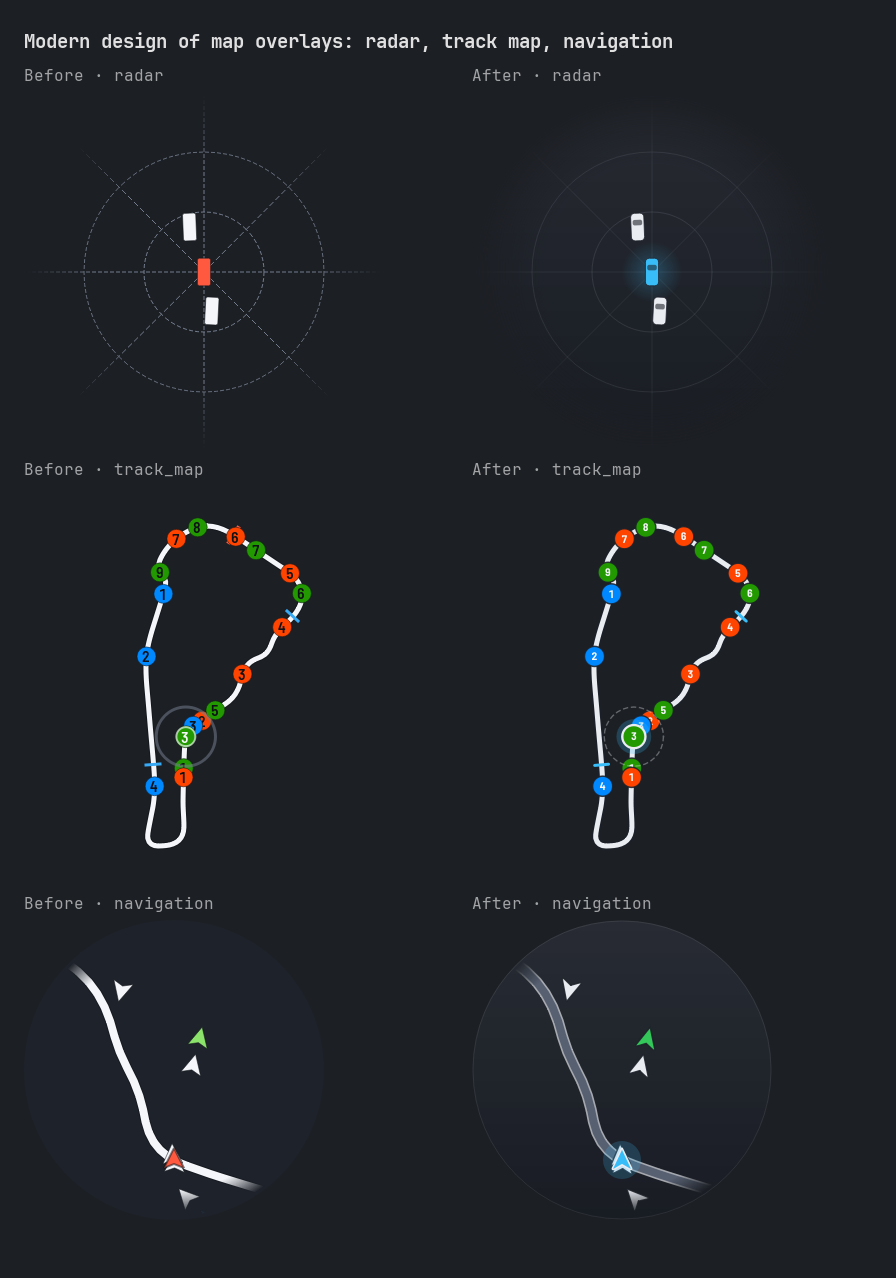
Modern design and classic layout
Every overlay has a modern design:
- one rounded panel per overlay, the bundled Barlow font for labels and monospace JetBrains Mono for values (
enable_modern_font), short labels above the values, translated into the app language; - values colored by meaning: gain, loss, warning, best time;
- standings as rows with a position badge, class pill and position in class, with selectable columns (
column_*options of Relative, Standings and Rivals); - fuel and energy with a gauge and markers, tyres and brakes as tiles in heatmap colors, LEDs as glowing dots.
- graphic overlays drawn for the design: round radar fading at its edge (amber, then red glow toward a car alongside), track map with cars as numbered dots in class colors (or race status colors) and a checkered start line, navigation view with road edge lines, friction circle with G rings, a trace fading with age and recent peaks, heading compass ring with yaw and front slip angle, drawn steering wheel, instrument and weather forecast icons drawn as shapes, trailing inputs with soft areas under throttle and brake, track notes card.
- flag items as chips in flag colors (caption above value, only while active), chat feed with a color per sender and new messages highlighted, elevation profile with the driven part in accent color and the car as a dot, race notifications with an icon per message and a bar shrinking with the time left, steering meter growing from center with a thumb, RPM LEDs keeping a faint tint of their color zone while unlit, spotter bars glowing toward the screen center.
- Dashboard HUD (formerly Black box) keeping its layout and options, in the Barlow font, theme colors and cards with a hairline border.
The modern design reads fewer options than the classic layout: the Overlay Options page only shows the options it uses. Display order options (display_order_*) apply to the modern rows and columns once you change one of them. In the Overlay Options page, Relative, Standings and Rivals list their columns in one Columns list, from left to right as the overlay draws them: switch each column on or off there, drag it or use the arrows to move it. Sections follow for the rows, the classes and number of cars (Standings), then the options of each column, dimmed while the column is hidden. The live preview of these three shows a sample race made with your list options.
The classic layout is still available:
- for every overlay: choose a
Legacytheme (see below), the classic look; - for one overlay: turn on its
enable_classic_layoutoption (classic layout with modern colors).
Other options of Config > Overlay Style (they apply to all presets): enable_modern_font (on: labels in modern_design_font_name, default Barlow Semi Condensed, and values in modern_font_name, default JetBrains Mono, monospace and bundled, also the font of classic layout overlays; off: each overlay in its own font_name option), corner_radius_scale, enable_depth_effects, minimum_bar_gap, overlay_scale (scale of all overlays) and enable_fade_animation.
Themes
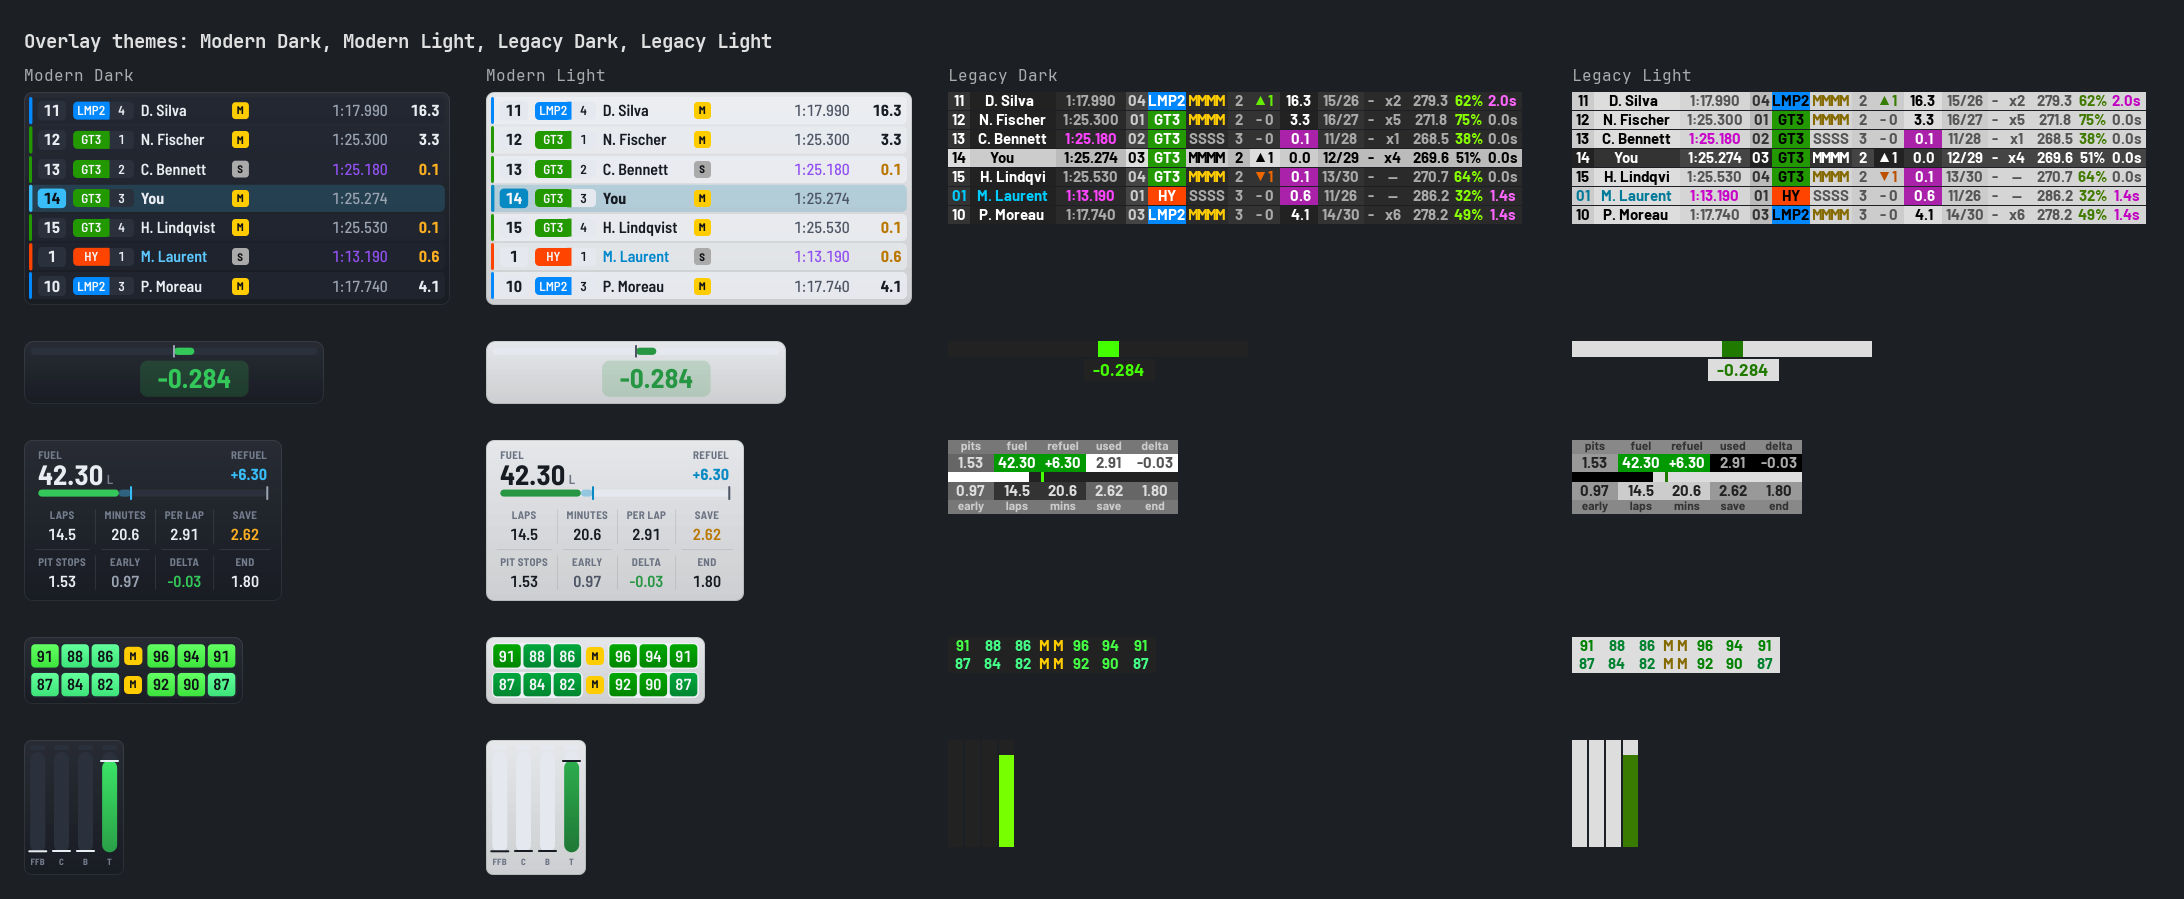
overlay_theme in Config > Overlay Style sets the look of all overlays:
| Theme | Look |
|---|---|
Modern Dark |
Default: modern design, slate neutrals, softer accent colors |
Modern Light |
Modern design, light panels and dark text |
Legacy Dark |
Classic look: classic layout, colors and fonts |
Legacy Light |
Classic look with light panels and dark text |
enable_colorblind_colors turns on the colorblind safe variant of any theme (Okabe-Ito palette: red / green pairs become orange / blue).
Light themes invert gray panels and text, keep colored backgrounds (flags, warnings) and darken the colors drawn on panels (heatmap temperatures, gains and losses) so they stay readable. Themes only change options that still have their default value: a color you customized is kept in every theme.
The window of the app has the same four themes (window_color_theme in Config > Application, or the theme button of the status bar). Window and overlays have separate themes.
Visibility by session and pit
- Auto hide (tray menu
Auto Hide, on by default) hides every overlay when you are not driving. While you spectate a session or watch a replay, overlays are shown as long as a stream overlay source is on air (Show overlays while spectating, see Connections). - Each overlay has a
visibility_contextoption:Always(default),Race,Qualifying & Race,Practice & Qualifying,On TrackorIn Pits. - Overlays fade in and out when they appear or hide (
enable_fade_animationinConfig>Overlay Style).
Race aid overlays
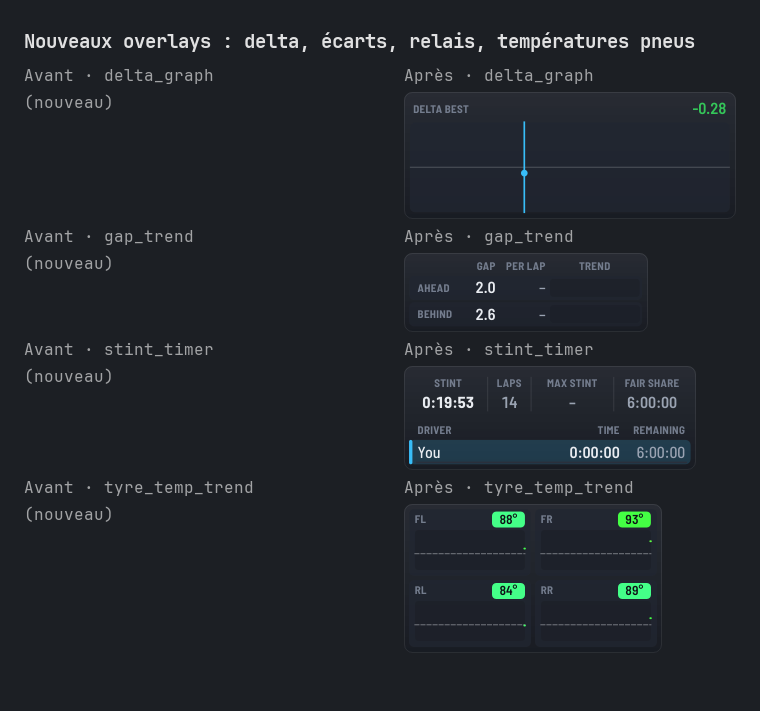
Seven overlays added in 0.20.0 help during a race. They are off by default: turn them on on the Overlays page.
| Overlay | What it shows |
|---|---|
| Delta Graph | Delta along the current lap (loss in red, gain in green), previous lap in the background. Reference: best lap, session, stint or last lap. |
| Gap Trend | Gap to the car ahead and behind over the last laps, and what you gain or lose per lap. All classes or your class. |
| Pit Lane Helper | Speed against the pit limit, speed limiter (warning if it is off), distance to your pit box and planned services. Shown only near and in the pit lane. |
| Stint Timer | Stint time and laps, countdown to the maximum stint, driving time of each driver against the fair share or the required minimum. |
| Spotter | Bars on the edges of the screen while a car is alongside, brighter when it is very close. A side flashes green ("clear") once the car is gone, and the bottom of a bar lights up while a car comes up behind on that side (show_clear_signal, show_approaching_cars). |
| Race Notifications | Short messages: places gained or lost (overall and class), penalty, class fastest lap, blue flag, full course yellow, invalid lap. Each type can be turned off. |
| Tyre Temp Trend | Surface temperature of each tyre over the last seconds or per lap, with the optimal temperature given by LMU. |
Telemetry Compare
The Telemetry Compare overlay (off by default, Driver Inputs category) compares your live telemetry with the reference lap of the Telemetry Viewer, on track:
- Charts of speed, throttle and brake (on by default), steering and gear (off by default), over a window of distance around the car:
250m behind and150m ahead by default (distance_behind,distance_ahead). - The reference lap is drawn over the whole window, so its next braking point shows ahead of the car. Your current lap is drawn behind the car, up to the position mark. With the modern design, the reference lap is a soft area with a faint line, your lap a bright line.
- At the top: reference lap time, speed difference (green when you are faster) and delta to the reference lap at the same distance (red when you are slower).
reference_lap_source:Viewer(default) uses the lap set as reference in the Telemetry Viewer for the track and class (with a double-click or the flag button),Bestthe fastest valid recorded lap,Lastthe last recorded lap. Without a lap set in the viewer, the fastest valid lap is used. The reference lap is checked again every few seconds: a new best lap, or a reference changed in the viewer, is used while you drive.- Laps come from the Recorder module: drive a few laps first,
No reference lapis shown until the track and class have one. TheDeltamodule (on by default) keeps the charts moving smoothly between position updates of the game.
Speed Delta
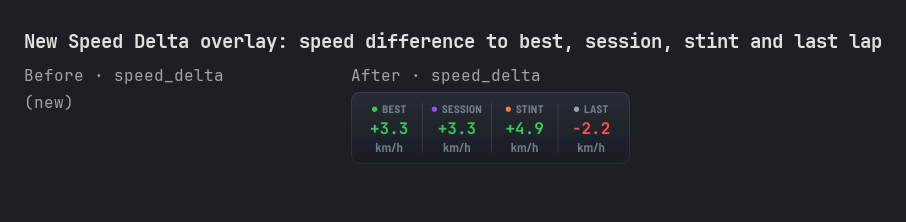
The Speed Delta overlay (off by default, Timing category) shows your speed difference to four reference laps at the same place of the lap: all time best, session best, stint best and last lap. It is positive when you are faster (green in the modern design, red when slower) and smoothed over speed_delta_smoothing_samples samples (10 by default).
- Each reference can be shown or hidden (
show_all_time_best,show_session_best,show_stint_best,show_last_lap), with its own prefix (prefix_*) and colors. - A dash is shown while there is no reference lap yet, on an out lap, or in the pit lane before the start line.
Driver Rank
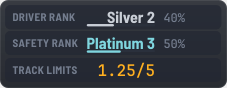
The Driver Rank overlay (off by default, Timing category, Le Mans Ultimate) shows your Driver Rank (DR) and Safety Rank (SR) as the game menu shows them (rank, tier and progress to the next tier), and your track limits points against the points allowed per penalty of the race (1.25/5; no limit in practice and qualifying, which have no penalty).
- Ranks are read from the game folder (
coherent_local_storage.json, written by the game menu, only read): they change once the game menu shows new ones, after an online race. A dash while they are unknown (game folder not found, never signed in online). - The game folder is found like for race results (folder chosen on the
Resultspage, else your Steam libraries); you are found by the Steam account last signed in, else by your game profile name. show_progressshows the progress to the next tier; each item can be shown or hidden (show_driver_rank,show_safety_rank,show_track_limits), with its own prefix and colors in the classic design. The modern design shows each rank in its color, with the progress as a bar.
Relative, Standings and Track Map
- Relative:
Gap Trendcolumn (modern design,column_gap_trend, on by default): how the gap to each car changes per lap, averaged over about 30 s. Green arrow when you gain (closing on the car ahead, pulling away from the car behind), red when you lose, a dash when steady (under 0.05 s per lap) or for a car in the pits. - Standings: class header (modern design,
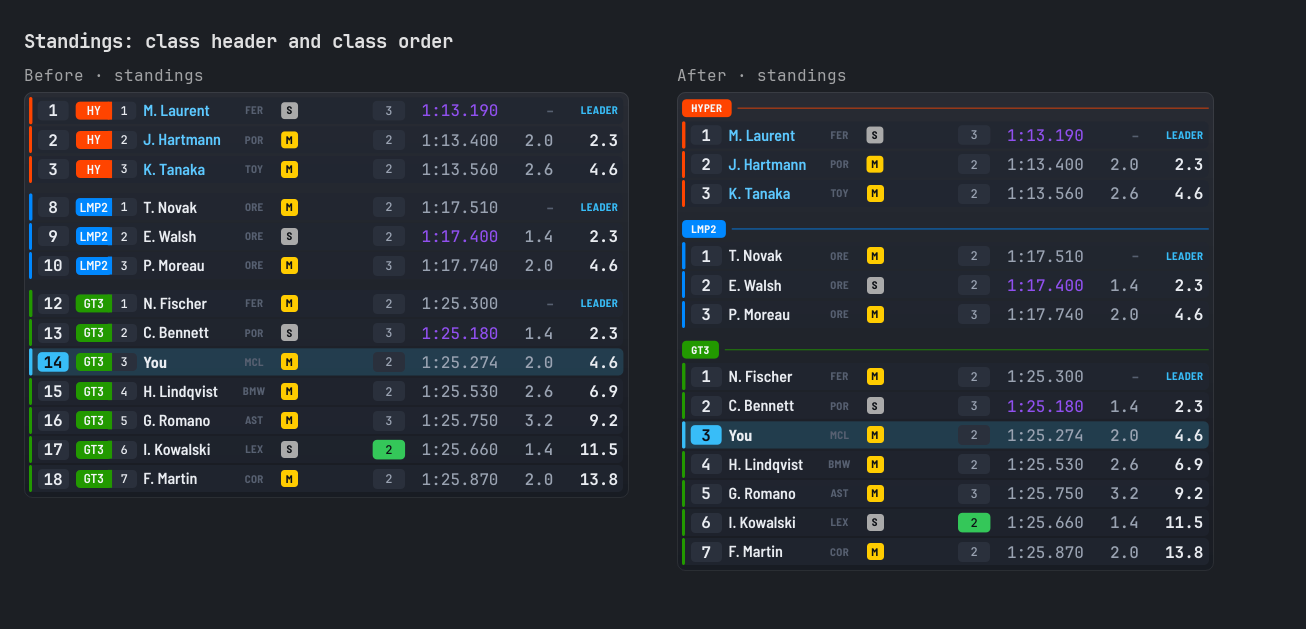
show_class_header, on by default): in multi-class split mode, or with one class shown (enable_single_class_exclusive_mode), each class starts with its name in a colored pill; the class column is left out and the position badge shows the place in class. - Standings: class order (
class_order, both designs): the order of the classes in multi-class split mode (Hypercar, LMP2, LMP3, GT3... by default). InOverlay Options, drag the classes or use the arrows;Default Orderputs the default order back. Classes found in no list come after, fastest first. - Standings: other classes:
maximum_vehicles_per_split_otherstakes any value from0;0hides the other classes. - Relative, Standings, Rivals: lap time like a timing tower (modern design): running time of the lap, then after the line the completed lap and the time behind personal best in turn (same place: narrow column), sector bars colored as the game live timing,
OUT/INlaps, invalid lap in red, trend arrow. - Relative, Standings, Rivals: pit status & stops in one column (modern design): the pit status pill, then the pit stops count or the penalty.
- Relative, Standings, Rivals: real penalties (Le Mans Ultimate): the pit stops column shows the penalty as the game gives it (
DT,SG10,+10s,DQ,+35sadded at finish) instead ofPENor-1. - Standings: column labels (modern design,
show_column_headers, on by default): a row of short labels above the cars. - Standings: gaps and intervals:
Time Gapis the gap to the leader (to the leader's best lap outside races),Intervalthe gap to the car ahead (best lap difference outside races). By class in multi-class split mode or with one class shown (show_time_gap_from_same_class,show_time_interval_from_same_class). - Standings:
Energy per Lapcolumn (modern design, Le Mans Ultimate, off by default): virtual energy each driver used in the last lap, or the average of the last 5 laps, for every car of the session. - Standings:
Track limitscolumn (modern design, Le Mans Ultimate, off by default): the track limits points of each driver, amber once any, red one point before the penalty in races.
- Track map: sector performance (modern design,
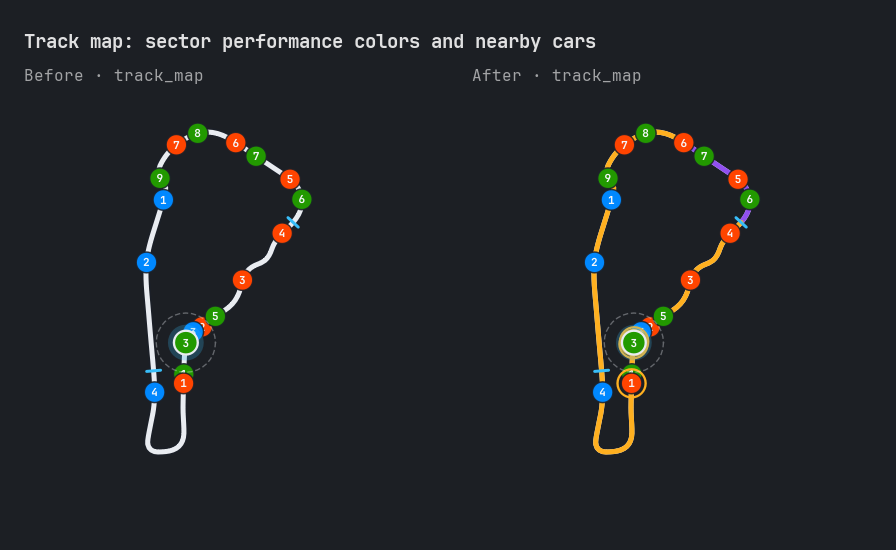
show_sector_performance, on by default): each sector of the road is colored by your most recent time there, as the game live timing: purple for the best of your class in the session, green for your personal best, orange slower. - Track map: nearby cars (modern design,
show_nearby_vehicle_highlight, on by default): cars less thannearby_vehicle_threshold(1.0s) ahead or behind get a ring.
List of overlays
Overlays are grouped by the categories of the Overlays page filter. Names are as shown in the app.
Timing
| Overlay | Shows |
|---|---|
| Delta Graph | Delta along the current lap, as a graph (race aid) |
| Deltabest | Delta to your best lap; optional official delta of LMU; a dash on out laps (pit lane, back to garage) |
| Deltabest Extended | Delta against several lap time sources; session best kept when the app restarts in the same session |
| Gap Trend | Gap to cars ahead and behind, lap after lap (race aid) |
| Driver Rank | Driver Rank (DR), Safety Rank (SR) and track limits points, see above |
| Laps And Position | Lap number, overall position, position in class |
| Lap Time History | Recent lap times |
| Pit Stop Estimate | Estimated pit stop duration and refuelling |
| Race Plan | Next stop of the Race Calculator plan |
| Relative | Cars around you on track, with class, tyres, pit status, gaps and gap trend |
| Relative Finish Order | Estimated finish order between the leader and you, with refuelling estimate |
| Rivals | Cars ahead and behind you in your class |
| Sectors | Sector times and gaps |
| Session | Clock, session name, time left, lap, position |
| Speed Delta | Speed difference to the best, session best, stint best and last lap at the same place of the lap, see above |
| Standings | Classification with selectable columns, class headers and class order |
| Stint History | Previous stints |
| Stint Timer | Stint time and driving time of each driver (race aid) |
| Timing | Lap times, invalid lap indicator |
| Track Clock | Time of day on track, time scale, sunlight phase |
Tyres & Wheels
| Overlay | Shows |
|---|---|
| Friction Circle | G forces in a circle diagram |
| Slip Angle | Tyre slip angle |
| Slip Ratio | Tyre slip ratio |
| Tyre Carcass | Tyre carcass temperature |
| Tyre Deflection | Tyre vertical deflection |
| Tyre Inner Layer | Tyre inner layer temperature |
| Tyre Load | Tyre load and ratio |
| Tyre Pressure | Tyre pressure |
| Tyre Temp Trend | Tyre surface temperature over time (race aid) |
| Tyre Temperature | Tyre surface temperature; optional heatmap centered on the LMU optimal temperature |
| Tyre Wear | Tyre wear |
| Wheel Camber | Wheel camber angle |
| Wheel Toe | Wheel toe angle |
Brakes
| Overlay | Shows |
|---|---|
| Brake Bias | Brake bias |
| Brake Performance | Braking performance |
| Brake Pressure | Brake pressure per wheel |
| Brake Temperature | Brake temperature |
| Brake Wear | Brake wear |
Driver Inputs
| Overlay | Shows |
|---|---|
| Pedal | Pedal inputs and force feedback; throttle & brake bars flash on TC, ABS, wheel lock & spin |
| Telemetry Compare | Speed, pedals, steering and gear against the reference lap of the Telemetry Viewer, with delta |
| Steering Angle | Steering and wheel angle |
| Steering Meter | Steering input |
| Steering Wheel | Virtual steering wheel |
| Trailing | Pedal, steering and force feedback plots, optional pedal bars beside them (same alerts as Pedal) |
Engine & Energy
| Overlay | Shows |
|---|---|
| Battery | Battery usage |
| Cruise | Compass, elevation, odometer |
| DRS | DRS (rear flap) usage |
| Electric Motor | Electric motor usage |
| Engine | Engine usage; engine overheating warning of LMU |
| Engine Temperature | Engine temperatures |
| Fuel | Fuel usage, laps and minutes left, refuelling |
| Fuel Energy Saver | Fuel or virtual energy saving targets |
| Gear | Gear, RPM, speed, battery; speed limiter reminder |
| Instrument | Vehicle instruments: headlights, ignition, clutch |
| Lift And Coast LED | Lift and coast, TC and ABS activation, wheel slip and lock |
| Push To Pass | Push to pass (P2P) usage |
| RPM LED | Shift lights |
| Speedometer | Speed |
| Virtual Energy | Virtual energy usage (LMU Hypercar, LMGT3) |
Chassis
| Overlay | Shows |
|---|---|
| Acceleration | Acceleration timing |
| Damage | Vehicle damage |
| Damage Stats | Damage figures |
| Differential | Differential locking |
| Force | G forces and downforce |
| Rake Angle | Rake angle |
| Ride Height | Ride height, front and rear axle |
| Roll Angle | Front and rear roll angle |
| Suspension Force | Suspension force and ratio |
| Suspension Position | Suspension position |
| Suspension Travel | Suspension travel |
| Weight Distribution | Weight distribution |
Track & Traffic
| Overlay | Shows |
|---|---|
| Chat | In-game chat of LMU; scroll_direction: Upward (newest message at the bottom, default) or Downward (newest at the top); messages fade out at the end of their display time, also in the garage and menus |
| Dashboard HUD | All-in-one view of the car (formerly Black box), see below |
| Elevation | Elevation profile of the track |
| Flag | Flags, pit state, warnings, start lights |
| Heading | Yaw angle, slip angle, heading |
| Navigation | Zoomed map centered on your car |
| Pace Notes | Pace notes and comments |
| Pit Lane Helper | Pit limit, speed limiter, distance to pit box (race aid) |
| Race Notifications | Short race messages (race aid) |
| Radar | Cars around you, seen from above |
| Spotter | Side bars while a car is alongside (race aid) |
| Track Map | Track map with every car; sector performance colors and a ring on nearby cars (modern design) |
| Track Notes | Corner and section names, notes |
| Traffic | Nearest cars closing in: slower car ahead, faster car behind |
| Weather | Weather; wind in LMU |
| Weather Forecast | Weather forecast |
Other
| Overlay | Shows |
|---|---|
| Onboard Setting | ABS and TC levels (LMU) |
| System Performance | CPU and memory usage of the system and of the app |
Track Map, Navigation and Elevation need at least one complete, valid lap on the track: the Mapping module records the map. Brand logos (column column_brand_logo of Relative, Standings and Rivals, on by default and turned on once in existing presets) are the real logos of Le Mans Ultimate: the app takes them from the game running on your computer (Rest API access of Config > Le Mans Ultimate API on, the default) and keeps them in the gameimage folder, so they show up after the game was open once with the app. A PNG file of your own named after a brand in the brandlogo folder is shown instead; with rFactor 2, own files are the only logos. While a brand has no logo, its first letters are shown.
Dashboard HUD
The Dashboard HUD (formerly Black box, setting name black_box) is an all-in-one view of the four wheels and the car. Its modern design keeps the same layout and options, drawn in the Barlow font and the theme colors (enable_classic_layout brings the classic look back):
- tyres at each corner seen from above, with temperatures, pressures, wear, wheel lock and spin outlines, steering and suspension movement, without overlaps even at full lock. Suspension movement is magnified 8 times by default (
suspension_motion_scale) so it can be seen, which makes the overlay about 15 % taller; set it to1for the previous size; - brakes, suspension, damage panel, fuel and energy gauges, battery, RPM LEDs, gear and speed;
- chips for ABS, TC, brake bias and engine map, icons for headlights, wipers (with their mode) and engine;
- a setting change pop-up in the center column: change TC, ABS, brake bias, engine map or an anti-roll bar in the car and it shows the new value and highest level for 2 seconds (
TC 4/9 ▲), green when it went up, red when it went down; pit limiter, headlights and wipers changes too; - optional center column items (LMU): track limits points (
LIMITS 1.25/5), gap to the car ahead and behind, lift & coast bar; - an event log and incident recorder: contacts (with the name of the other driver, or the wall, in LMU), penalties and track limits.
In the Overlay Options page its options are in its own sections (profile, size and layout, tyres, brakes, incident recorder...), with a simple mode for the main items (Advanced Options or a search shows them all) and default or colorblind safe colors. Click a part of its picture (a tyre, the center column, the damage panel...) to jump to its options. Display profiles (Minimal, Sprint, Endurance, and your own User 1 to User 3 saved with Save as Profile...) set the items shown; the active one is named at the top of the page, and changing an option it sets switches to Custom, keeping its other values. Hotkeys black_box_next_incident (show older incidents) and black_box_open_incident_folder work with the incident recorder; incidents are saved in the blackbox folder of the global config folder. While incident file export is on, right-click the Dashboard HUD (overlay unlocked) for Open Incident Folder.
Widget plugins
You can add your own overlays as plugins: a folder in plugins (next to the app) with a setting.json and a widget.py. Tools > Plugin Manager shows their state, enables or disables them, reloads their code and installs plugins from a .zip. See Widget plugins.
[!WARNING] Plugins are normal Python code with full access to your computer. Only install plugins from sources you trust.