Pair wise DEG - Kan-E/RNAseqChef GitHub Wiki
Pair-wise DEG detects and visualizes differentially expressed genes. This function executes a series of pairwise DEG analyses such as “DEG (differentially expressed gene) detection”, “clustering analysis”, and “enrichment analysis”.
Three types of raw count data format can be used as inputs.
The upload format can be switched by clicking a button, as shown below.
The analysis can only be performed with raw count data if the following conditions are fulfilled:
- A file consists of only two groups of data to be analyzed.
- The replication number is represented by the underline “_”.
- Do not use the underline "_" for anything else.
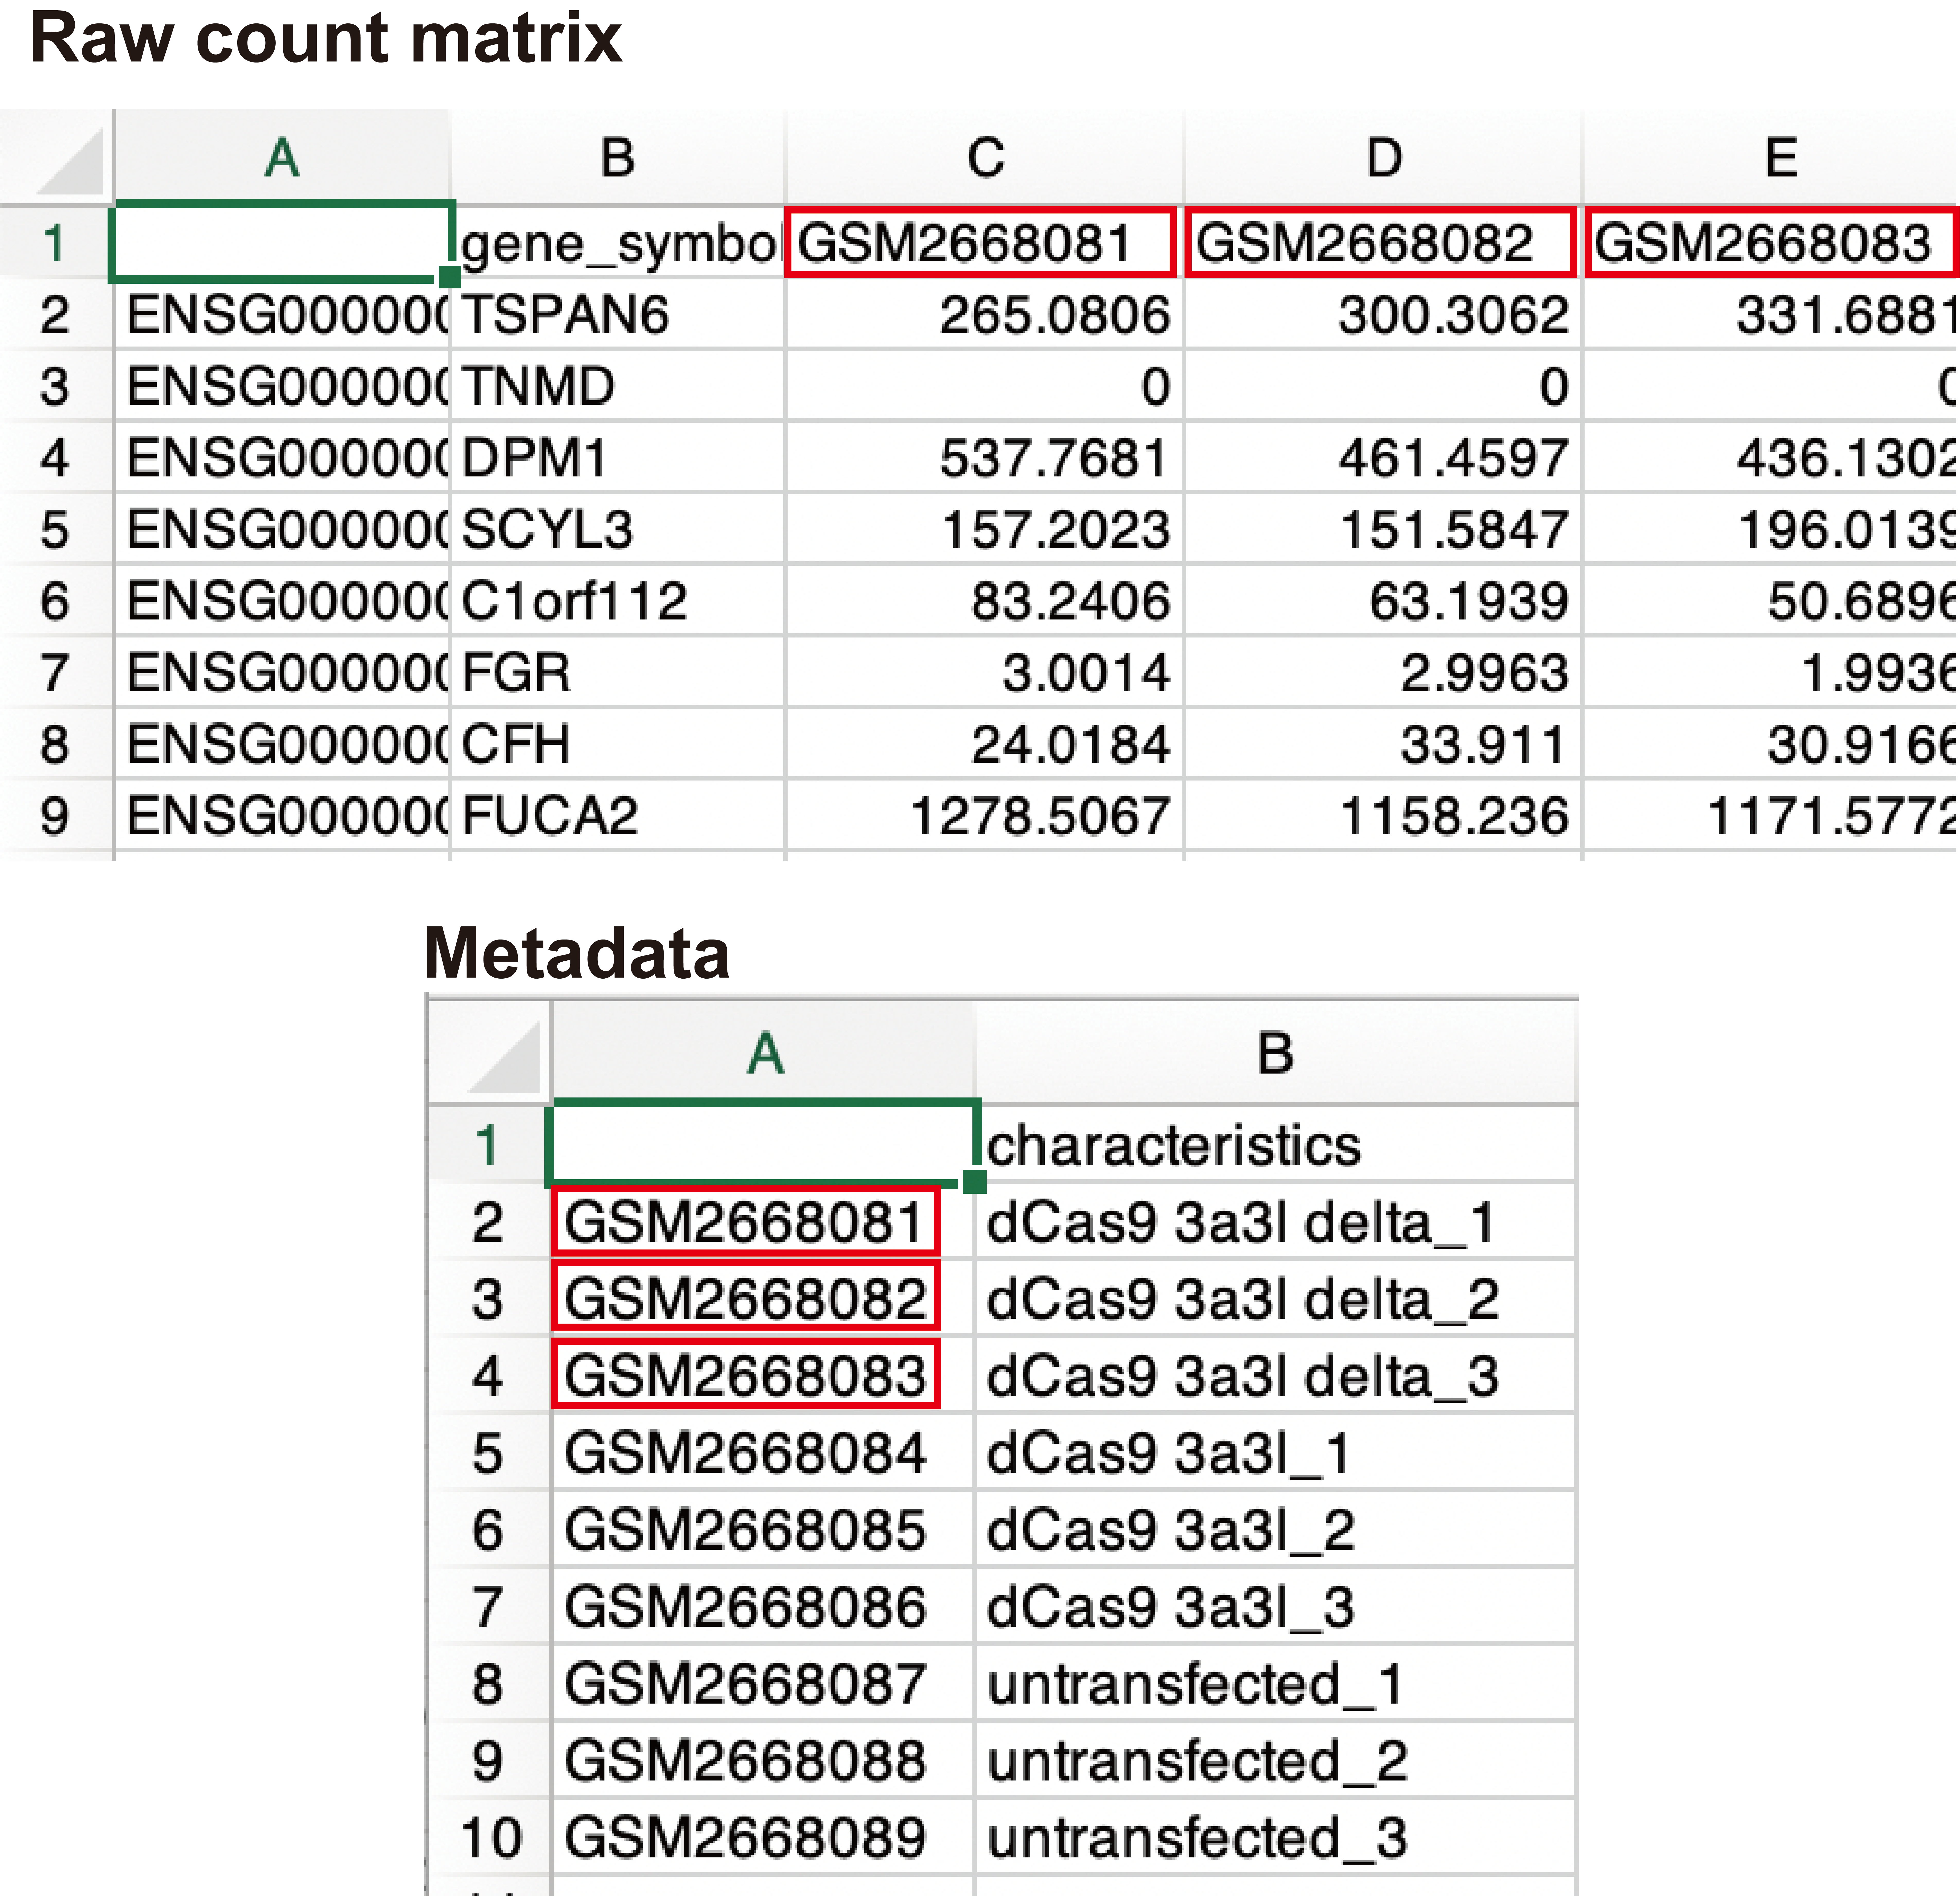
This format can be used if the above conditions are not fulfilled, for example, if the sample name is an accession number, or if the raw count data contain extra information that is not the subject of analysis.
Metadata must contain the following information:
- The first column is the sample names used in the raw count data.(e.g., accession number)
- The second column is the corresponding sample name that matches the sample name in the first column. (e.g. Control_1)
- The third and subsequent columns do not affect the analysis.
Batch processing can only be performed with raw count data if the following conditions are satisfied.
- A file consists of only two groups of data to be analyzed.
- The replication number is represented by the underline "_".
- Do not use the underline "_" for anything else. In this batch mode, the resulting data can not be displayed in the output panel.
The zip files can be obtained, including clustering, MA_plot, DEG_result, DEG count data (up and down), and normalized count data, by clicking the download button.
The following three types of DEG analysis can be selected.
The following three types of FDR methods can be selected if the DEG analysis method is DESeq2 or edgeR.
- BH, Benjamini-Hochberg method (default)
- Qvalue, Storey method
-
IHW, Independent Hypothesis Weighting
The following analysis is performed by selecting the dataset species.
- Conversion to gene symbols if the gene name is ENSEMBL ID
- Enrichment analysis
Three types of thresholds can be set: fold change, FDR, and base mean.
The base mean cut-off can be set using the uploaded normalized count data, such as TPM counts.
The y-axis of the boxplot can be displayed using the uploaded normalized count data.
Note: Uploading raw count data is not unnecessary.
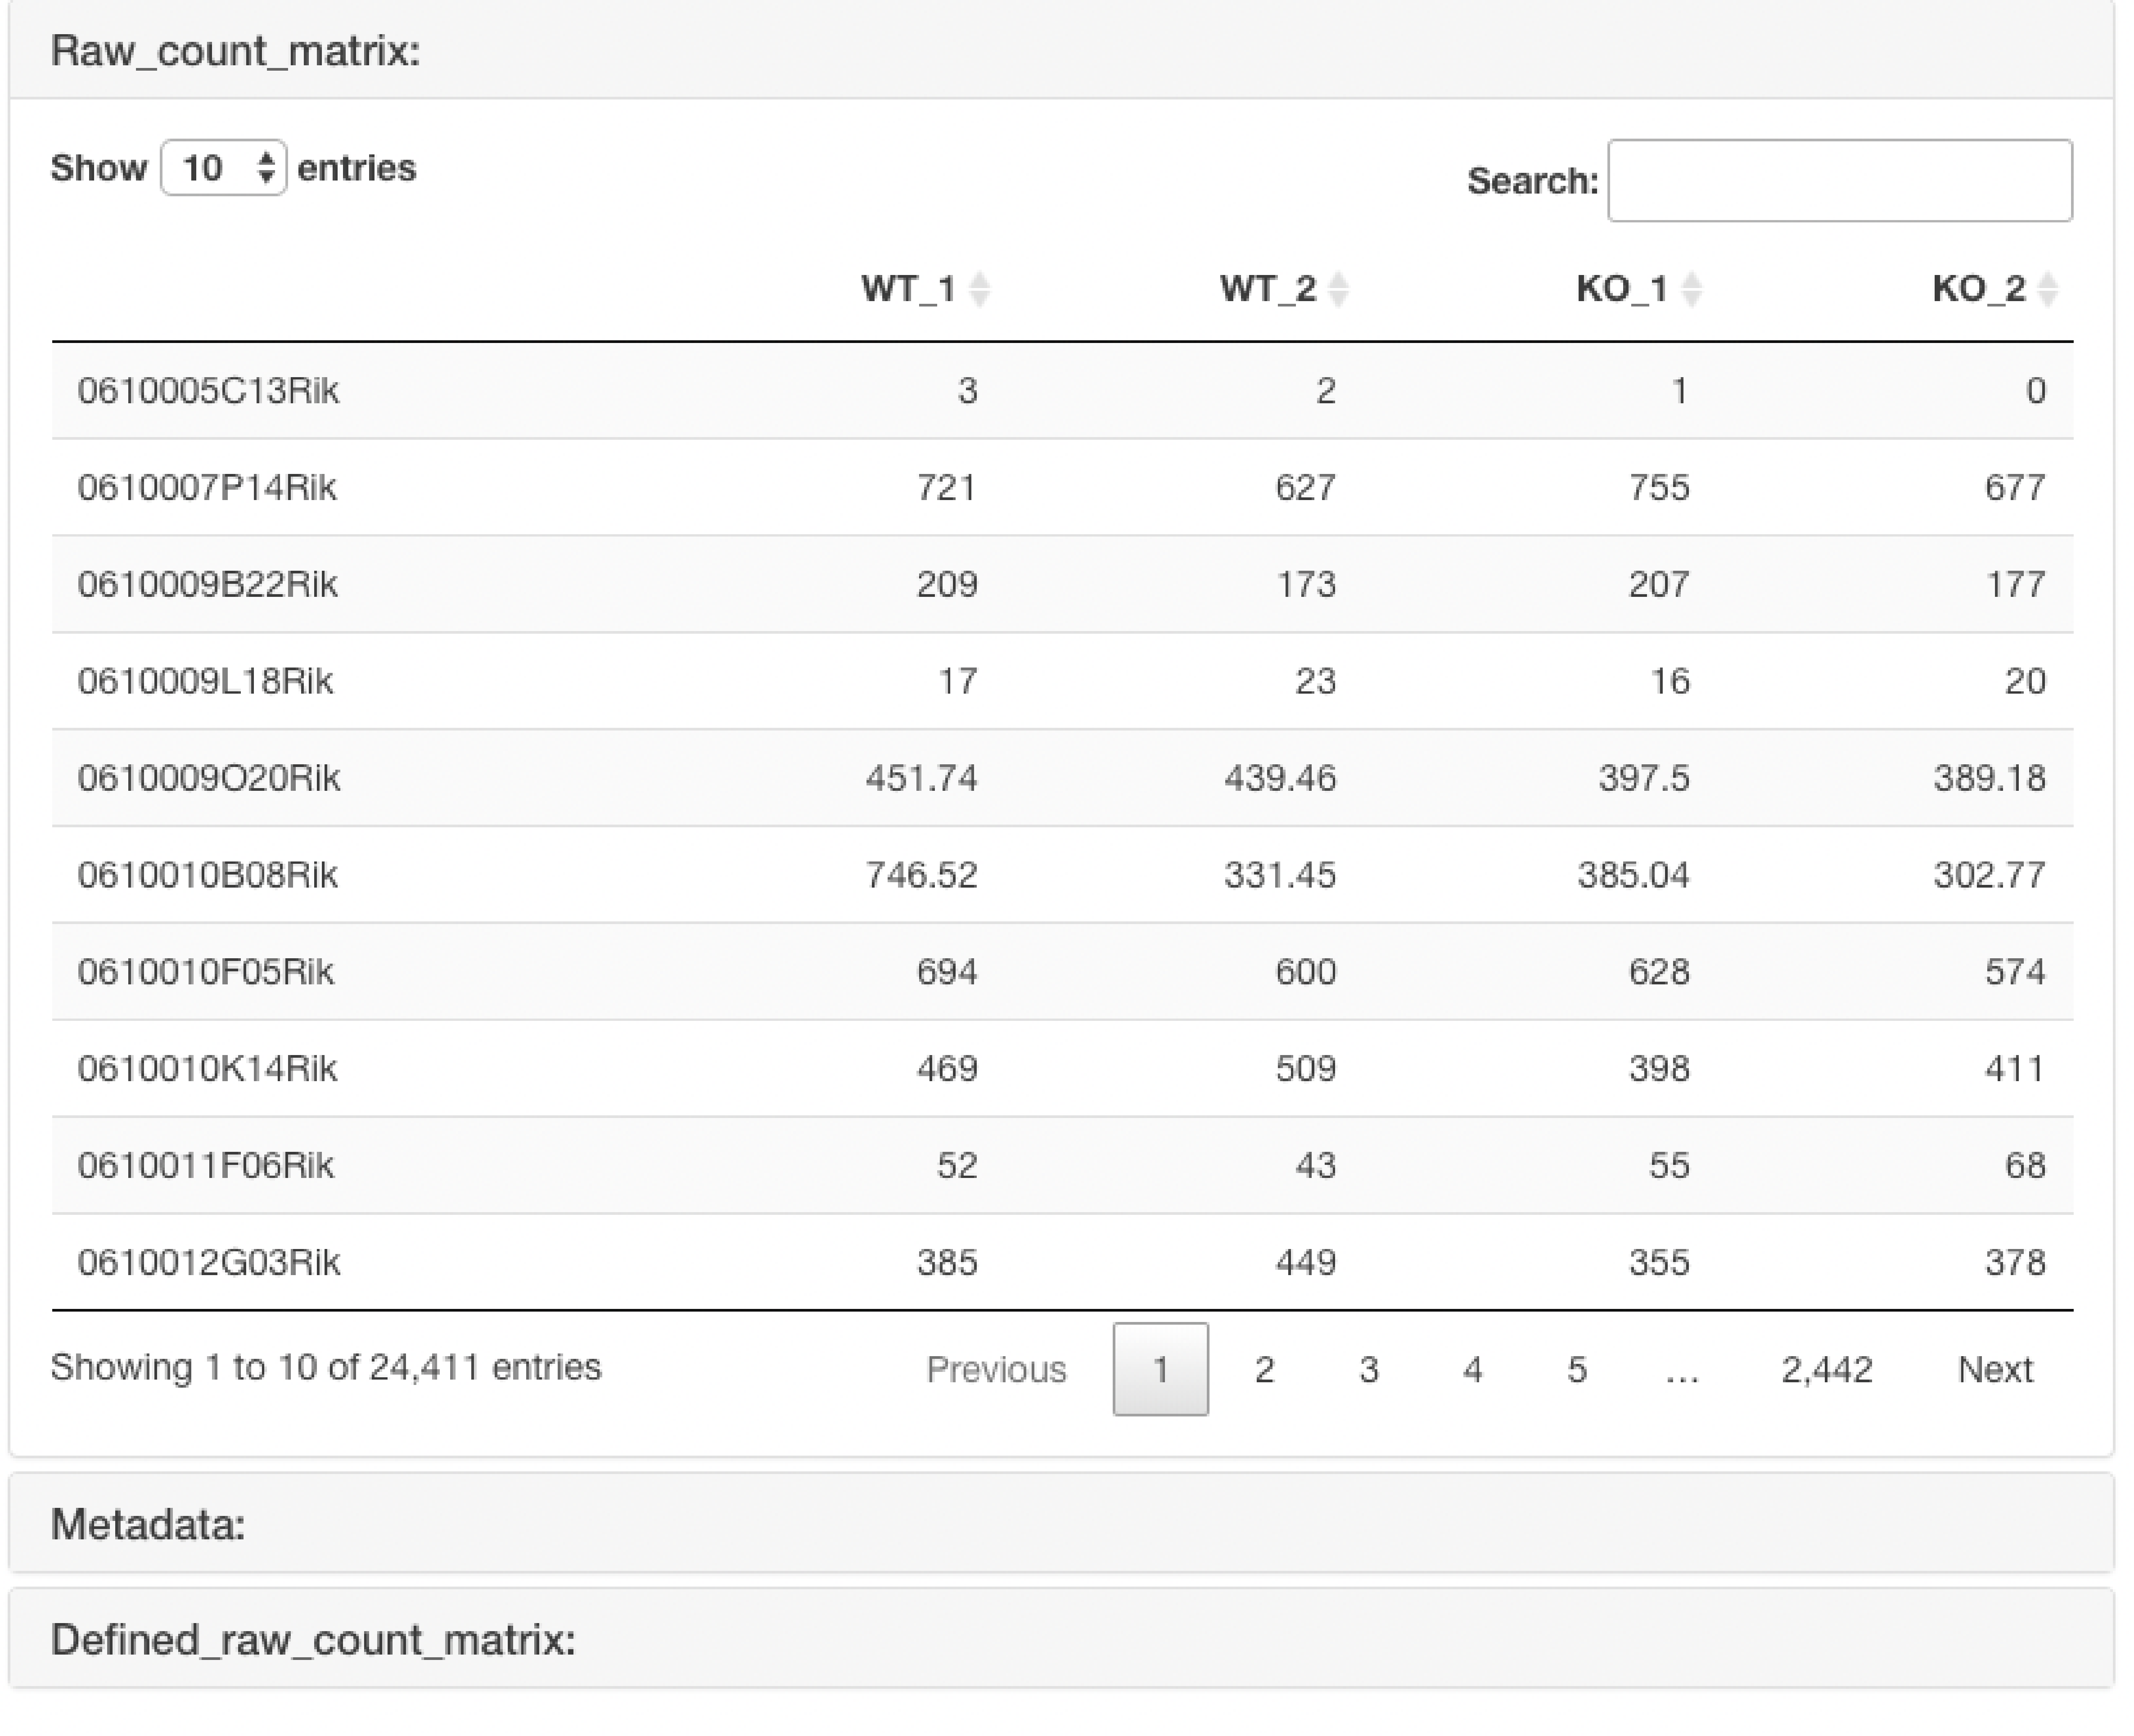
The uploaded raw count data are displayed.
In the case of the "Raw count data + metadata" format, it also displays the raw count data that is re-defined using the uploaded metadata.
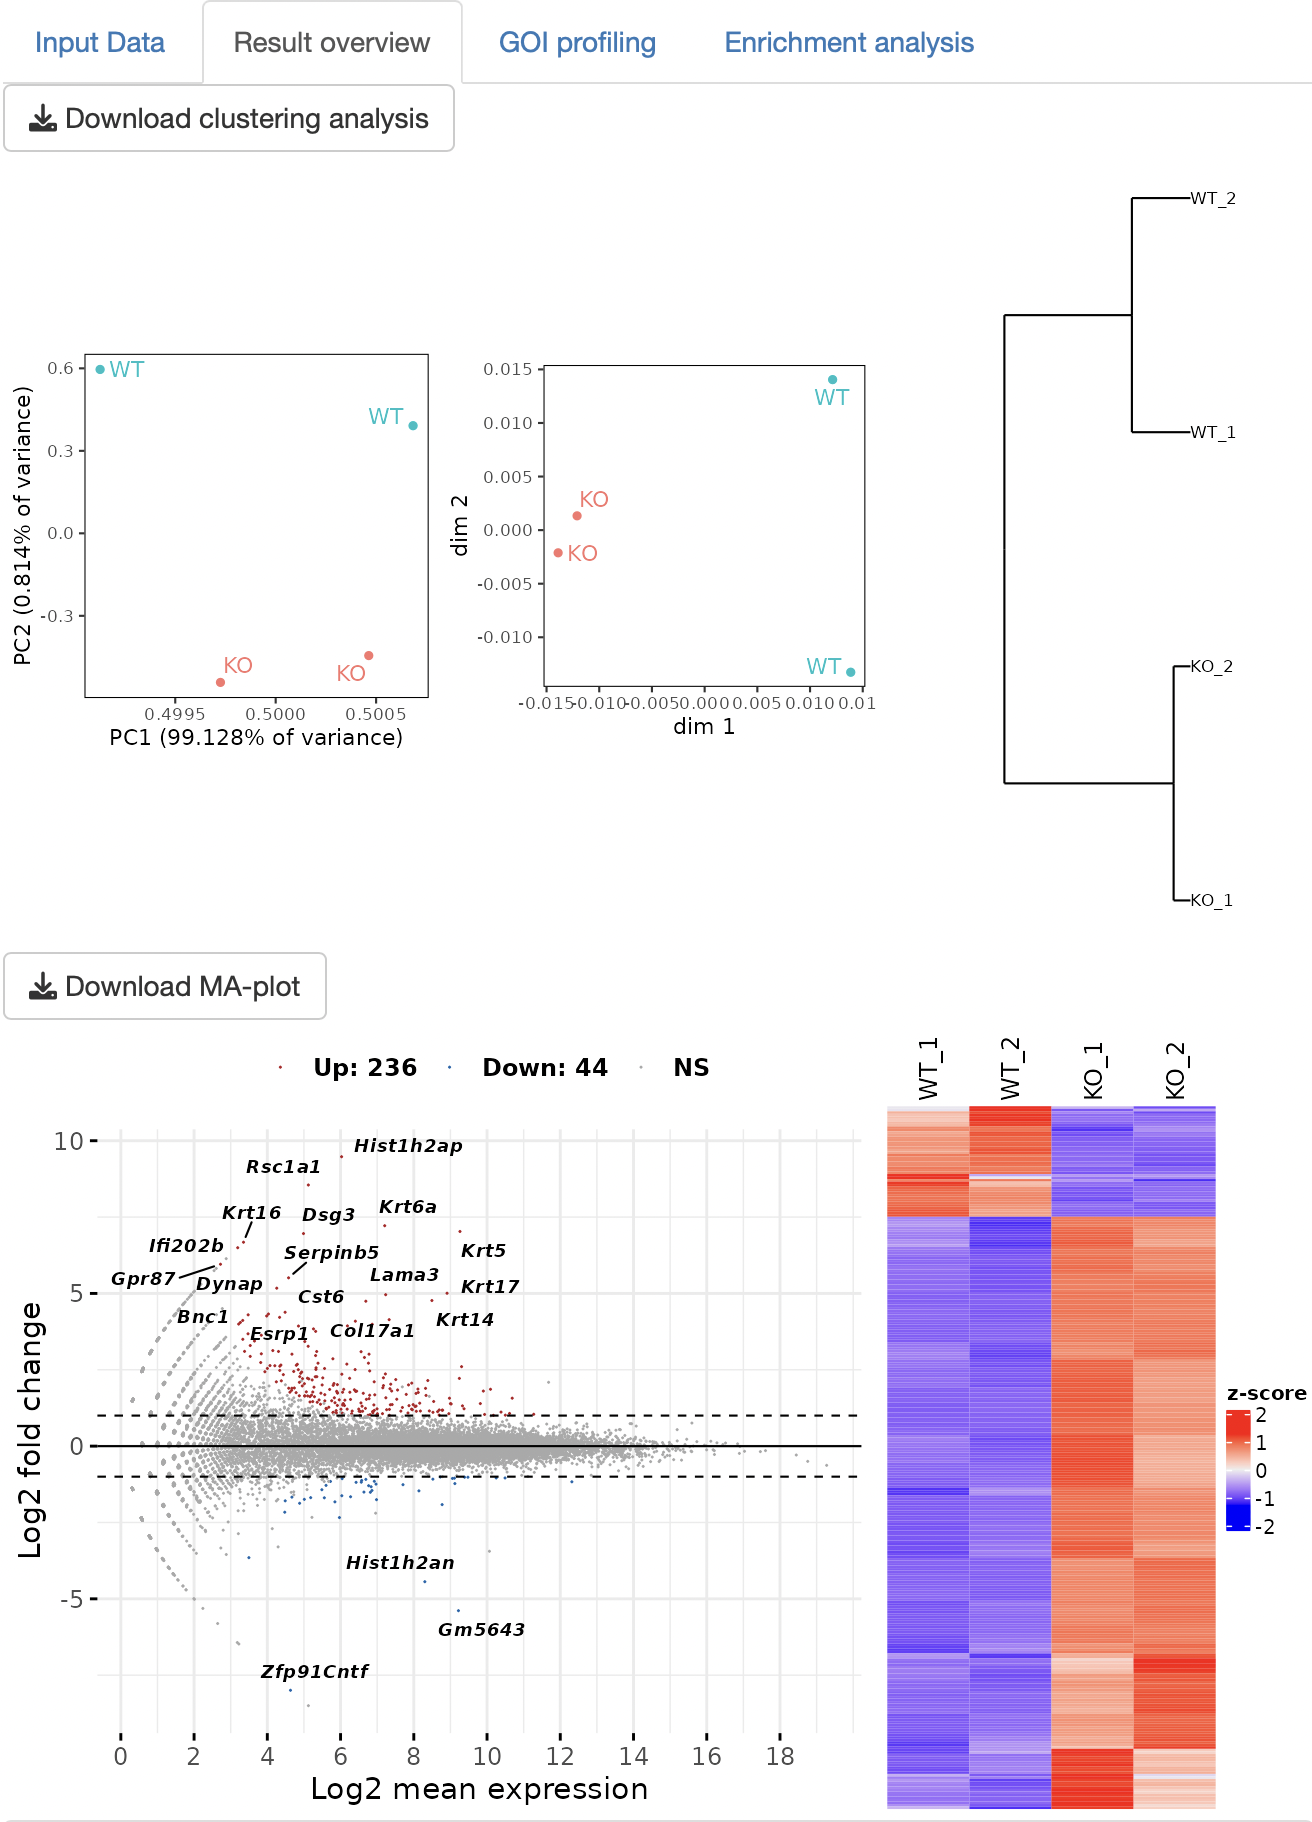
Three types of clustering analyses are performed: principal component analysis (PCA), multidimensional scaling (MDS), and hierarchical clustering with the ward.D2.
The DEG analysis that is selected in the setting panel is performed to detect DEGs. The MA plot and heatmap are displayed as a result of DEG analysis.
The result table data of the DEG analysis are displayed.
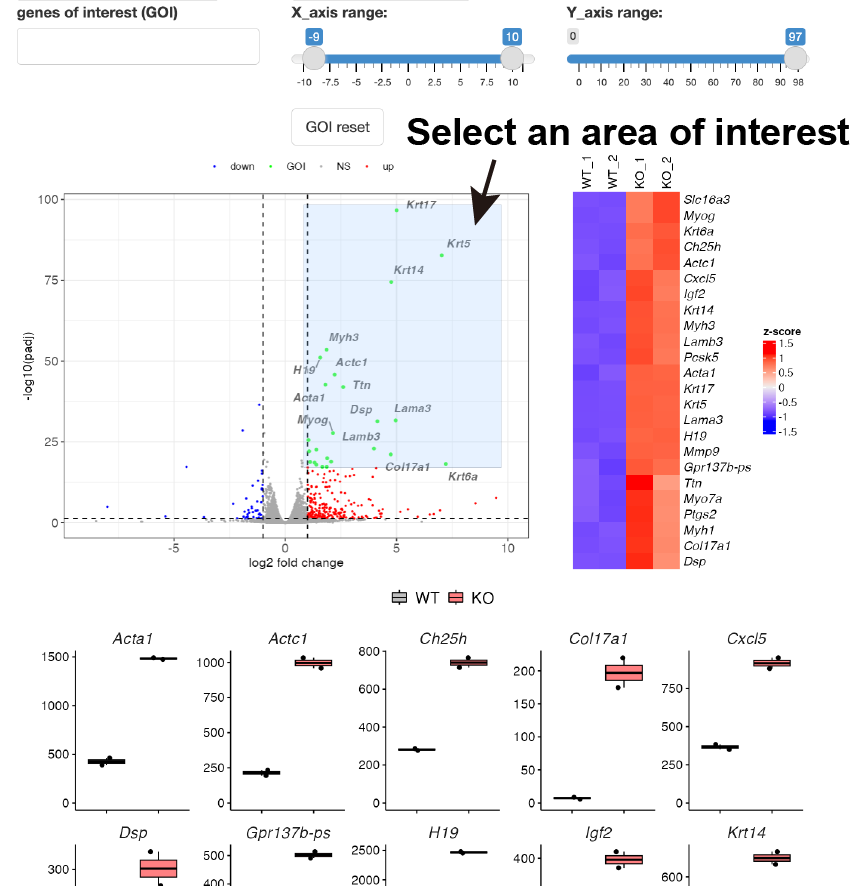
Volcano plot is shown.
By selecting genes from the GOI list, only the GOI can be labeled among the points displayed in the volcano plot.
The x- and y-axis ranges could be freely changed by operating the slide bar.
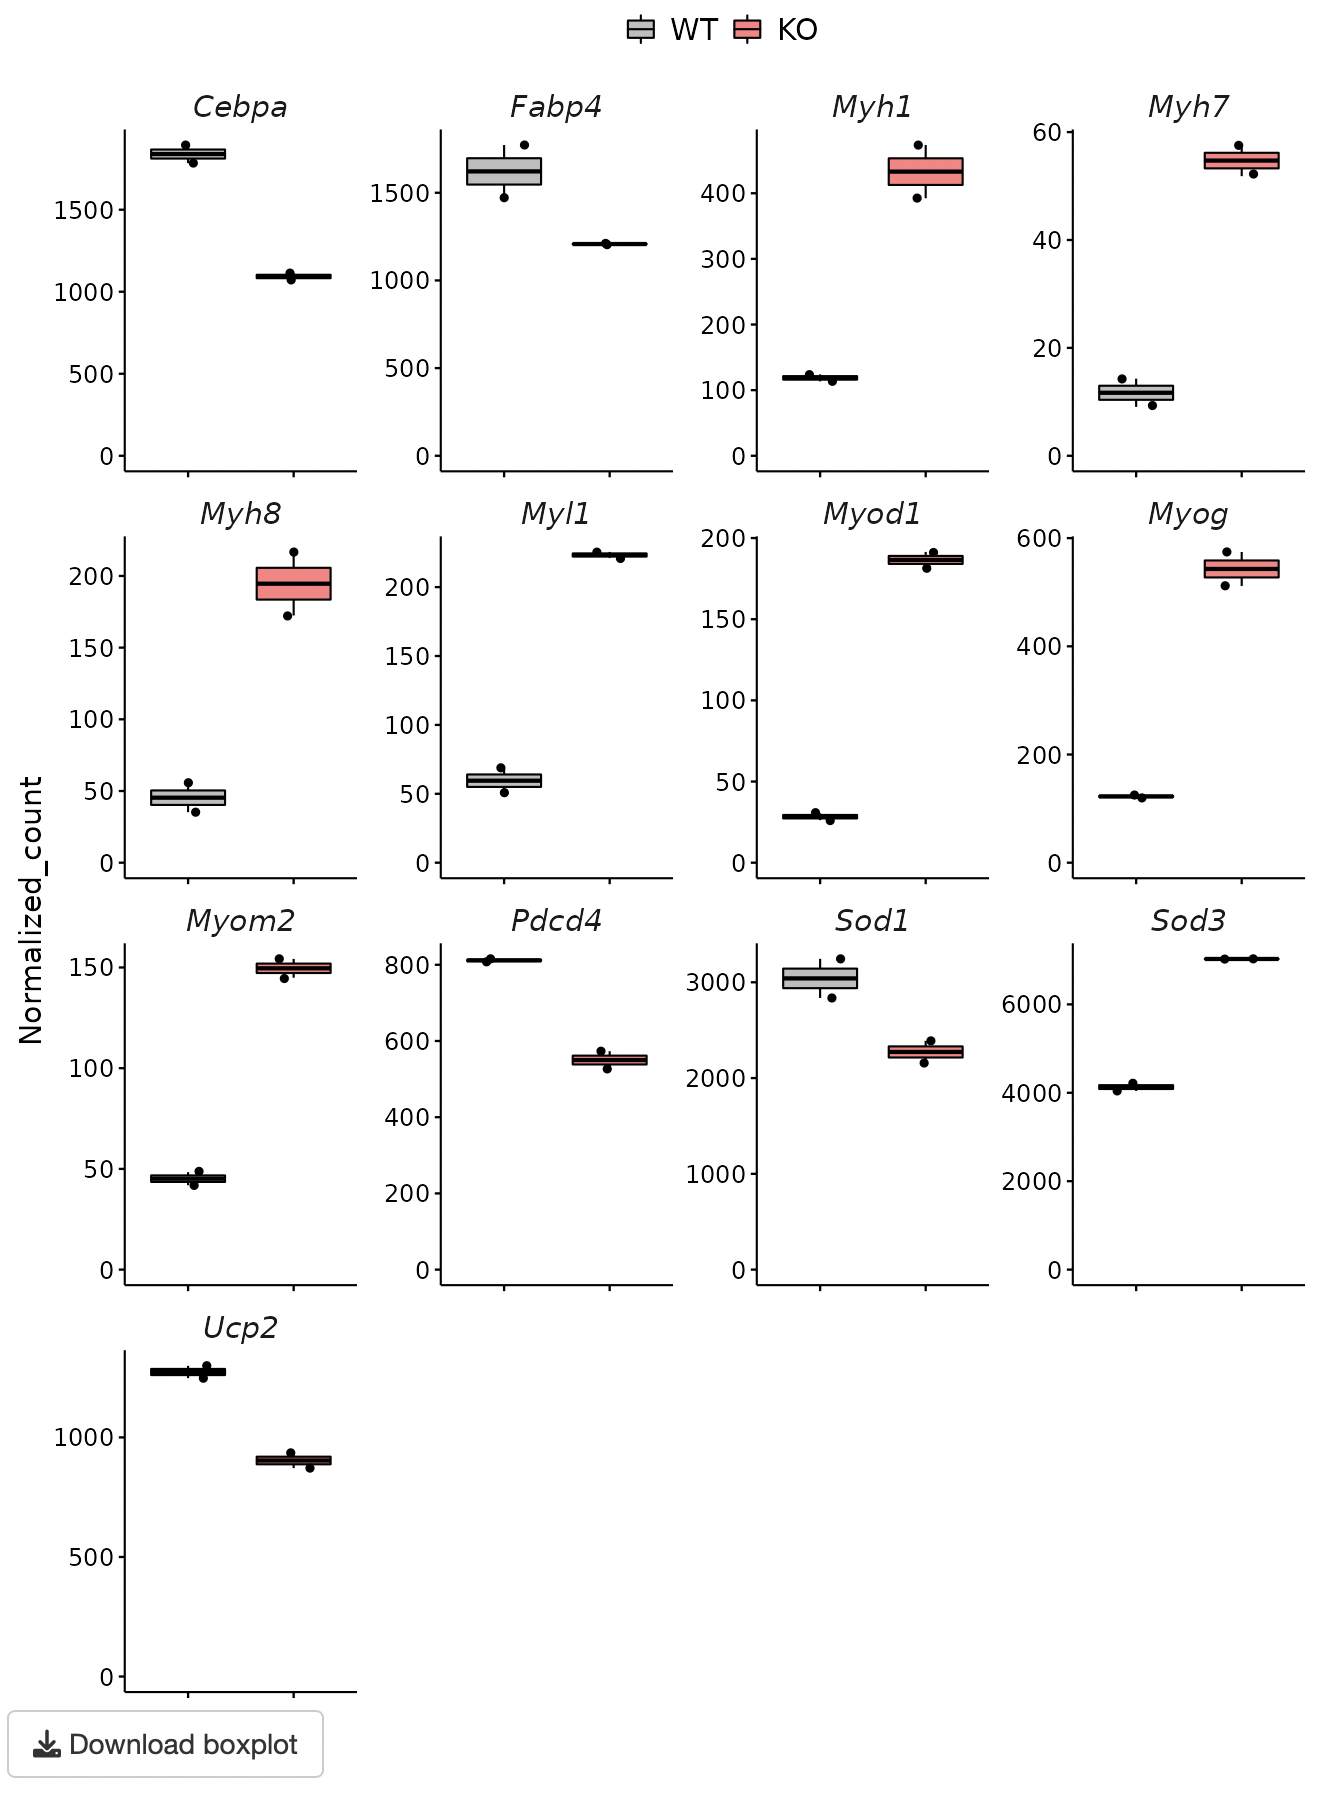
A heatmap and boxplot of the genes selected from the GOI list are displayed.
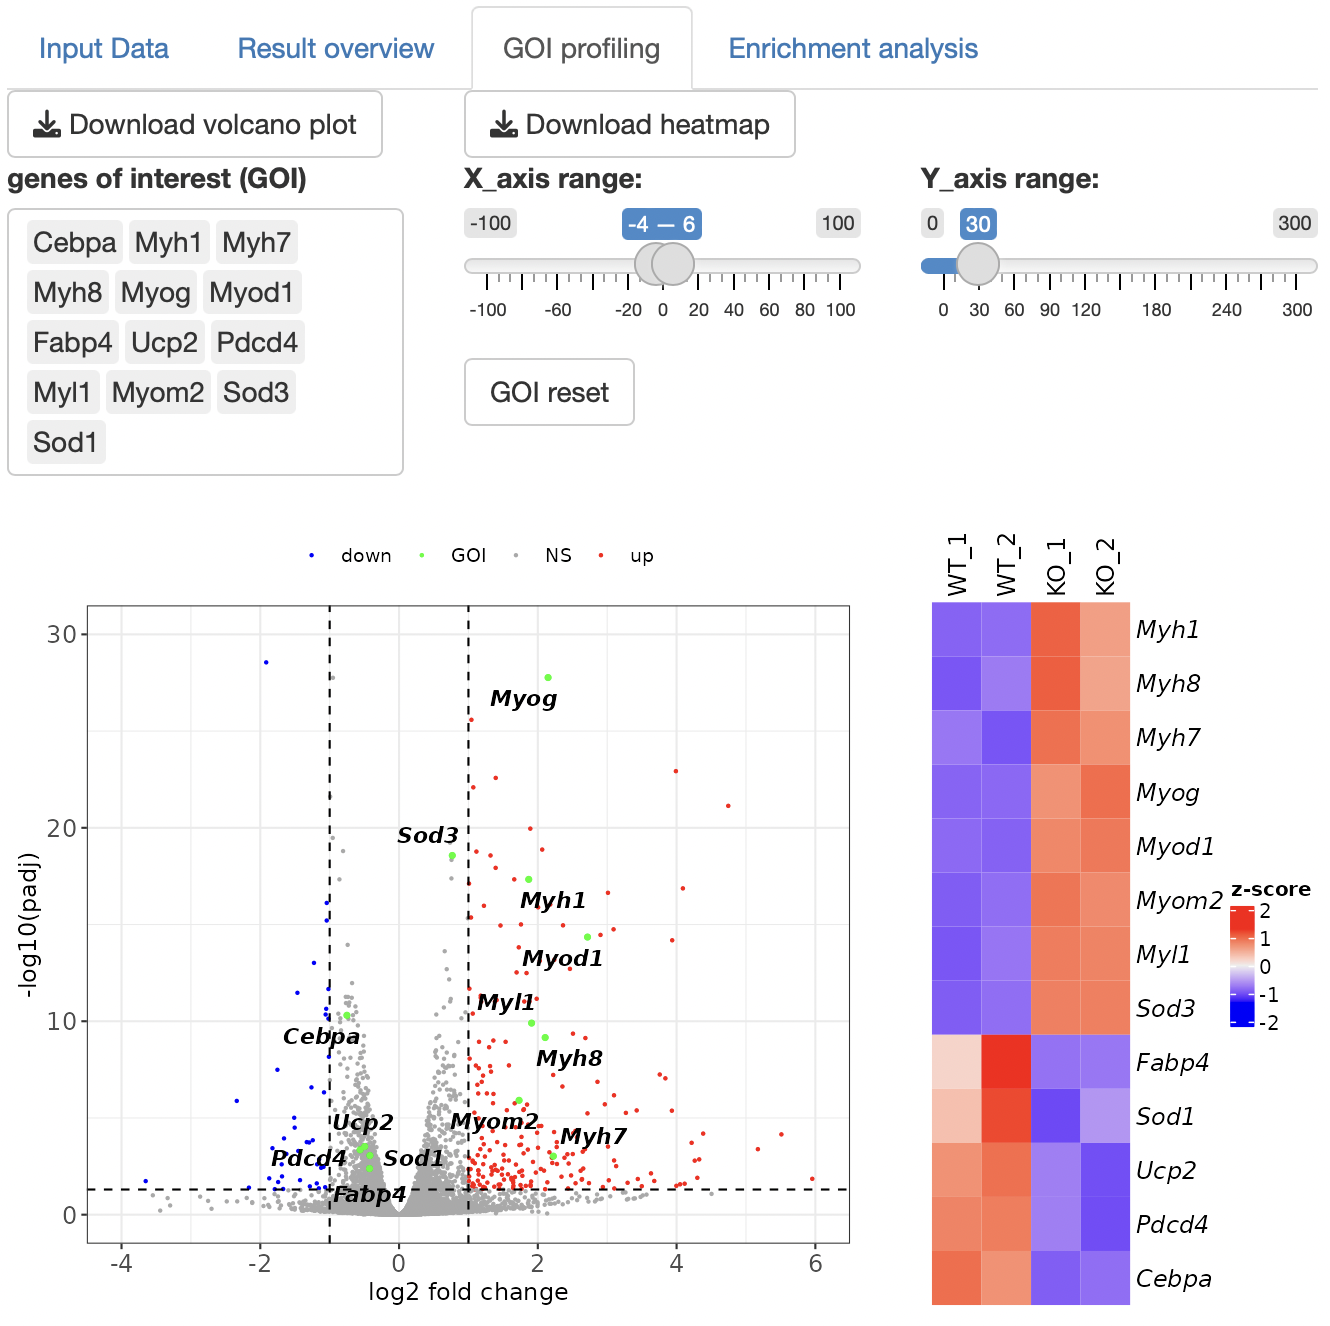
You can also select genes by drawing the box on the volcano plot.
Over-representation analysis and GSEA (gene set enrichment analysis), are performed to identify the function of DEGs.
The gene set can be selected from the following:
MSigDB hallmark gene
KEGG
Reactome
PID (Pathway Interaction Database)
BioCarta
WikiPathways
GO (biological process, cellular component, and molecular function)
Human phenotype ontology
DoRothEA regulon (activator)
DoRothEA regulon (repressor)
Transcription factor targets
miRNA target
Dotplots, GSEA plots, and gene-concept network, cnet, plots are displayed as the result.
Enrichment analysis depends on ClusterProfiler.