Enrichment viewer - Kan-E/RNAseqChef GitHub Wiki
Enrichment viewer determines and visualizes the biological functions of the gene sets of interest.
By using the result table data of the Venn diagram and k-means clustering as input files, the functions of the identified gene groups can be compared and visualized.
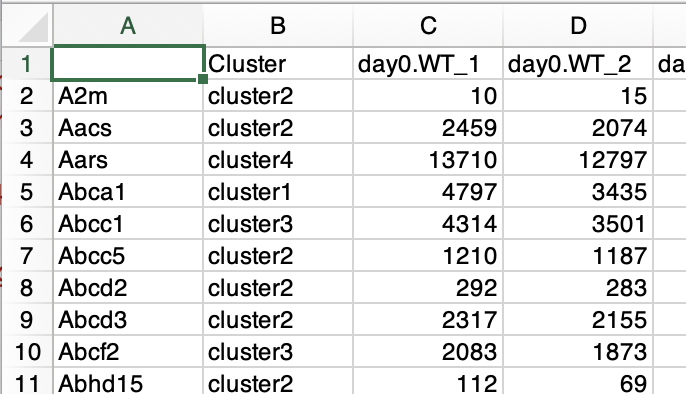
The format of the gene list used as input is as follows.
- The first column is the gene name.
- The second column is the corresponding group name that matches the gene name in the first column.
- The third and subsequent columns do not affect the analysis.
There is no problem even if count data is included because the third and subsequent columns do not affect the analysis.
The table data obtained by Venn diagram or k-means clustering can be used without changing the format.
The format of the gene list used as input is as follows.
- The first column is the gene name.
- The second and subsequent columns do not affect the analysis.
- File names are used as group names.
- File names do not use `.` other than the extension.
This format is the same as the input format of the "Venn diagram" section.
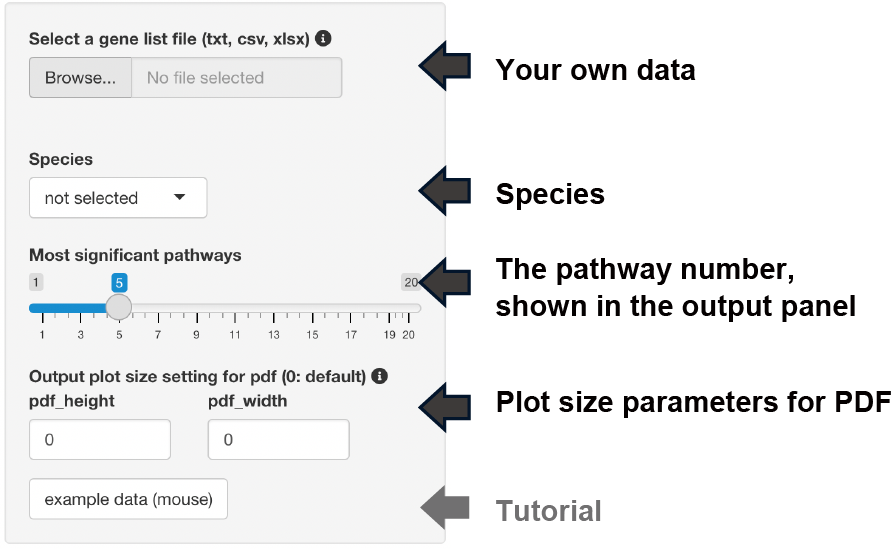
The following analysis is performed by selecting the dataset species.
- Conversion to gene symbols if the gene name is ENSEMBL ID
- Enrichment analysis
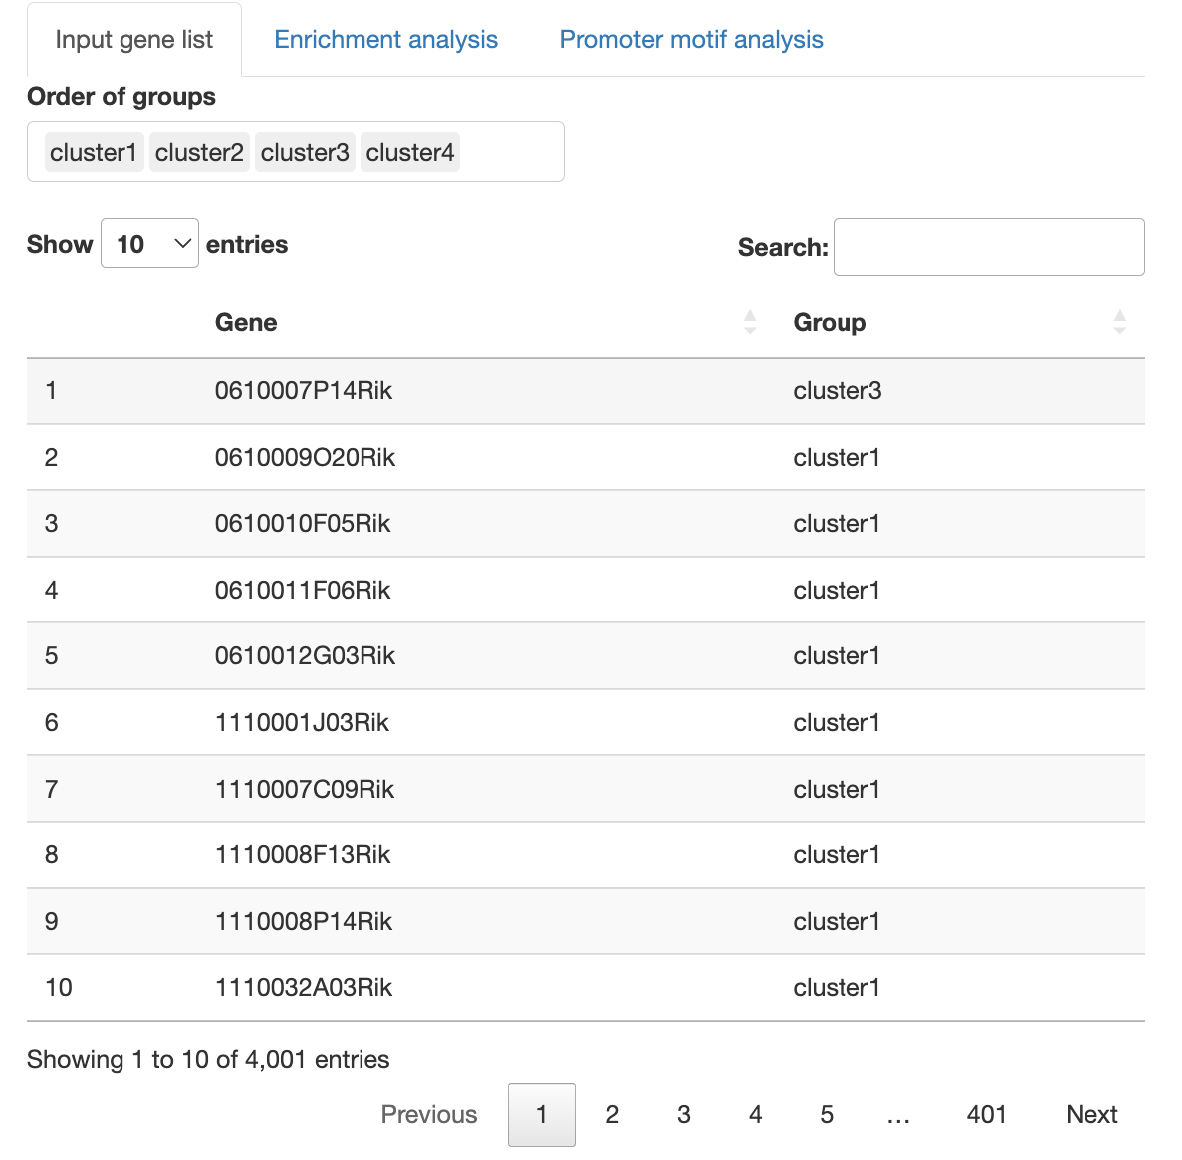
You can change the number of pathways displayed in the graphs.
The uploaded gene list is displayed.
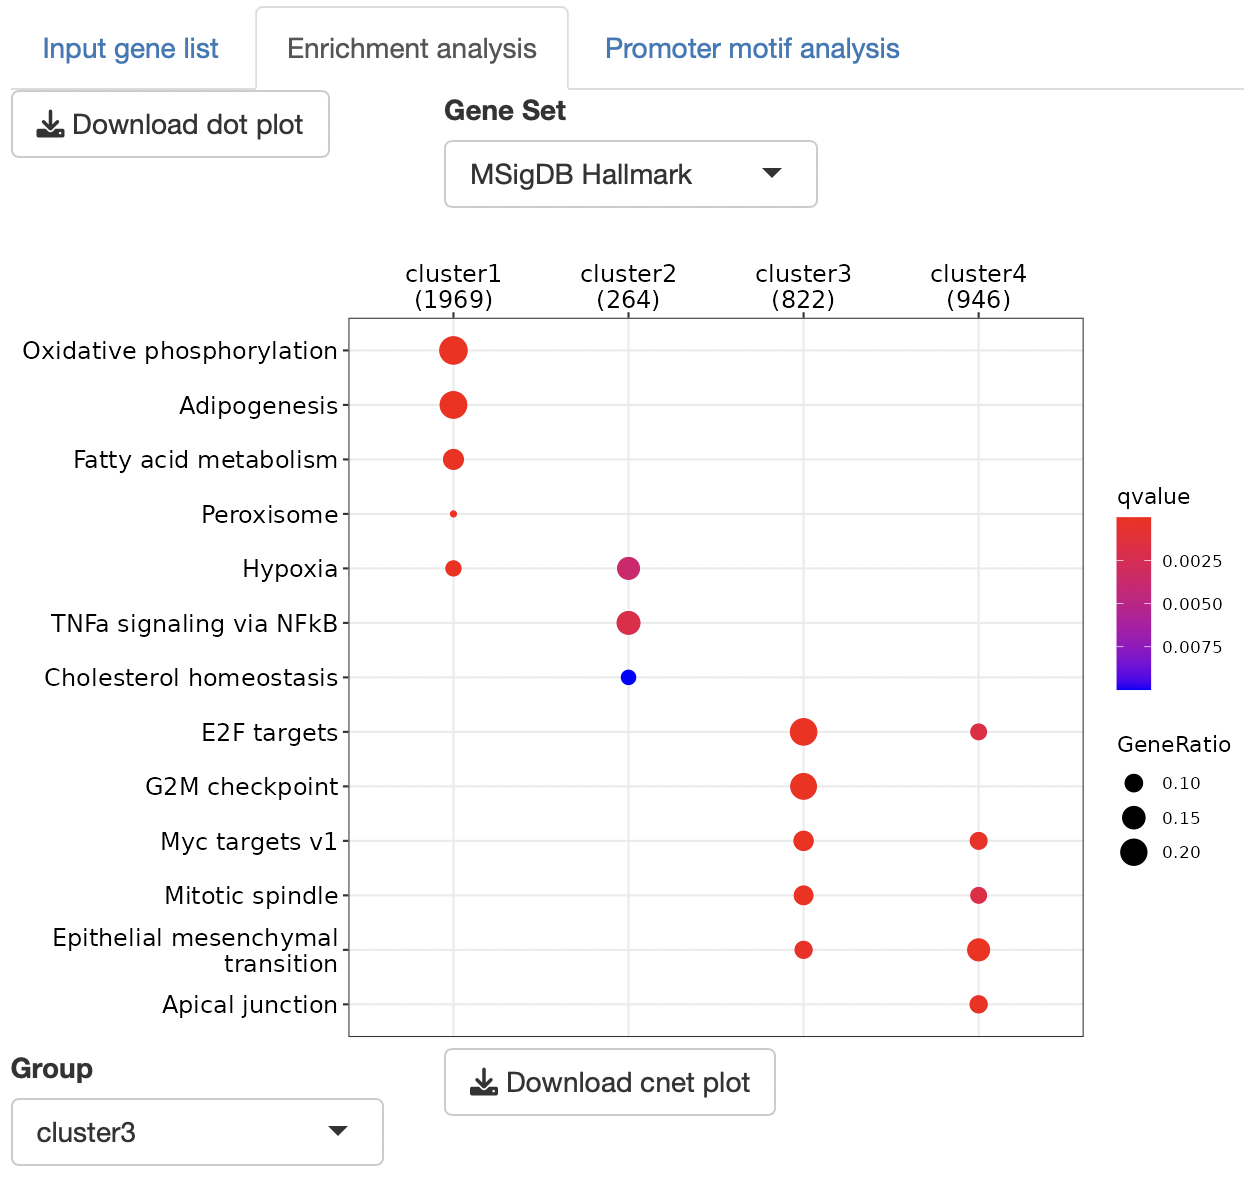
Overrepresentation analysis is performed to identify the function of gene sets.
The gene set can be selected from the following:
MSigDB hallmark gene
KEGG
Reactome
PID (Pathway Interaction Database)
BioCarta
WikiPathways
GO (biological process, cellular component, and molecular function)
Human phenotype ontology
DoRothEA regulon (activator)
DoRothEA regulon (repressor)
Transcription factor targets
miRNA target
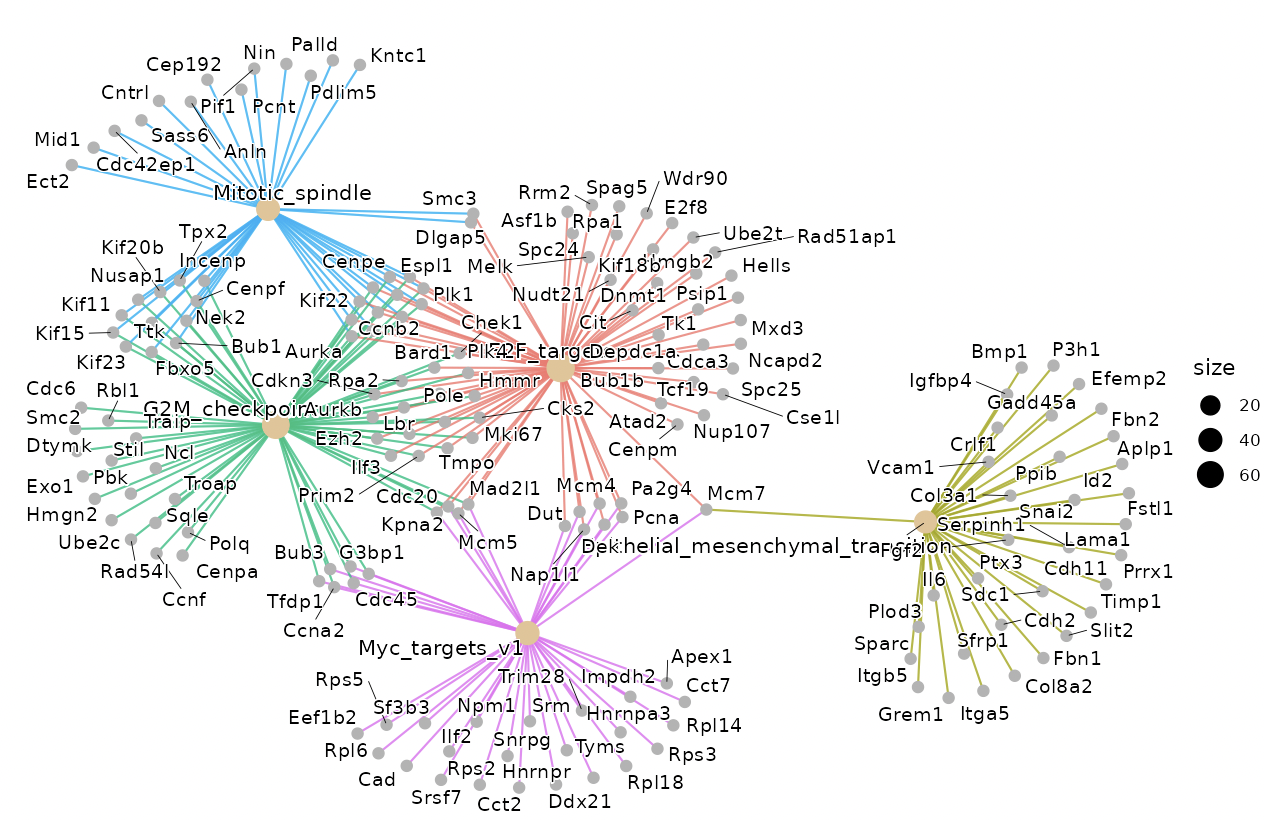
Dotplots and gene-concept network, cnet, plots are displayed as the result.
The group displayed by the cnet plots can be switched by selecting from the "Group" list.
Enrichment analysis depends on ClusterProfiler.
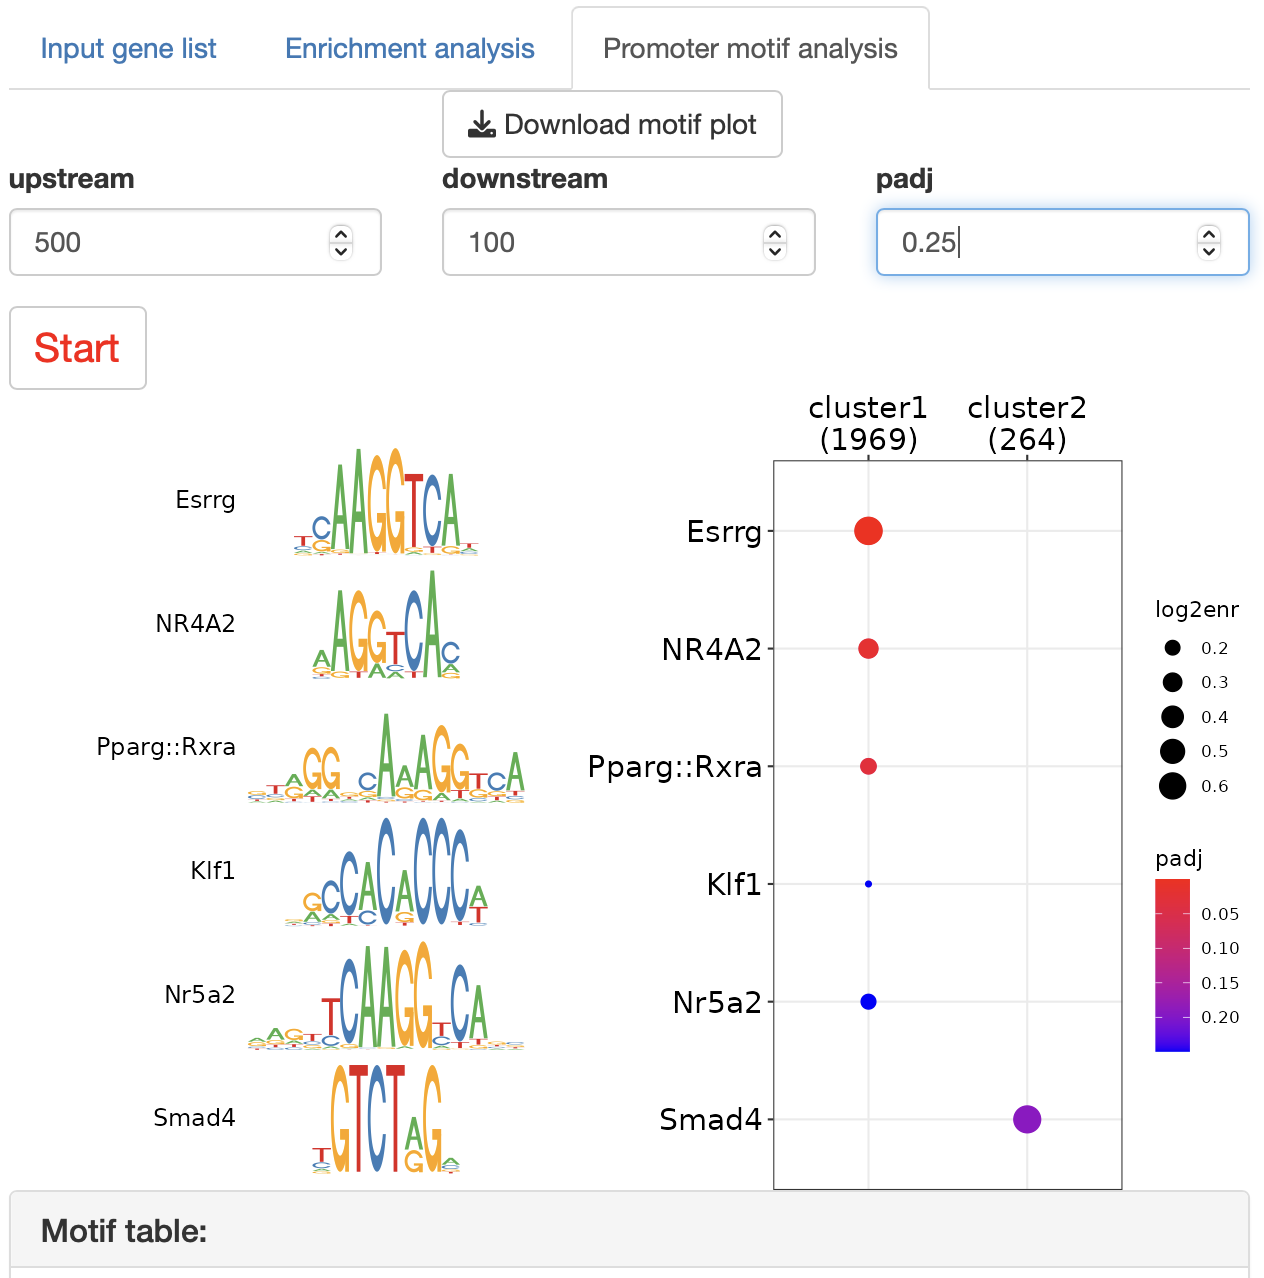
Promoter motif analysis identifies the DNA-binding motifs that enrich the promoter region of each gene group.
Species: human (hg19) or mouse (mm10)
Upstream: upstream range from the TSS
Downstream: downstream range from the TSS
padj: threshold for dotplot
Press "Start" button to start the analysis.
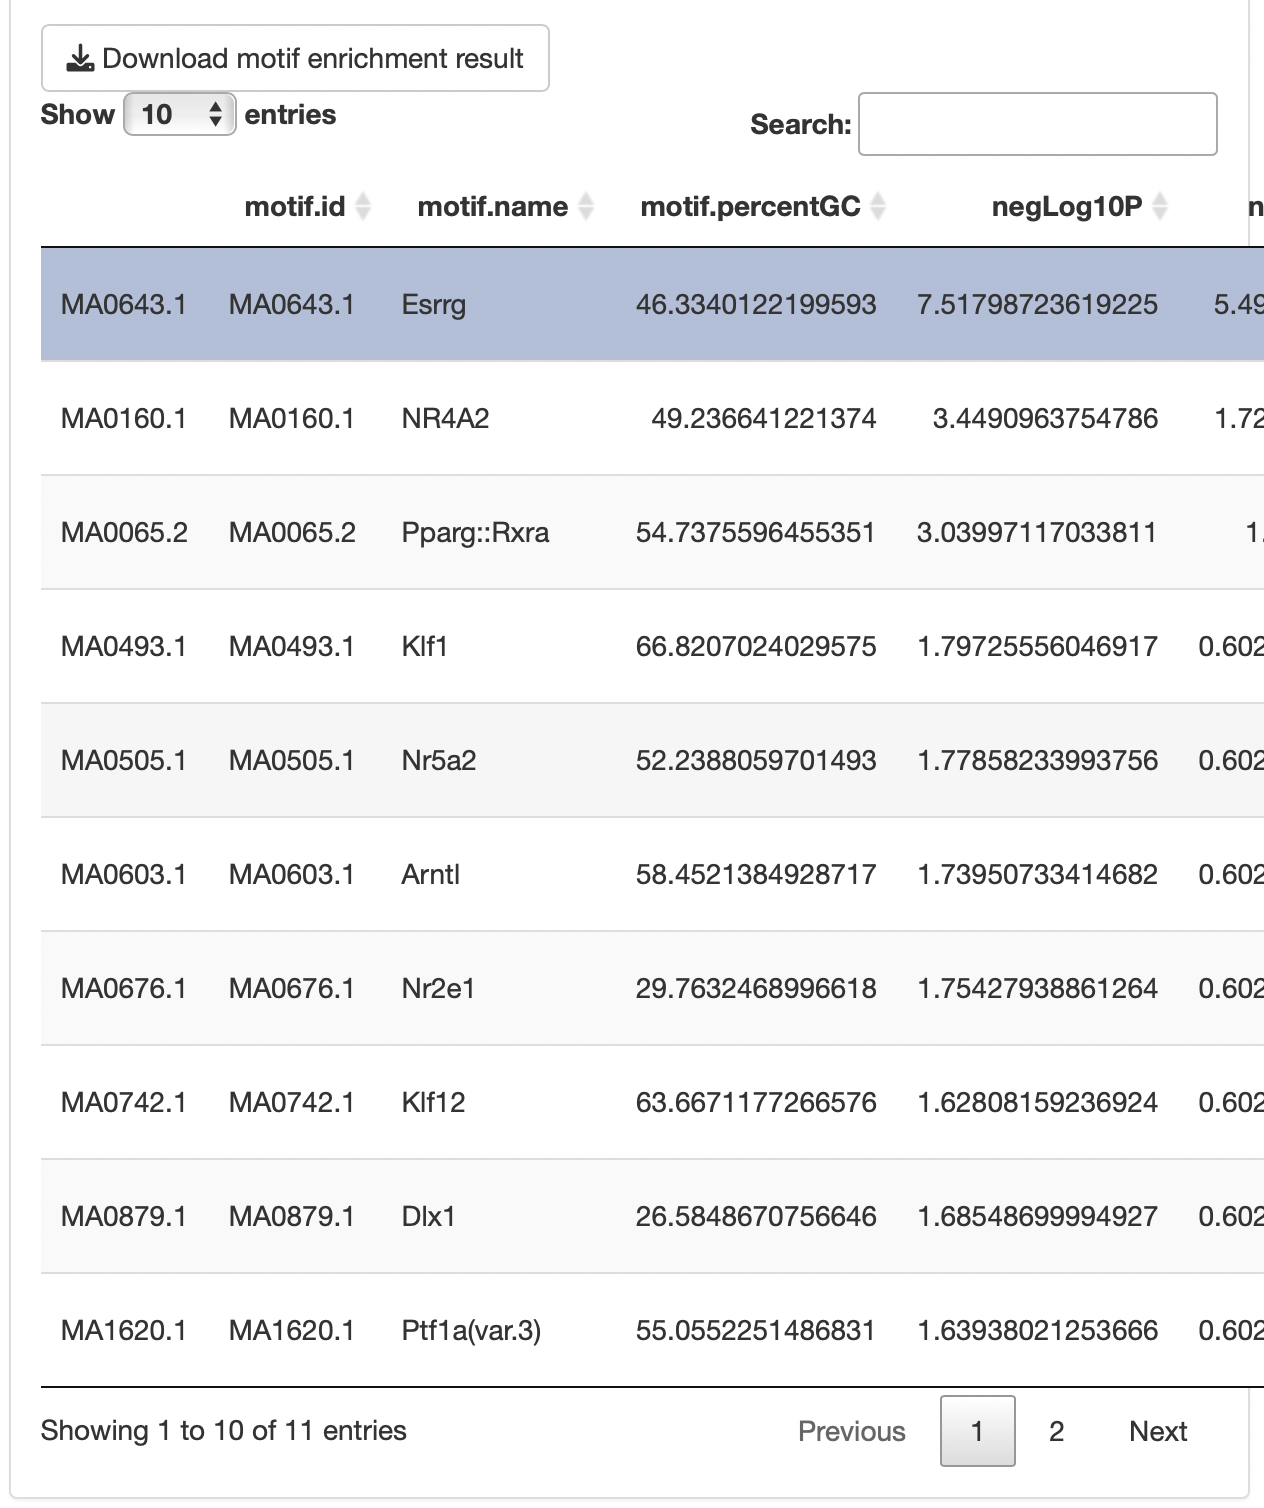
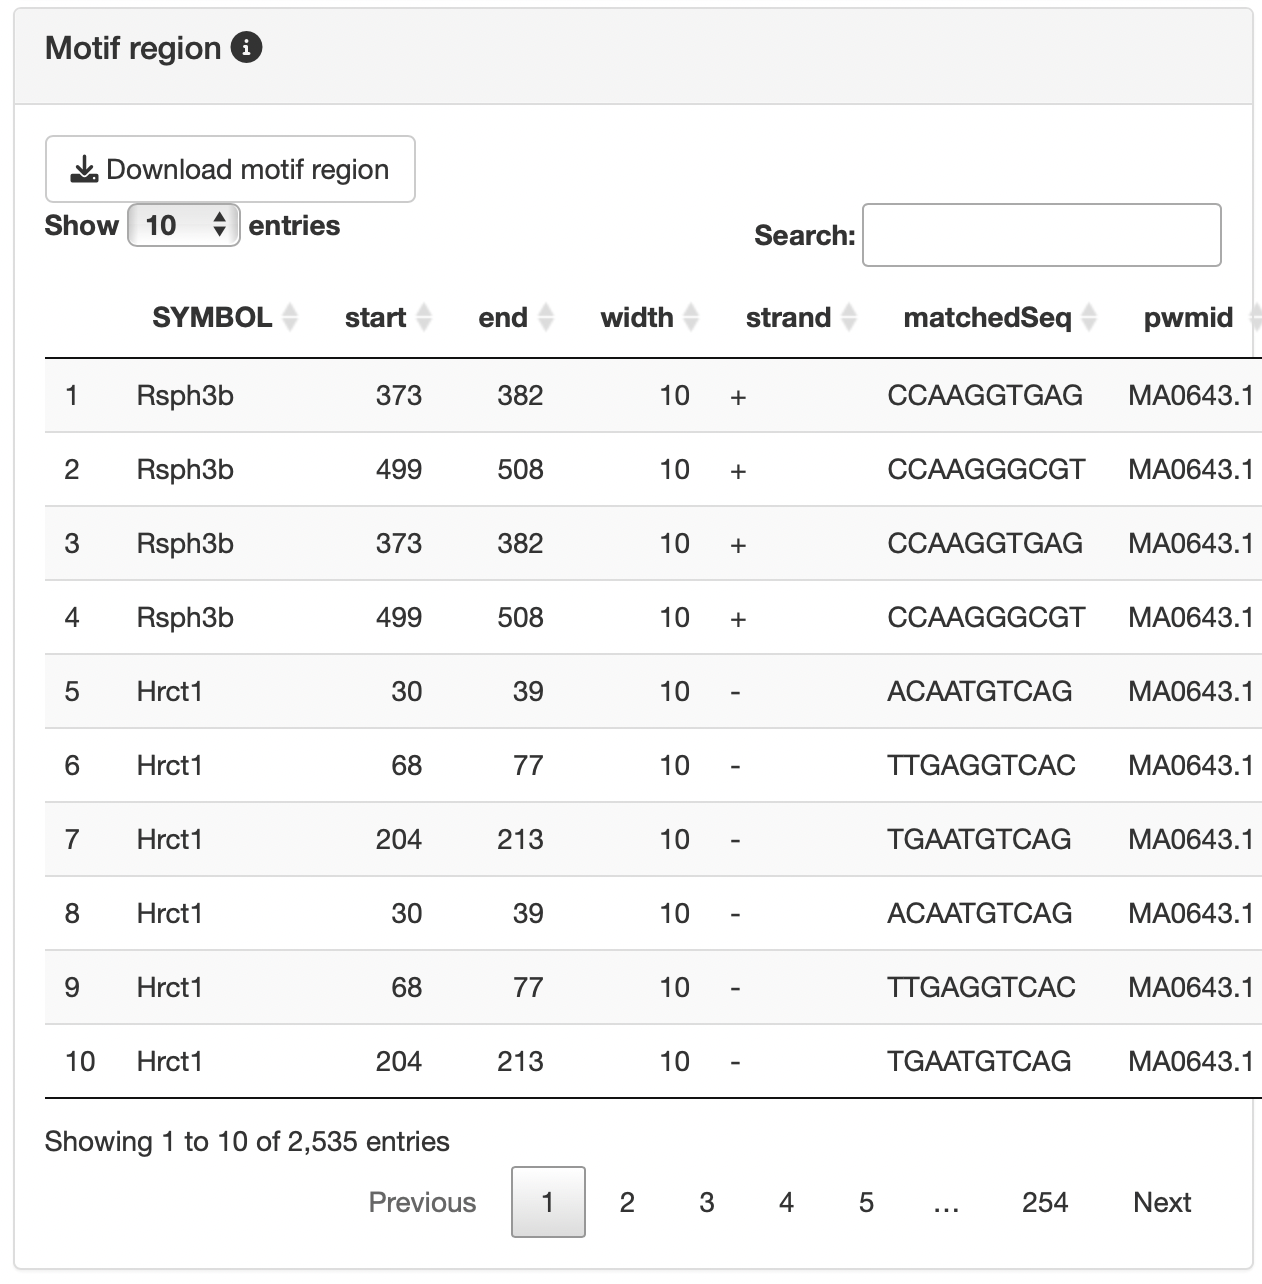
By selecting a motif of interest from the "Motif table", you can display the region where Motif exists (limited to the specified TSS region of the enriched gene group) in the "Motif region".
This analysis depends on monaLisa.