Introduction to K mer spectra analysis - KamilSJaron/k-mer-approaches-for-biodiversity-genomics GitHub Wiki
Most of the genomes sequenced are Pandora boxes - completely unsubscribed. While cytological techniques and flow-cytometry are the best way to generate some general insights about the genome and its structure, they are hard to scale, and unfortunately require a very different expertise.
K-mer spectra analysis is an alternative way to infer basic genomic properties directly from sequencing data. It provides us with an elegant way to estimate heterozygosity, genome size and repetitive fractions prior to genome assembly. Furthermore, k-mer spectra analysis can be also used as a reliable QC of sequencing libraries.
- Video on YouTube: Introduction to K mer spectra analysis
What is a k-mer spectrum
A k-mer spectrum or k-mer histogram is a histogram of coverages of all the k-mers in a sequencing dataset. A typical k-mer spectrum of a moderately heterozygous diploid organism features four apparent coverage peaks (see the picture below): The first peak represents sequencing errors (those with low coverage; in pink on the figure); the second peak represents unique genomic sequences from heterozygous loci (in yellow). This peak will be centred around 1n (monoploid) k-mer coverage; The third peak represents all homozygous loci in the genome centred around 2n coverage (in blue); and the fourth, usually a much smaller, peak represents genomic duplications centred around 4n coverage (in orange).
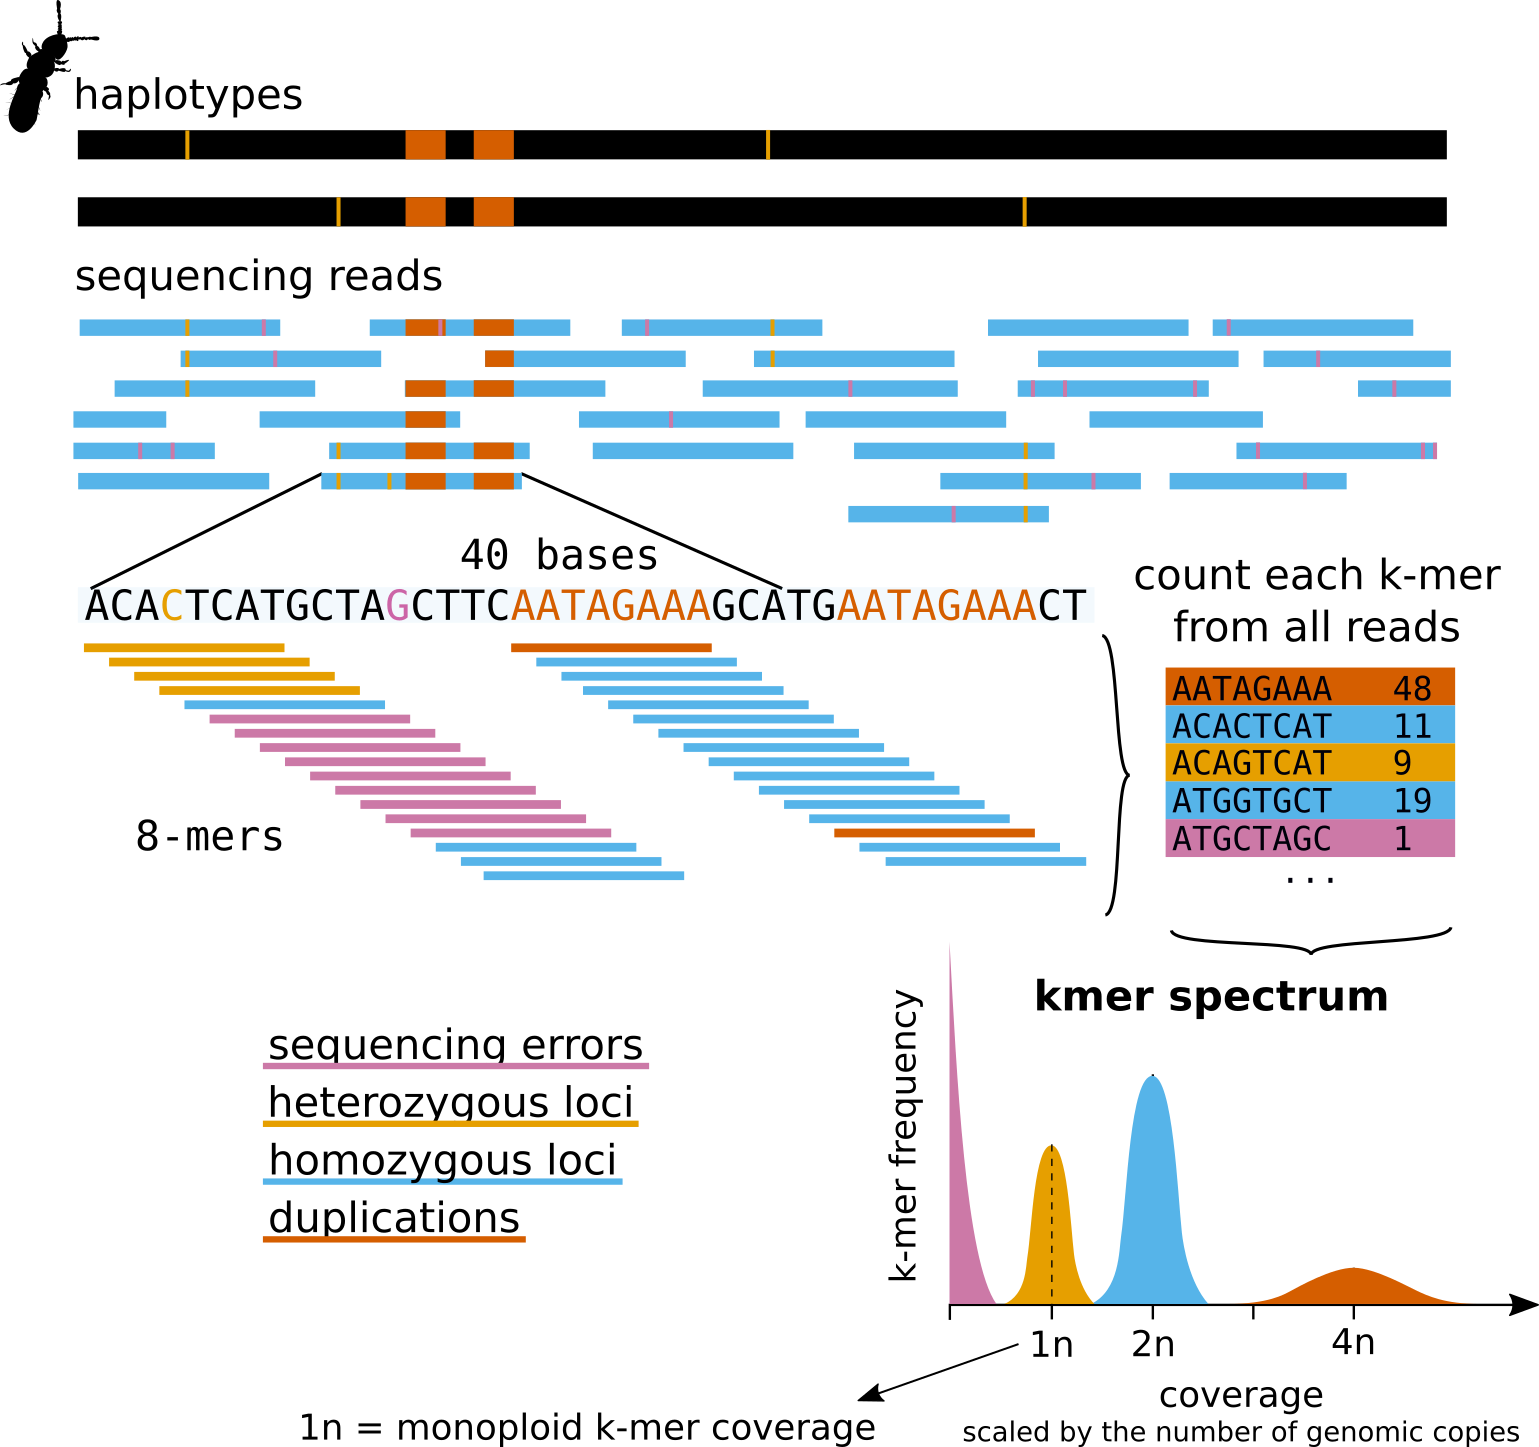
Even just a visual inspection of k-mer spectra is valuable in understanding a sequencing library. A high quality sequencing dataset features well separated peaks and their position indicates sequencing coverage. We can also develop intuition about the variation of sequencing depth and our capacity to discriminate between sequences that are homozygous and heterozygous in the genome. Furthermore, visual inspection can reveal issues of the sequencing run.
What's next
Now that you have got a basic understanding of what a k-mer spectrum is, let's work on real data, generate and understand one from a sequencing dataset.
👆 Go back to Table of Content
👉 ⚒ Try making and analyzing a real k-mer spectra in Generating k-mer spectra tutorial.
👉 📖 Read about modeling with k-mer spectra here Basics of genome modeling