45. Polynomials - JulTob/Mathematics GitHub Wiki
A polynomial function is defined as a linear combination of the powers of the variable (usually
-
$a_i$ are the coefficients - Each
$a_ix^i$ are the terms
A quadratic function is a polynomial function of 2nd degree.
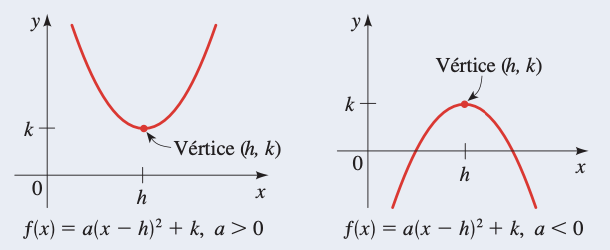
The normal form of a quadratic function is of the form

We see there's a maximum/minimum point at
- If
$a>0$ , then the minimum of$f$ is$f(h)=k$ - If
$a<0$ , then the maximum of$f$ is$f(h)=k$
The apex point (maximum or minimum of a parabola) can be calculated from the standard form
- If
$a>0$ , then it is a minimum of$f$ . - If
$a<0$ , then it is a maximum of$f$ .
A zero
- They are solutions to
$𝐏[x]=0$
- Ceros. Factorizar la polinomial para hallar todos sus ceros reales; éstos son los puntos de intersección x de la gráfica.
- Puntos de prueba. Hacer una tabla de valores para la polinomial. Incluir puntos de prueba para determinar si la gráfica de la polinomial se encuentra arriba o abajo del eje x sobre los intervalos determinados por los ceros. Incluir el punto de intersección y en la tabla.
- Comportamiento final. Determinar el comportamiento final de la polinomial.
- Graficar. Localizar los puntos de intersección y otros puntos que se encuen- tren en la tabla. Trazar una curva sin irregularidades que pase por estos puntos y exhibir el comportamiento final requerido
xychart-beta
    title "x to the power of 3"
    x-axis "x" -10 --> 10
    x-axis [-10, -9, -8, -7, -6, -5, -4, -3, -2, -1, 0, 1, 2, 3, 4, 5, 6, 7, 8, 9, 10]
    y-axis "y" -1000 --> 1000
    line [-1000, -729, -512, -343, -216, -125, -64, -27, -8, -1, 0, 1, 8, 27, 64, 125, 216, 343, 512, 729, 1000]
🐍 Python Code:
  def generate_xychart(start, end, power):
    """
    Generates a custom XY chart format for x raised to a specified power.

    Args:
        start (int): Start of the range (inclusive).
        end (int): End of the range (inclusive).
        power (int): The power to which x is raised.

    Returns:
        str: The XY chart representation as a string.
    """
    # Generate x values
    x_values = list(range(start, end + 1))
    # Generate corresponding y values
    y_values = [x ** power for x in x_values]

    # Format the chart output
    chart_output = (
        f"xychart-beta\n"
        f"    title \"x to the power of {power}\"\n"
        f"    x-axis \"x\" {min(x_values)} --> {max(x_values)}\n"
        f"    x-axis {x_values}\n"
        f"    y-axis \"y\" {min(y_values)} --> {max(y_values)}\n"
        f"    line {y_values}"
    )

    return chart_output

  # Example usage
  start_range = -10
  end_range = 10
  power_value = 3
  chart = generate_xychart(start_range, end_range, power_value)
print(chart)We can transform a polynomial into a multiplication of simpler polynomials.
These terms 𝚛ₙ are called the
We observe that for a 2nd order polynomial
The roots of the square shape are of the form
Therefore
We can easily identify possible basic roots by the factors of the constant
-
$P(x)$ : Dividendo -
$D(x)$ : Divisor -
$Q(x)$ : Cociente -
$R(x)$ : Residuo
If
if the polynomial
where
and
- Make a list of candidates Use the Thm of Rational Zeros
- Divide or Check With the Thm of the Factor
For every Polynomial function
with
There are, then, n solutions
If
$z$ is a solution, the complex conjugate of$z$ is also a solution

