1. Navigating the VVDViewer User Interface - JaneliaSciComp/VVDViewer GitHub Wiki
This page describes all the windows, tools, menus, and settings available in VVDViewer, organized by their location in the user interface.
Overview of the VVDViewer User Interface
Primary Interface
When you open VVDViewer, the following window appears:

Elements of this window include:
- The Main Menu Bar. Commands in this menu let you open files, select analysis tools, and change what panels are open.
- The Main Toolbar. This contains buttons for opening files, projects, meshes, the analysis window, etc.
- The Workspace Panel. This lists all data channels currently loaded into VVDViewer. Right-clicking on a channel in the Workspace panel reveals a pop-up menu with several additional visualization tools. The tools in the Workspace toolbar are used to segment(select) 3D objects, such as individual cells, in the rendered image.
- The Output Adjustment panel. The sliders in this window are used to adjust brightness and contrast for each channel.
- The Render View panel. This displays the rendered 3D image. You can manipulate volumes in the display using mouse buttons and gestures, or you can use sliders, buttons, and other controls to zoom, rotate, or reposition the image, choose how channels are combined, add a legend, save the image as a .tif file, and more.
- The Clipping Planes panel. Using the settings in this panel, you can limit the display to selected portions of the rendered volume. This can be used, for example, to view individual slices of a stack.
- The Properties panel. These settings allow you to modify the appearance of the channel selected in the Workspace panel. For volume channels, you can change the color of the channel, [adjust 3D brightness and contrast], add a scale bar to the image, etc. Different property adjustments are available for channels containing mesh data and for results of EVE analysis.
- The Record/Export Panel. This panel is for making movies.
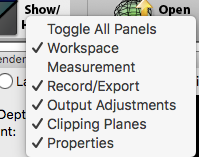
Note: You can open and close panels using the drop-down list that appears when you press the Show/Hide UI panels button on the Main Tool Bar or by selecting the panels from the Windows menu.
Main Menu Bar
The Main Menu Bar has three drop-down menus that are specific to VVDViewer: The File menu, the Tools menu, and the Windows menu.
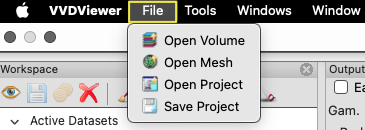
File Menu
From the File menu, you can open volume, mesh, or project files and save the current project, along with all the settings that have been adjusted.
Tools Menu
From the Tools menu, you can open windows for analyzing your data and adjusting settings.

-
Analysis Tools... opens the Analyze window, which has tabs for Segmentation (Paint Brush tab), Calculations, and additional Analysis, for counting components and particles.
-
Measurement Tools... opens the Measurement window, which displays the results of particle analysis and Component Analysis. It also includes a toolbar for measuring surfaces and volumes in the Render View window.
-
Noise Reduction... opens the Noise Reduction window, which is similar to the Noise Removal portion of the Analysis tab of the Analyze window.
-
Counting and Volume... opens the Counting and Volume window, which is the same as the Component Analyzer section of the Analysis tab of the Analyze window.
-
Colocalization Analysis... opens the Colocalization Analysis window, which functions similarly to the Colocalize function in the Calculations tab of the Analyze window
-
Convert... opens the Convert window for converting volumes to surface meshes.
-
Settings opens the Settings window, which has tabs for Project, Rendering, Performance, and File Format.
Windows Menu
The Windows menu lets you show or hide panels of the GUI or open a new VVDViewer session.

Main Toolbar

From the Main Toolbar you can:
-
Open Volume data, e.g., image stacks
-
Open Project previously saved in VVDViewer (.vrp files)
-
Save Project with the current rendering settings
-
Create New View of data by opening a new rendering window, allowing side-by-side comparisons
-
Show/Hide UI panels, which allows you to close unused panels. The Render View window may become larger if unused panels are closed.
The panels checked below are shown in the image at the top of this screen:
-
Open Mesh file (.obj, .swc, .ply)
-
Open Analyze window for doing 3D segmentation, calculations, and other analysis
-
Choose PlugIns such as Neuron Annotator, NBLAST, and Fiji in VVDViewer. Please contact Hideo ([email protected]) for support.
-
Open Settings window.
Workspace Panel
The Workspace Panel lists all the channels currently loaded into VVDViewer. Channels are organized into groups. You can reorder channels by dragging and dropping the channels. You can create a new group by dragging a channel to the bottom of the list.
Double-clicking a channel or group name hides (indicated by black lightbulb) or shows (indicated by white or colored lightbulb) the channel in the Render View panel. In the example below, only the red and blue channels of Group 1 are displayed in the Render View panel.

Workspace Panel Pop-Up Menus
Right-click on any group or channel to reveal a pop-up menu:
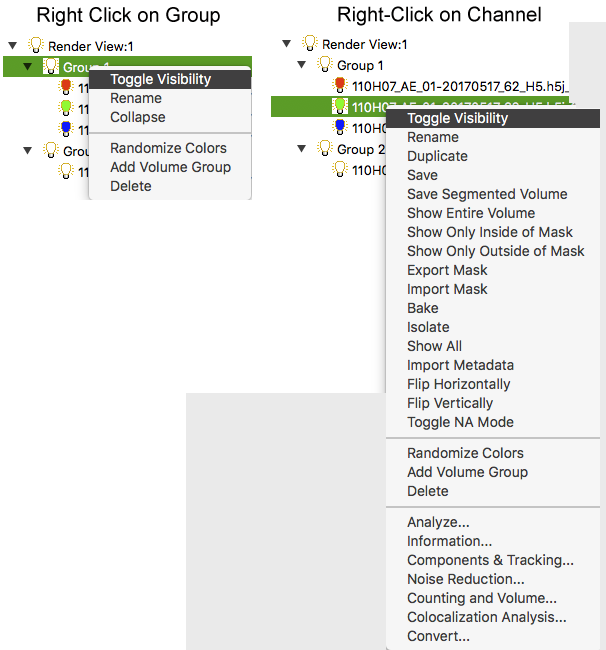
For a group, you can:
-
Toggle the Visibility of the group in the Render View window (same as double-clicking the name of the group)
-
Rename the group
-
Collapse or Expand the group to hide or reveal individual channels in the Workspace panel
-
Randomize the Colors used for channels displayed in the Render View window
-
Add Volume Group, that is, create a new group in the Workspace panel
-
Delete the group from this project
For a channel you can:
-
Toggle the Visibility of the channel in the Render View window (same as double-clicking the name of the channel)
-
Rename the channel
-
Duplicate the channel in the Workspace panel
-
Save the channel volume
After selecting a 3D object with the paintbrushes in the toolbar or the Analyze window, you can use the pop-up menu to:
-
Save 3D Painted Region as a .tif stack or .nrrd file
-
Show Entire Volume, Show Only Inside of Mask, or Show Only Outside of Mask
-
Export Mask as a 8-bit 3D image file (.nrrd).
-
Import Mask, that is import an 8-bit .nrrd file as a binary mask
-
Bake, that is, save the modified volume based on 3D visualization parameters in Properties panel
-
Isolate the selected volume from the current group
-
Show All items in the view
-
Flip Horizontally, that is flip the selected volume along x axis
-
Flip Vertically, that is flip the selected volume along y axis
In addition you can:
-
Randomize the Colors used for each channel in the Render View window
-
Add Volume Group, that is create a new group in the Workspace panel
-
Delete the channel from this project
-
and open Analyze, Information, Noise Reduction, Counting and Volume, Colocalization Analysis, and Convert windows.
Workspace Toolbar Tools
The toolbar at the top of the Workspace panel partially duplicates tools found in the Paint Brush tab of the Analyze window. This allows quick selection (segmentation) of objects of interest in the 3D image.

Click an icon to do the following (from left to right):
-
eye: View or hide the selected object
-
disk: Save original volume data
-
biscuits: "Bake" (save) modified volume based on 3D visualization parameters in Properties panel
-
X: Remove selected data from Workspace
-
Paintbrush+: Lets you select 3D object across the entire Z plane, within limits set in Clipping Planes panel. Brush properties and selection settings can be adjusted in the Analyze window.
-
Paintbrush(dot): Lets you expand the selection to include connected regions
-
Paintbrush–: Lets you unselect the selected objects
-
Broom: Resets all selections
-
Eraser: Deletes the selected object from the channel
-
Saw: Moves the selected object to a new channel
Output Adjustment Panel
The sliders in this panel are used to adjust brightness and contrast for each channel.
-
Easy Mode lets you adjust brightness and contrast at once
-
Link checkbox indicates that the parameters are set to the same value for multiple colors (RGB). When a channel uses a color that is a blend of red, blue, and green (e.g., purple), the Link checkbox is automatically checked.
-
Gamma(Gam): uses a Gamma curve to adjust color intensity (brightness). This allows you to increase the visibility of dimmer signals without oversaturating brighter signals.
-
Luminosity (Lum): uses a multiplier to adjust color intensity, thus increasing the brightness of all signals.
-
Equalization (Eql): also makes dimmer signals brighter, but it is less useful than Gam/Lum in most cases. It is most useful for equalizing brightness across time points in 4D data sets.
Render View Panel
Mouse Based Manipulations
- Zoom the image by placing the cursor over the image and either turning the mouse scroll wheel or holding down the right mouse button while dragging with the cursor
- Rotate the image by placing the cursor over the image and holding down the left mouse button while dragging the cursor
- Reposition the image by placing the cursor over the image and holding down the Command key and the left mouse button while dragging the cursor
- Reveal a pop-up menu to show and hide channels by clicking the right mouse button:

- Show all shows all channels in the group
- Show only selected shows hides all channels except the one selected in the Workspace panel
- Hide selected hides the channel selected in the Workspace panel
- Undo visibility undoes the last action, whether hiding or showing channels
- Redo visibility reapplies the previous change, whether hiding or showing channels
Controls in the Render View Panel
Controls at the top of the Render View Panel

The commands in the bar at the top of the Render View window allow you to:
-
Choose how channels are combined in rendered image (Layered, Depth, or Composite)
-
Capture the current Render View image as a .tif file
-
Change the Background color
-
Mark the Center of rotation of the image. Uncheck the box if you don't want the marker to appear on a captured image or movie.
-
Add Info regarding FPS, time, etc. to rendered image.
-
Add a Legend to the rendered image
-
Turn interpolation (Intrp) on/off. With the box checked, trilinear interpolation is used to smooth the image; with it unchecked, you actual voxel values are used.
-
Change the 3D graphical projection mode (V. AOV. slider). With the slider all the way to the left ("Ortho" for orthographic), everything is the same size, regardless of depth. This is best for creating figures with a scale bar. Sliding the slider to 30 or 45 degrees creates a cabinet projection in which closer objects are larger than farther away objects. This is good for visualizing object depth in movies.
-
Toggle FreeFly mode on and off. When the checkbox is checked, the image appears as if the camera is inside your sample.
Zoom controls
The Zoom controls on the right side of the Render View panel let you zoom an image by dragging the slider or typing a zoom amount in the box below the slider
You can set the current zoom level as the default by clicking Save as Default under the Zoom slider. You can then return to that zoom level by clicking the Reset button.
Rotation Controls
The Rotation controls at the bottom of the Render View panel let you rotate the image by dragging or clicking a position on the X, Y, and Z sliders or by typing numbers into the X, Y, and Z boxes.

To rotate the image in 45-degree increments, select the 45 increments checkbox to the right of the rotation sliders.
To return to the original position, click Reset to 0 to the left of the rotation sliders.
Depth Attenuation
The Depth Int slider on the left side of the Render View panel lets you make deeper signals darker. The checkbox above the slider turns depth attenuation on and off and the Reset button at the bottom resets to default value.
Clipping Planes Panel
Clipping planes allow you to view a subsection of your rendered volume. For example, it lets you see individual slices of a z-stack or reveal occluded structures in thick stacks. For each volume channel, a group of six clipping planes can be adjusted independently.
The following controls are present in the Clipping Planes panel, from top to bottom:
-
Sync All Chan.: When this box is checked, the same clipping planes are applied to all channels in the group.
-
The Display Mode drop-down list allows you to change how the clipping planes appear on the rendered volume in the Render View window.
- Normal: Color-coded planes with high opacity.
- Frame: Only the frame of the planes are shown. This setting is best when you are using clipping planes to scroll - through your stack one slice at a time.
- LowTrans: Planes are shown with low opacity, not color-coded.
- LowTransBack: Only the back planes are shown with low opacity.
- NormalBack: Only the back planes are shown, color-coded as in normal mode.
-
The X, Y, and Z sliders and the boxes above and below the sliders set the positions of clipping planes (+X, -X, +Y, -Y, +Z, and -Z). For X and Y, the numbers are in voxels; for Z, the numbers refer to slice numbers.
-
Link: When this box is checked, moving the sliders moves the two opposite clipping planes (e.g., +Z and –Z) at the same time. This makes it easy to scan through the volume, e.g., to go through the stack one slice at a time.
-
The Reset Clips button removes all clipping planes
-
XZ, YZ, and XY buttons and the number boxes below them let you set the distance between opposite clipping planes. Type a number into the number box, then click the XZ, YZ, or XY button above that box to set the clipping planes.
Clipping Plane Rotation Options
-
Fix: When this box is checked, the clipping planes remain in the same place in the Render View panel as you rotate or translate the rendered volume, so you see different cross sections.
-
Display Planes: When this box is checked, the clipping planes are always visible in the Render View window. If it is unchecked, the clipping planes of the selected volume channel are only visible when the mouse cursor is hovered over the Clipping Planes panel.
-
The Align to View button rotates the clipping plane to match the rotation of the volume in the Render View panel.
-
The Sliders and number boxes let you rotate clipping planes without rotating the rendered volume.
Properties Panel
Parameters on Left Side of Properties panel:

-
Gamma: Brightens dimmer signals without saturating already bright signals
-
Saturation Point: Sets all intensity values greater than the set value the highest intensity.
-
Luminance: adjusts the brightness of all signals
-
Alpha: adjusts transparency. This is useful for reducing background fluorescence. It needs to be unchecked during 2D slice rendering.
-
Shading: enhances 3D appearance by adding a shading effect
-
Color allows you to change the color of the channel. There are three ways to do this:
- Enter values (0-255) for R, G, B (e.g., "255, 0, 0" for red)
- Select all three numbers and replace with "w" for white, "p" for purple, "r" for red, "g" for green, or "b" for blue
- Double-click on the color bar to open the color picker window
-
The numbers in the X, Y, and Z text boxes indicate the voxel size in microns. These numbers are used to determine the scale bar length.
-
Checking SclBar adds a scale bar to the image in the Render View window. The desired length and units are indicated in the text box and drop-down list to the right.
-
Checking Text adds a label indicating the length of the scale bar to the image.
Parameters on Right Side of Properties panel:

- Extract Boundary: This function is good for adjusting the brightness of background tissue so it doesn't obscure internal signals (e.g., labeled cells).
-
Threshold: Left slider clips signals below the set value, e.g. to hide background fluorescence. Right slider clips signals above the set value.
-
Shadow / Light: When the box is checked, this slider enhances the 3D effect. The direction of shadow can be changed in the Rendering Tab of the Settings window
- Sample Rate: Too high will lead to slower rendering speed, too low generates moire pattern. 0.27 is usually a good balance.
-
Colormap: When the box is checked signal intensity is indicated with color heat map. Sliders allow you to adjust the color range.
-
The "Digit" drop-down list specifies the number of decimal points in the scale bar length.
-
When "Fix Length" is checked, the length of the scale bar in the Render View window will remain the same as you zoom in and out, so the number of units it represents will change. With the box unchecked, the number of units represented will remain the same as you zoom, so the length of the bar on the screen will change.
-
Mask: If you have selected an object with the paintbrush tool. you can hide the unselected portion of the image by checking "Hide Outside" checkbox or hide the selected portion by checking the "Hide Inside" checkbox.
-
Group: Check boxes to synchronize parameters across all channels in a Group defined in the Workspace Panel.
- "Sync" synchronizes parameters in the Properties panel;
- "Sync Spacings" synchronizes voxel size;
- "Depth" shows Depth mode rendering within a group. This function is good to combine with Layered mode rendering. Set background channel as lower layer, then multichannel signals are upper layer in different group with this Depth rendering.
Checkboxes on the far right of the Properties Panel:
-
:Inv: Inverts rendering of signal intensity
-
:Index: Shows a multicolor image that is based on different signal intensity
-
MIP: Shows maximum intensity projection
-
Smoothing: Applies a saddle smoothing filter. This filter is good for deleting voxel lattice patterns from the 0 degree rendering
Properties Panel for Mesh Files
When you select mesh data in the Workspace Panel, the Properties panel displays different controls.

-
Diffuse Color is the basic color of the object
-
Specular Color is the color of the specular highlight (the bright spot that appears on shiny objects when illuminated)
-
Shininess is the breadth of the angle of the specular highlight. The smaller the number, the broader the angle, and the rougher the object appears.
-
Transparency is the transparency of the mesh surface
-
Shadow adds a shadow effect to enhance the 3D appearance of a mesh
-
Lighting adds a lighting effect to enhance the 3D appearance of a mesh
-
Scaling scales the object
Properties Panel for EVE Analysis
After an EVE particle detection analysis is run, the results are displayed in a new channel in the Workspace panel and in the Render View window. When the channel is selected in the Workspace panel, the Properties panel shows parameters for adjusting the EVE analysis.
The left side of the Properties panels indicates the settings used for the analysis.
-
The Transparency slider adjusts the transparency adjustment of the counting spheres.
-
The Min Score slider adjusts the minimum score counting spheres must reach to be visible. The adjustments are made in real time.
-
The Number of Particles counted appears below these sliders. The number will change in real time as Min Score is adjusted.
-
Clicking Update will change the memo text in the left side of the panel.
Record Export Panel
The Record/Export panel enables you to animate certain aspects of a volume and export the movie as a .mov file to use in presentations, etc.
Basic Tab
- The Basic tab of the Record/Export panel is for making simple movies involving rotation of a volume, time-lapse movies (from a set of volumes organized as the same tissue over time), and progression through different volumes.

-
The Rotation checkbox lets you make a movie in which the volume in the Render View window is rotated around the axis specified by the radio buttons X, Y, or **Z **ax. The default is Y. The “Degrees” text box lets you specify the total number of degrees the volume will be rotated during the movie. The number of degrees of rotation from one frame to the next depends on what you type in the Movie Length and FPS (frames per second) boxes.
-
The Style drop-down menu is for selecting rotation-speed control mode:
- With Linear, the rotation speed is constant from the beginning to the end of the movie.
- With Smooth, the rotation accelerates and then decelerates through the movie.
-
The Time Sequence/Batch checkbox makes movies comprising a sequence of volumes stored in a single directory. For time-sequence movies, volumes in the directory must be named according to the time sequence convention, e.g., “image_T000.tif” through “image_T099.tif”. The number of frames equals up to the number of files in the directory in which your first loaded volume is located.
-
The Movie Length box specifies the length (in seconds) of the exported movie.
-
If the Rewind box is checked, the movie will play forward then backwards.
-
FPS (frames per second) determines how long each frame will be shown before advancing to the next frame. This, together with the Movie Length, will be used to determine how much the volume is rotated between frames for Rotation movies.
-
If the "repeat" box is checked, the movie will keep playing until you press the stop button
-
The green triangular play button at the bottom of the panel is used to create and play the movie.
-
The disk image with Save... is used to export your movie.
Advanced Tab
The Advanced tab of the Record/Export panel allows you to create movies in which VVDViewer interpolates images between a series of "key frames" that you define, so the rendered volume transitions smoothly from one key frame to the next.

The Key Frames table lists the key frames you have specified:
- ID is the number of the key frame. Key frames are numbered sequentially as you Add them.
- Frame indicates the frame of the movie at which the key frame is reached.
- Inbetweens indicates how many frames will be used to transition from the previous key frame to this one. The first Inbetweens in the list is always zero.
- The Interpolation method can be either “Linear”, which means between the keys, frames are exactly 1/#inbetweens steps from one key to the next, or “Smooth”, which means the frames slowly ramp up to the transition, and slowly ramp down to the end of the key frame in an “S-curve” fashion. This can be changed by clicking on the “Linear” or “Smooth”, which opens a drop-down menu.
- A Description can be added manually for each key frame to help you determine what the frame shows.
Commands below the table include:
-
Default sets the default values used for Inbetweens and Interpolation when new keys are added.
-
Add: Adds a new key frame to the list based on the volume orientation, cropping, etc., displayed in the Render View panel.
-
Delete removes the selected key frame.
-
Del. All removes all key frames in the list.
-
When Record volume properties is checked, interpolations between key frames will include slow transitions in channel properties changed in the Properties panel.
-
FPS (frames per second) determines how long each frame will be shown before advancing to the next frame.
-
The green triangular Play button, creates the movie, interpolating frames between the key frames during playback.
-
When repeat is checked, the movie will keep playing until you press the stop button.
-
The disk image with Save... is used to export your movie as a Quicktime .mov file or a series of .tif images.
Automatic Key Generation
The Auto Key tab allows you to quickly generate movies in which all individual, pairs, or triplets of channels are shown.
The Auto Key Type table lists the current options for Auto Key generation:
- Channel Combination nC1 sets a key for each isolated channel within a multi-channel data set. You can browse each channel individually with this setting.
- Channel Combination nC2 sets a key for each two-channel pair within a multi-channel data set. You can use this function to visualize colocalization regions between any two-channel combinations.
- Channel Combination nC3 sets a key for each triple-channel combination. You can use this setting to visualize all colocalization cases of three channels.
Clicking the Generate button adds the appropriate key frames to the Key Frames table in the Advanced tab. You can then make adjustments as for a regular Key Frame movie.
Cropping Tab
The Cropping tab lets you crop what is captured in the rendering frame to a smaller area.
-
When Enable cropping is selected, a yellow rectangle appears in the Render View panel indicating the pixels that will be used in the movie file. The yellow rectangle is set automatically, based on the area that is covered by data.
-
The Center: X: and **Y: ** specify where the center of the movie will be in pixel coordinates.
-
The Size: Width and Height boxes indicate the size of the cropping box.
-
The Reset can be used to recalculate the cropping region if you have rotated, zoomed, or panned the rendered volume or resized the program interface window.
Tools Menu Selections
Analyze Window
The Analyze window has tabs for Segmentation (Paint Brush tab), Calculations and additional Analysis
Paint Brush Tab
The Paint Brush tab is used for segmentation of the rendered volume, e.g., selecting single neurons.

Toolbar icons
The toolbar icons at the top of this tab includes the following tools:
-
Undo: Removes previous selection(s). The number of Undo steps can be specified in the Project tab of the Settings window.
-
Redo: Restores a previously removed selection.
-
Select: Lets you select 3D object across the entire Z plane, within limits set in Clipping Planes panel.
-
Diffuse: Lets you expand the selection to include connected regions. How far the selection extends on a large object (e.g., and axon) depends on the Growth setting in the Selection Settings below.
-
Unselect: Lets you remove voxels from the selected area
-
Reset all: Removes all selections
-
Eraser: Deletes the selected voxels from the channel
-
Extract: Moves the selected voxels to a new channel
**Note: **most of these tools are duplicated in the Workspace toolbar.
Selection Settings
-
The Threshold slider determines the minimum voxel intensity for selection.
-
When Apply to Group is selected, the brushes use the same threshold value to select voxels on all channels
-
When Absolute Value is checked, the Threshold intensity is based on the original gray value. If this check is OFF, it will use adjusted value from the 3D properties.
Brush Properties Area
-
Growth radio buttons determine how much distance will be selected by the diffusion brush.
-
Strong covers the most distance, but the calculation takes a long time. If the computer graphsics card is solw, the calculation will stop after a few seconds.
-
The Center Size slider determines the size of the selection brush on the Render View window.
Calculations Tab
The operations on this create a new channel in the Workspace panel based on comparisons between voxels in one or two other channels.

- Volume A: and Volume B: Indicate which channels in the Workspace panel will be used for calculations.
Single-valued Operators These operations are performed on Volume A
- 3D Fill Holes: Fills empty holes within Volume A using the Threshold value set in the Paint Brush tab.
Two-valued Operators These operations use both Volume A and Volume B)
- Subtract: Subtracts the gray value of Volume B from the value of Volume B.
- Max: Returns the gray value of Volume A or Volume B, whichever is larger.
- Divide: Divides gray value of volume A by gray value of volume B.
- Colocalize: Returns the gray value of Volume A or Volume B, whichever is smaller. If there is no colocalization of signals, the number will be equal to background fluorescence. Additional parameters for colocalization analysis can be set by instead selecting Tools > Colocalization... from the Main Menu.
Analysis Tab
Component Analyzer
The component analyzer automatically counts objects (e.g., cell bodies) in a volume. This part of the Analyze tab can also be accessed by selecting Tools > Counting and Volume... from the Main Menu.
-
The Threshold slider sets the boundary between signal and background fluorescence.
-
The Analyze button Runs the analysis.
-
Selct. Only: When this box is checked, only signals previously selected with the Paint Brush tool are included in the component analysis.
-
Min specifies the minimum size in voxels an object must be to be counted.
-
Max specifies the maximum size in voxels an object can be to be counted.
-
Ignore Max checkbox removes upper limits on object size when selected.
-
The Components box shows the number of found components after the analysis is run.
-
The Total Volume box gives the volume (µm3) of all components detected with component analysis.
The results of the analysis are Output to a new channel in the Workspace panel. There are three options for how to do this:
- Indivisual Channels creates a different channel for every component. Note, the software tends to crash if there are too many components (>30).
- Random RGB three channels (red, blue, and green) are created and components are randomly assigned to one of these channels.
- Annotations creates a channel containing numbers that appear center of detected components in the Render View window.
The results of the analysis (coordinates and volume of each component) are also shown in the Measurement window that opens when Tools > Measurement Tools... is selected from the Main Menu.
Noise Removal
This tool removes noise based on the threshold value set in the Paint Brush tab. A similar function can be found by selecting Tools > Noise Reduction from the Main Menu.
-
The Size thresh. slider defines maximum size in voxels an object can be to be considered noise.
-
The Analyze button runs the analysis to detect noise using the threshold value from the paintbrush. Detected objects will be highlighted.
-
The Remove button deletes the objects designated as noise.
EVE (Particle detection)
The EVE (Exclusive Volume Embedding) function detects 3D particles by fitting non-overlapping 3D spheres. Spheres are fitted from large to small. We recommend segmentating objects to be counted using the Paintbrush function to minimize calculation time.
-
The Min Radius slider sets the voxel radius of the smallest 3D sphere. The lower this value, the smaller the spot size that will be counted.
-
The Max Radius slider sets the voxel radius of the largest 3D sphere. The higher this value, the larger the spot size that will be counted, and the greater the calculation time required.
-
The Min Brightness slider sets the intensity threshold for spot detection. Signals dimmer than this value will be ignored.
-
The Analyze button runs the spot detection analysis.
After the analysis, VVDViewer will create a new channel in the Workspace panel and show the results in the Render View window. Adjustments to the results can be made in the Properties Panel when the new channel is selected in the Workspace panel.
Measurement Window
This window allows measurements of points and distance, and it displays the results of Component Analysis and particle analysis.

The toolbar at the top of the window has the following tools:
 Crosshairs tool: Lets you select a single point in the rendered volume. The location of the point depends partly on the Pointing Method. The point's X, Y, Z coordinates are entered into the measurement table.
 Line segment tool: Lets you draw a line segment on the rendered volume. The location of the line segment depends partly on the Pointing Method. The X, Y, Z coordinates of the beginning and end points and the distance between them (the length of the line segment) are entered into the measurement table.
 Contour tool: Let's you select a series of points to form a contour. The location of the contour depends partly on the Pointing Method. The X, Y, Z coordinates of the first and final points and the length of the contour are entered into the measurement table.
 Point adjustment tool: Lets you move a previously placed point.
 Delete selected: Deletes the item selected in the Measurement table.
 Delete all: Deletes all measurements from the table, except for the results of particle analysis
 Save: Saves the measurement data in a .txt file.
Pointing Method determines where in the volume a point is placed. There are two options, which can be selected from the drop-down menu:
Save: Saves the measurement data in a .txt file.
Pointing Method determines where in the volume a point is placed. There are two options, which can be selected from the drop-down menu:
-
When Maximum Intensity is selected, the point will be positioned on the brightest point along the line of sight.
-
When Accumulated Intensity is selected, the point will be positioned on the surface of the object.
-
When the Transient checkbox is checked, measurements are applied only to the current time point in a 4D dataset.
-
When the Use Volume Properties checkbox is checked, values adjusted by transfer functions (gamma, luminance, etc.) set in the Properties panel are reported. If the box is unchecked, original grayscale values are reported.
Noise Reduction Window
This window is similar to the Noise Removal portion of the Analysis tab of the Analyze window.

-
The Threshold slider sets the intensity threshold for a voxel to be classified as noise.
-
The Voxel Size slider defines maximum size, in voxels, a component can be to be classified as noise.
-
The Preview button runs a noise-detection analysis and highlights voxels considered noise.
-
The Erase button removes (sets intensity value to zero) the voxels designated as noise.
-
The Enhance selection: It enhances selected noise signals for easy reviewing before the deletion.
Counting and Volume Window
This window is identical to the Component Analyzer section of the Analysis tab of the Analyze window.

-
The Threshold slider sets the boundary between signal and background fluorescence.
-
The Analyze button runs the analysis.
-
Selct. Only: When this box is checked, only components previously selected with the Paint Brush tool are included in the component analysis.
-
Min specifies the minimum size in voxels an object must be to be counted.
-
Max specifies the maximum size in voxels an object can be to be counted.
-
Ignore Max checkbox removes upper limits on object size when selected.
-
The Components box shows the number of found components after the analysis is run.
-
The Total Volume box gives the volume (µm3) of all components detected with component analysis.
The results of the analysis are Output to a new channel in the Workspace panel. There are three options for how to do this:
- Multiple Channels creates a different channel for every component.Note, the software tends to crash if there are too many components (>30).
- Random RGB three channels (red, blue, and green) are created and components are randomly assigned to one of these channels.
- Annotations creates a channel containing numbers that appear next to detected components in the Render View window.
The results of the analysis (coordinates and volume of each component) are also shown in the Measurement window that opens when Tools > Measurement Tools... is selected from the Main Menu.
Colocalization Analysis Window
This window functions similarly to the Colocalize function in the Calculations tab of the Analyze window. It returns the gray value of Volume A or Volume B, whichever is smaller. If there is no colocalization of signals, the number will be equal to background fluorescence.

-
Volume A: and Volume B: indicate which channels in the Workspace panel will be used for calculations.
-
The Min Size and Max size sliders specify the size in voxels of objects to be considered in the analysis.
-
The Select Both checkbox
-
The Colocalization button runs the analysis.
Convert Window
The Convert window is used to convert volumes to polygon surface meshes.
-
The Threshold slider sets the lower intensity threshold for voxels to be included in the volume being converted.
-
The Downsmp XY slider specifies the degree of downsampling in X and Y dimensions. For example, if this value is set to 2, an XY area that is 2x2 pixels will be downsampled to 1 pixel.
-
The Downsmp Z slider specifies the degree of downsampling in the Z direction.
-
When Use transfer function is selected, the mesh will be created on the voxel values after the parameters set in the Properties panel have been applied.
-
When Selected Only is checked, only the voxels selected with the Paint Brush tool will be included in the mesh.
-
The Convert button runs the conversion.
-
The Output panel displays the surface area of the new mesh object after the conversion is run.
Settings Window
The Settings window is opened from the Main Toolbar. It has tabs for Project, Rendering, Performance, and File Format.
Project Tab

In the Open/Save area you can choose to
- Save the project (as .vrp file) when you capture an image or export a movie
- Compress data in graphics memory when loading. This will save GPU memory, bit it will slow data loading.
In the Render View Text area you can change the font, size, and color of text (e.g., scale bar and legend) that appears on the Render View window.
In the 4D Script area you can choose a script to run during playback of 4D data
The Painting History area lets you choose how many undo steps are possible during selection with **Paint Brush **tools.
Rendering Tab

-
Selecting Enable Micro Blending is required for proper blending of colors in Depth mode. It doesn't work on other rendering modes and it may decrease rendering speed.
-
The Depth Attenuation area lets you choose to enable Depth Attenuation on meshes.
-
The Mesh Transparency Quality slider determines how many layers are used for transparent meshes. The maximum is 10, but this should be used only for complex geometries because the higher the number, the slower the rendering.
-
The Directional Shadow checkbox and slider let you determine the direction of shadows added when the Shadow/Light checkbox is selected in the Properties Panel.
-
You can also choose to use a Gradient Background in the Render View window and to link Rotations of all rendering views.
Performance Tab
The Performance tab is used to make adjustments to improve performance based on your computer's capabilities

In the Variable Sample Rate section, you can choose to reduce the volume sample rate or volume resolution while you are performing interactions with the mouse (e.g., zoom or rotation), to increase the speed of mouse actions.
In the Large Data Streaming section, you can enable streaming for data sets that are much larger than available graphics memory. When the checkbox is checked, datasets larger than the size indicated in the settings below will be divided into small blocks, which are rendered in sequence. Mouse interactions will be faster, but rendering speed will not real time.
The following settings should be adjusted when streaming for large datasets is enabled:
- Graphics Memory should be set to 90% GPU memory
- Large Data Size indicates how large a dataset must be to turn streaming mode on
- Brick Size is the size of the blocks data will be divided into. Start with 512 voxels and adjust if nexessary.
- Response Time determines how quickly VVDViewer switches between rendering and GUI management. With smaller numbers, switching is more frequent, enabling smoother GUI action, but it takes longer to render all the data blocks in large datasets.
The Main Memory Buffer area has a slider that indicates how much system memory should be used as a buffer if volume data are larger than GPU memory.
File Format Tab
The File Format tab is used for setting the source for voxel size and for the color used for rendering fluorescent data.

In the Override Voxel Size area, when the box is checked, the voxel size used in the first loaded volume will overwrite the voxel size in subsequently loaded volumes.
The Default Colors for Excitation Wavelengths section lets you set colors used for different channels based on metadata in the confocal file.