ChIP AP Guide - mbassalbioinformatics/ChIP-AP GitHub Wiki
This documentation is available as a pdf (https://github.com/JSuryatenggara/ChIP-AP/blob/main/Guides/ChIP-AP%20Documentation.pdf).
ChIP-Seq is a technique used to analyze protein-DNA interactions and identify the binding sites of said protein. Briefly, protein is fixed/attached to the DNA, then, samples are fragmented and a pull-down is performed with an anti-body targeted to the protein of interest to extract the protein-DNA complexes where binding to DNA has occurred. The samples are then sequenced and analyzed. A key step in the bioinformatics analysis is the calling of “peaks,” or regions of enrichment, corresponding to binding sites of the protein to the DNA.
It has been widely reported that of all the bioinformatics analysis steps, the step most likely to affect study outcomes is peak calling (Chen et al., 2012; Johnson et al., 2007). Numerous reviews (Koohy et al., 2014; Laajala et al., 2009; Wilbanks and Facciotti, 2010) have therefore been published benchmarking available peak callers to ascertain superiority of one caller over others. Consistently however, these benchmarking papers will report mixed, potentially conflicting, findings with no single peak caller out-performing others. Rather, each peak-caller excels in specific types of datasets and one cannot know the overall best performance of a single peak-caller in advance. Using a sub-optimal peak caller will result in few peaks called, or worse, a large number of false-positive peaks which, short of validating every peak manually, will be indiscernible from true-positive peaks. Compounding issues further, benchmarking reviews have consistently shown little overlap between called peak sets of different peak callers. Therefore, we can conclude that each peak caller has distinct selectivity and specificity characteristics which are often not additive and seldom completely overlap in many scenarios. As such, results obtained from individual peak callers, even sub-optimal callers, will contain sub-sets of true and false-positive peaks that are exclusive to that caller.
This leads the user to the peak-caller dilemma, if there is no universal peak caller to use, which peak caller does one use for their dataset? We therefore rationalized that without a perfect peak caller (which is near impossible owing to the significant variability introduced from wet-lab experiments), the only option is to leverage the best performing, currently available peak callers and identify unique and/or overlapping peaks to better discern the confidence of peaks without manual validation, and identify overlapping, high-confidence peak sub-sets.
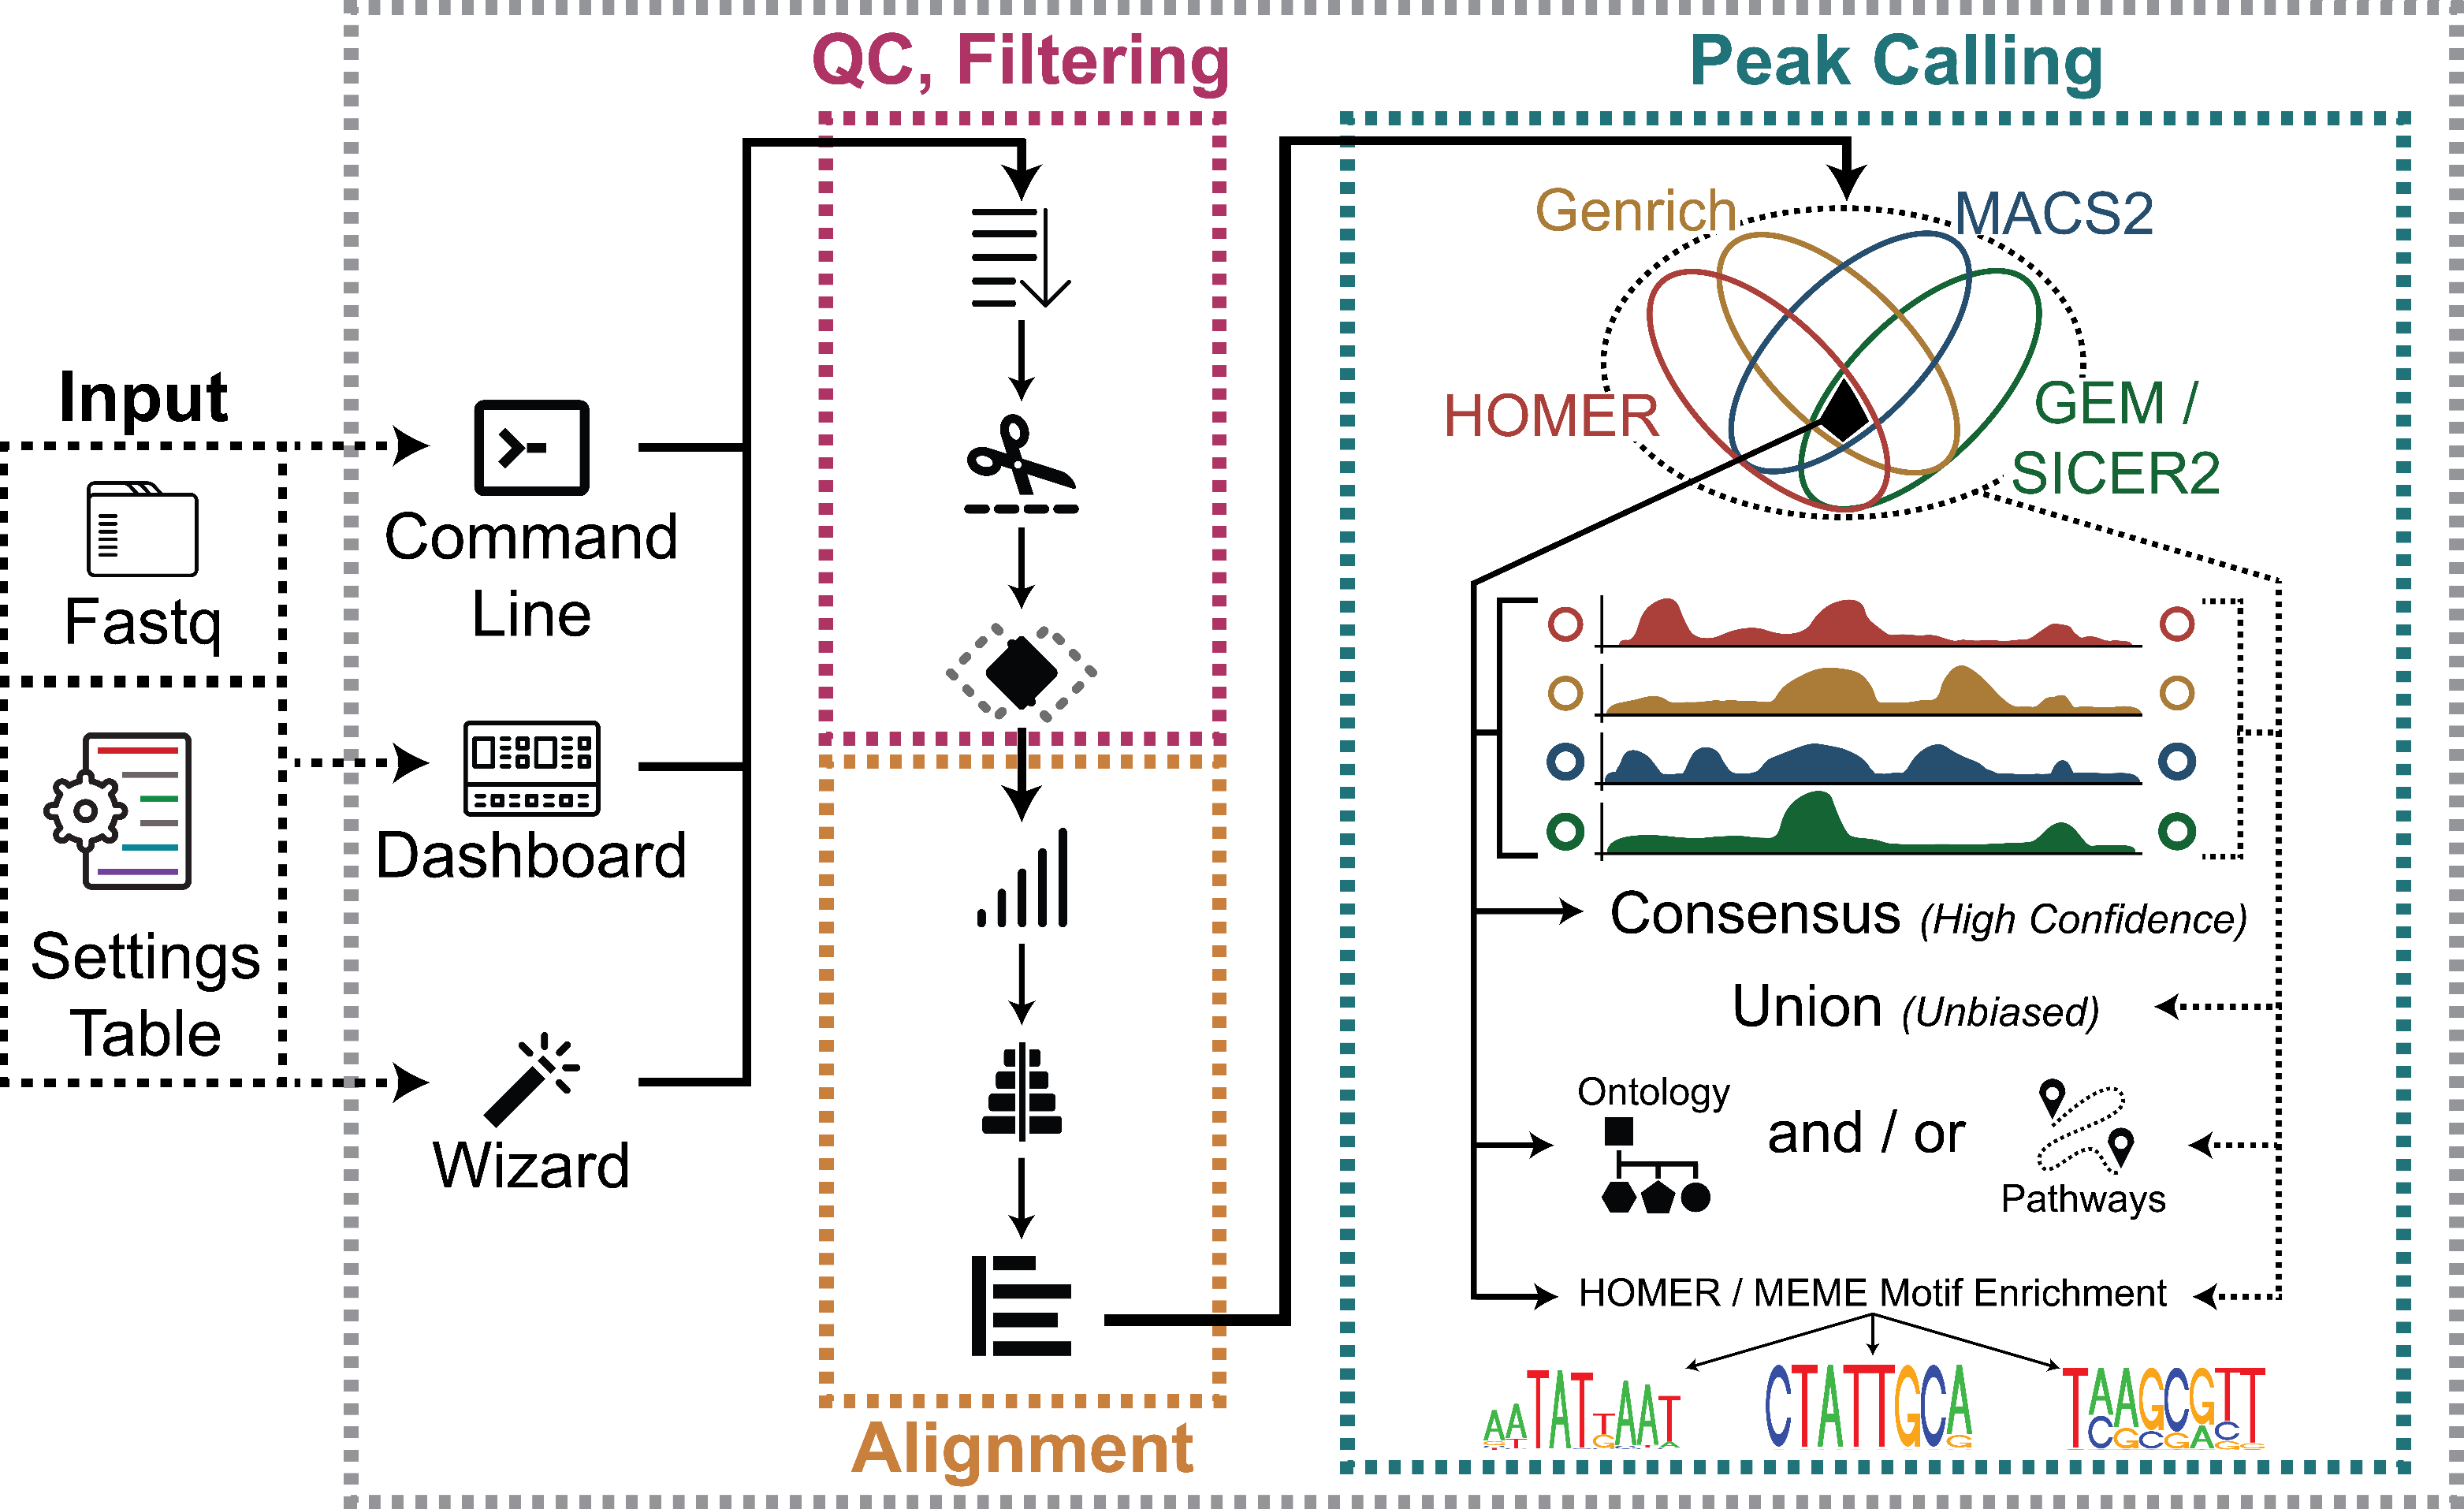
To that end, our ChIP-Seq Analysis Pipeline (ChIP-AP) utilizes multiple peak callers, which enables filtering in/out results from every peak caller used in this pipeline (MACS2, GEM/SICER2, HOMER, and Genrich) to:
-
Selectively obtain high confidence peaks based on overlaps by different peak callers
-
Avoid the caveats of depending on a single peak caller in datasets with different peak characteristics and signal-to-noise ratios
-
Freely choose the “sweet spot” between the consensus peaks set (intersection of detected peaks from all peak callers) and the total peaks set (the union of all detected peaks), that answers one’s biological questions which may be supported by additional evidence from other experiments. This can be done from the output without re-processing data.
ChIP-AP is a fully automated ChIP-seq data processing and analysis pipeline:
-
For input, it takes unaligned sequencing reads in fastq format (extension: .fastq / .fq / .fastq.gz / .fq.gz) or previously aligned reads in bam format (extension: .bam) from any aligner
-
ChIP-AP is capable of processing and analyze multiple sample replicates
-
ChIP-AP is a complete, integrated workflow which performs all analysis steps (QC, cleanup, alignment, peak-calling, pathway analysis) and outputs a final integrated peak set
-
The output of ChIP-AP is a detected peaks list, annotated with information on associated gene names, IDs, functions, gene ontology, and related pathways
OS – Linux (Ubuntu-variants 16.04+ tested), MacOS (10.13+), Windows 10 (v1903+)
CPU – (minimum) Quad-Core Intel/AMD CPU, (recommended) Octa-Core Intel/AMD CPU. Apple Silicon Macs are also compatible through Rosetta 2.
RAM – (minimum) 8Gb, (recommended) 16Gb+
Storage (SSD/HDD) – This varies widely depending on the samples being processed and the sequencing depth. Rough estimate, (minimum) 30Gb, (recommended) 100Gb+
Screen Resolution – A minimum resolution of 1920*1080 is required for the dashboard interface. If your screen resolution is less than this, you will be limited to only using the wizard
ChIP-AP is capable of handling multiple sample replicates in a single run. It is also capable of handling an un-balance number of sample replicates (ie 3 ChIP, 2 Controls). It does so by merging each corresponding sample type (so merge all ChIP samples together and merge all control samples together) following read alignment and these merged files are used for all down-stream processing.
For controls, input (not IgG) is recommended and is consensually considered best practice.
For peak calling, peaks are called as ChIP over control.
chipap  --mode single
        --chipR1 [chip fastq replicate1] [chip fastq replicate2] …
        --ctrlR1 [control fastq replicate1] [control fastq replicate2] …
        --genome [path to genome folder]
        --output [path to output save folder]
        --setname [dataset name]
chipap  --mode paired
        --chipR1 [chip fastq replicate1, first read] [chip fastq replicate2, first read] …
        --chipR2 [chip fastq replicate1, second read] [chip fastq replicate2, second read] …
        --ctrlR1 [control fastq replicate1, first read] [control fastq replicate2, first read] …
        --ctrlR2 [control fastq replicate1, second read] [control fastq replicate2, second read] …
        --genome [path to output save folder]
        --output [path to output save folder]
        --setname [dataset name]
chipap	--mode single / paired
        --chipR1 [chip bam replicate1] [chip bam replicate2] …
        --ctrlR1 [control bam replicate1] [control bam replicate2] …
        --genome [path to genome folder]
        --output [path to output save folder]
        --setname [dataset name]
ChIP-AP has been designed to be as simple as possible to run for end-users be they bioinformaticians or wet-lab biologists with no coding experience. For non-experienced users however, there is a little command-line dabbling required in order to get everything set up just right unfortunately. Thankfully, we have prepared full installation guides located on our github wiki page for your operating system (OS) of choice (up at the top you'll find a little "Wiki" tab). These are complete step-by-step guides with accompanying screenshots to walk users through every step of the installation processes. For fresh installations, we have not encountered issues when following our installation instructions accurately. If you have previous instalaltions of configurations, some tweaking may be necessary to get everything to work right – just be aware. Below are brief installation notes for reference only see detailed wiki pages for installation instructions for your system.
For users who do not wish to try to configure things on their own, we provide a preconfigured virtual machine image for download and use. Users can download a pre-configured virtual-machine image to run in VirtualBox (Oracle VM VirtualBox). A detailed tutorial can be found on our wiki (https://github.com/JSuryatenggara/ChIP-AP/wiki/Virtual-Machine-Installation-Guide). The pre-configured image can be downloaded from (https://www.dropbox.com/s/jx4pntljajsahbj/ChIP-AP_Ubuntu_LTS2004.vhd?dl=0).
We do recommend installing ChIP-AP locally on your machine though.
Before attempting to install ChIP-AP on your local machine, make sure your hardware is capable of running ChIP-AP. ChIP-AP will run on Linux (Ubuntu-variants tested), MacOS (excluding Apple Silicon (M1) macs) and Windows 10. For running, ensure your computer/laptop has at least a quad-core cpu and a minimum of 8Gb of RAM. Storage on your SSD/HDD will vary depending on the size of your sequencing files but at least 30Gb of free storage space is a good start.
-
Before setting up ChIP-AP, Anaconda 3 MUST be installed first. Simply search “Anaconda 3 individual install” in your search-engine of choice and download and install the correct setup for your operating system (OS). We’ll wait here till you’ve done this…
-
ChIP-AP can be downloaded from our GitHub repo. Direct download link: https://github.com/JSuryatenggara/ChIP-AP/releases
-
After downloading ChIP-AP, move the downloaded ChIP-AP package archive to a directory of your choosing and unzip the content there. This will be the installation directory for ChIP-AP
-
To install, run: chipap_installer.py from the command line inside the unpacked folder
ChIP-AP offers 2 graphical interfaces for running – depending on a users proficiency with ChIP-AP. They are the chipap_dashboard and the chipap_wizard.
We recommend new users to ChIP-AP first use the wizard. Proficient users of ChIP-AP should use the dashboard as it enables inputting the data more quickly.
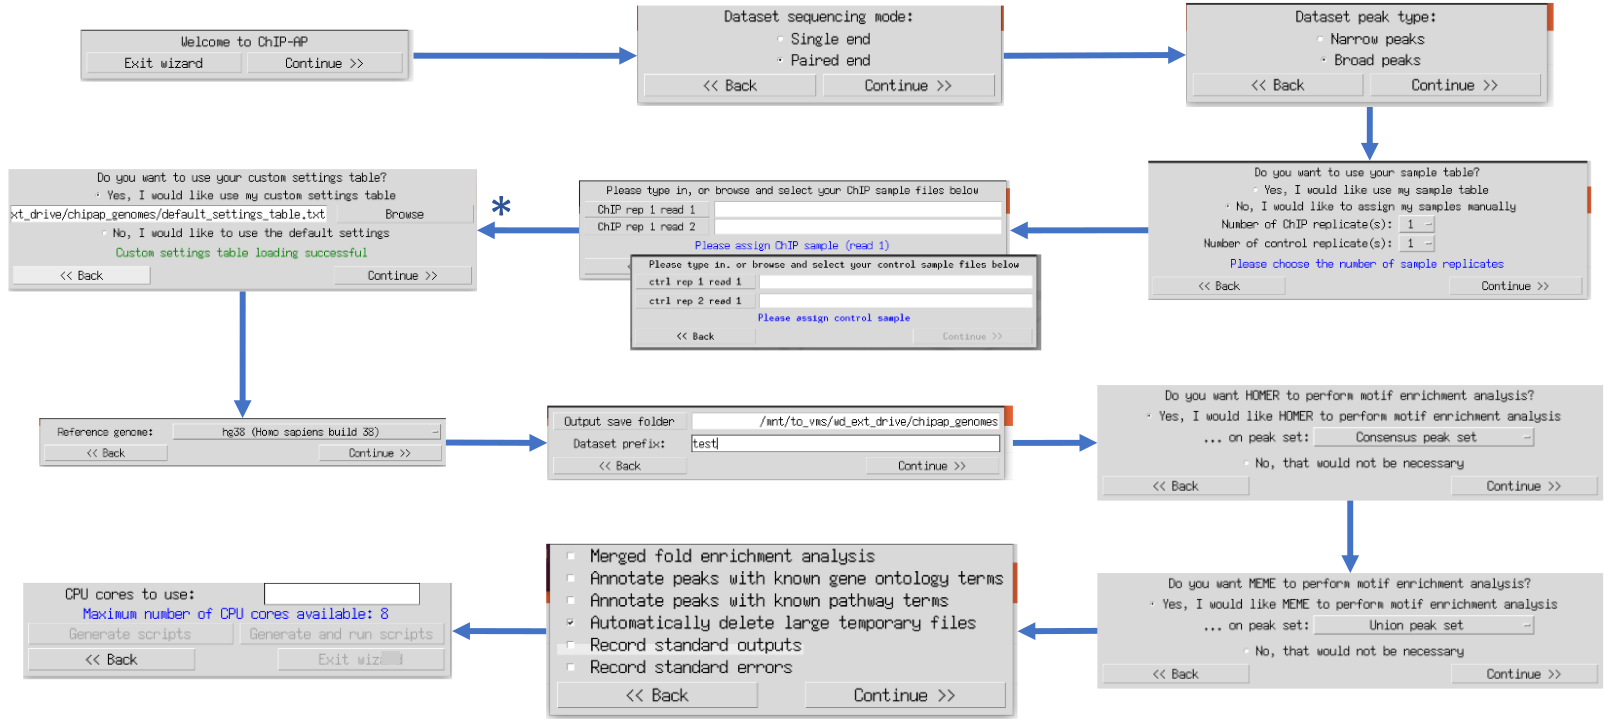
Once ChIP-AP is setup, at the command line type: chipap_wizard.py
to use the wizard graphical user interface (GUI). The multiple windows that appear ask users questions sequentially regarding information required for a run. This ensure data is provided in the correct order without overwhelming the user with all questions and options simultaneously. This option is therefore recommended for inexperienced ChIP-AP users. Tooltip boxes appear over entry fields providing brief explanations of input requirements.
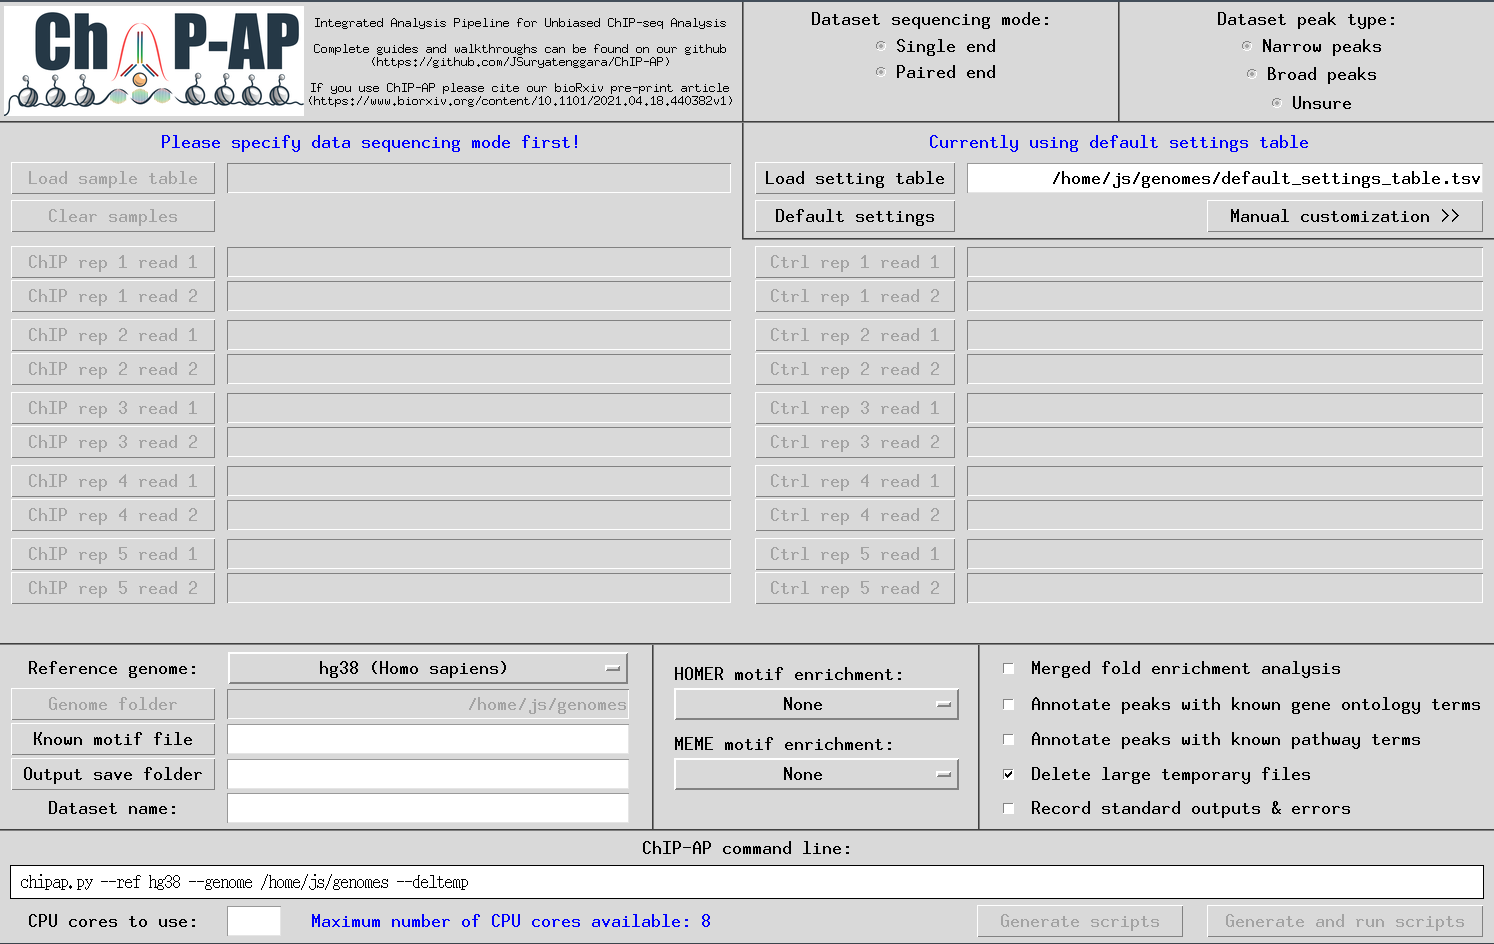
Once ChIP-AP is setup, at the command line type: chipap_dashboard.py
The GUI below will appear enabling users to input everything required for a run. Tooltip boxes will appear over each field providing brief explanations of whats required in said field.
A customized pipeline run is possible by providing the required flag arguments for each individual program in the pipeline at the * stage above. By selecting the right option, the secondary window to the right will appear containing multiple entry fields for such flag arguments. This option is for advanced users only. For valid flags, please refer to the documentation of each program specifically.
In each of these entry fields, user may key in the flag arguments as they are written for each corresponding program (e.g., “-q 20” for samtools view which will filter reads with a MAPQ > 20). This requires user to read dedicated official manuals to understand what and how these arguments can be given to the corresponding program in the pipeline. This, accompanied with the fact that bad/wrong flag arguments may break the pipeline run, shows that this manual customization of pipeline programs settings is recommended for experienced users only, and that inexperienced users should stick with the default settings or get a bioinformaticians input.
| Argument/Flag | Possible Values | Detailed Explanation |
|---|---|---|
| --mode | single / paired | Single-end or paired-end sequencing analysis. If a paired-end run, files will typically be labelled ending in *_R1 and *_R2 before the file extension. If these labels aren’t present then likely, you have single-ended sequencing data and select the “single” option. |
| --genome | [directory] | Your genome folder directory. Requires full path, not relative path. This is the folder where the pre-computed genome alignment and processing files are saved. These genomes can be downloaded from (https://www.dropbox.com/s/ioqd3hwdahh9xon/genomes.zip) or instead you can compute your own (in our GitHub guides directory, look for ChIP-AP_genome_guide) |
| --output | [directory] | Your desired output folder. Requires full path, not relative path. |
| --setname | [text] | The prefix to label output and intermediate files (no space allowed). ChIP-AP will rename all processed data files to have this “setname” prefix. |
| Argument/Flag | Possible Values | Detailed Explanation |
|---|---|---|
| --peak | narrow / broad | Narrow peaks for transcription factors (default). Broad peaks for histone modifiers. If unsure what will work best for your dataset, you may need to run ChIP-AP once in each mode and inspect the output to ensure you get what you want from the results. Pay close attention to the width of the peaks called and regions of enrichment. |
| --chipR1 | [repl1 repl2 …] | Your ChIP datasets: ordered by replicate, separated by space. Best to include full path rather than relative paths. |
| --chipR2 | [repl1 repl2 …] | [ Paired-end Only ] Your ChIP datasets second read: ordered by replicate, separated by space. Best to include full path rather than relative paths. |
| --ctrlR1 | [repl1 repl2 …] | Your control datasets: ordered by replicate, separated by space. Best to include full path rather than relative paths. |
| --ctrlR2 | [repl1 repl2 …] | [ Paired-end Only ] Your control datasets second read: ordered by replicate, separated by space. Best to include full path rather than relative paths. |
| --sample | [file] | Rather than including the input sample file names and paths on the command line, one can make a sample table containing the same information and input this instead. The sample-table is a 4*n-sized table (with n = number of replicates) containing the absolute paths to each of your ChIP and control replicates (See below for more information regarding this file and its layout). When this option is used, this table will disregard any assigned values to --chipR1, --chipR2, --ctrlR1, and --ctrlR2. |
| --setting | [file] | [ For Advanced Users ONLY ] The settings-table allows you to fine-tune the behaviour of every program as part of ChIP-AP. Hence very disasterous if you get wrong! If you are unsure even a little about what you’re doing, then stick to default settings please – this goes even for bioinformaticians. This txt file is a 2*n-sized table (with n = number of replicates) containing custom arguments for every program as part of ChIP-AP. The default settings table is provided in the genome folder. You can COPY this file and make changes as necessary. To use your customs settings table, provide full path to updated txt file. |
| --ref | hg19 / hg38 / mm9 / mm10 / dm6 / sacCer3 |
Your sample genome reference build. Default is hg38 (human). The genomes listed to the left are provided, pre-calculated by us and are the only genomes used and tested for now. We will provide added functionality soon to add your own custom genome to ChIP-AP. Watch this space (actually the github…)! |
| --motif | [file] | Your predicted/known motif file, in HOMER matrix format (.motif). If provided, once peaks are called, HOMER motif discovery will be run on the total called peak set for this motif. Many users prefer MEME-ChIP instead… we know… WIP :) |
| --fcmerge | This flag will force fold change analysis to be computed based on merged replicates instead of on each replicate seperately. This flag will be automatically activated when the number of ChIP samples is unequal to control samples. | |
| --goann | This flag will instruct to annotate peaks with all relevant GO terms as provided by HOMER. | |
| --pathann | This flag will instruct to annotate peaks with all relevant pathway and interaction enrichment terms as provided by HOMER. | |
| --deltemp | This flag will instruct to delete large intermediary files right after they are not going to be used for further processes (eg intermediary fq files. This option will save a significant amount of space by the end of your analysis, so recommended. | |
| --thread | [integer] | Maximum number of processes to use. Default is half the maximum available on your system so as to not choke it during the run. If running on a laptop or low-thread count cpu, best to push this up to maximum number threads available -1 – but this will significantly slow your laptop if attempting other tasks while ChIP-AP is running. |
| --run | Use to immediately run the suite by running the master script. This is the big red button ok... Use at your own risk! When not used, the generated master script (MASTER_script.sh) in the output folder can be run manually by user. We have made sure that when you tell ChIP-AP “do not press the big red button” that it will behave and do as you say. |
|
| --homer_motif | consensus / union / both |
This flag will instruct HOMER (findMotifsGenome.pl) to perform motif enrichment analysis at the end of the pipeline run. |
| --meme_motif | consensus / union / both |
This flag will instruct MEME (meme-chip) to perform motif enrichment analysis at the end of the pipeline run. |
ChIP-AP can directly process the output files of sequencing instruments. Files may be in FASTQ, or compressed FASTQ (.gz) format. ChIP-AP can also process aligned reads in BAM format. Reads may be single or paired ends. Background control is compulsory, no unmatched samples allowed here.
Performed by the main script. Each input sample is registered into the system and given a new name according to their sample category (ChIP or background control), replicate number, and whether it’s the first or second read file (in case of paired end sequencing data). Afterwards, their formats and compression status is recognized and processed into gun-zipped FASTQ as necessary.
Each process in ChIP-AP is executed from individual scripts generated. This was an intentional design decision as it allows for easy access for modifications of any step within the pipeline without hunting through the master ChIP-AP scripts. You can thank us later if you have to modify and tailor something later and don’t have to drudge through the trenches of someone else’s code. Chocolate treats are always welcome!
In the very beginning, ChIP-AP makes (in the user-designated output folder) a copy of each unaligned sequence reads file (e.g., fastq), compresses them into a gunzipped file (if not already), and renames them with the prepared new name from step “2. Sample recognition and registration”. If the given inputs are aligned reads (bam files), the pipeline starts at step “12. Sorting and indexing of aligned reads files” (see below) and the copying and renaming are taken over by “08_results_script.sh” where the original bam files are directly sorted and the pipeline proceeds normally from there.
Modular script used: 00_raw_data_script.sh
Op. 	: cp, gzip, mv (Bash)
Input	: [origin directory] / [original ChIP/control filename]
Process	: Copy, compress, and rename raw reads files
Output	: [output directory] / 00_raw_data / [setname]_[chip/ctrl]_rep[#]_R[1/2].fq.gz
Performed by FastQC. Reads quality assessment is performed to check for duplicates, adapter sequences, base call scores, etc. Assessment results are saved as reports for user viewing. If the final results are not as expected, its worthwhile to go through the multiple QC steps and track the quality of the data as its processed. If the default QC steps aren’t cleaning up the data adequately, you may need to modify some parameters to be more/less stringent with cleanup. From our testing, our default values seem to do a faily adequate job though for most datsets.
Modular script used: 01_raw_reads_quality_control_script.sh
Calls	: fastqc
Input	: 00_raw_data / [setname]_[chip/ctrl]_rep[#]_R[1/2].fq.gz
Process	: Generate raw reads quality assessment reports
Output	: 01_raw_reads_quality_control / [setname]_[chip/ctrl]_rep[#]_R[1/2]_fastqc.html
Performed by clumpify from BBMap package. Necessary command line argument is given to clumpify in order to remove optical duplicates and tile-edge duplicates from the reads file in addition to PCR duplicates. Optimization of file compression is also performed by clumpify during deduplication process, in order to minimize storage space and speed up reads file processing.
Modular script used: 02_deduplicating_script.sh
Calls	: clumpify.sh
Input	: 00_raw_data / [setname]_[chip/ctrl]_rep[#]_R[1/2].fq.gz
Process	: Remove PCR duplicates, optical duplicates, and tile-edge duplicates
Output	: 02_deduplicating / [setname]_[chip/ctrl]_rep[#]_R[1/2].deduped.fq.gz
Performed by BBDuk from BBMap package. BBDuk scans every read for adapter sequence, based on the reference list adapters given in the command line argument. The standard BBDuk adapter sequence reference list ‘adapter.fa’ is be used as a default in the pipeline. Any sequencing adapter present in the reads is removed. Custom adapter sequence can be used whenever necessary or by modifying the adapter.fa file with your new sequences.
Modular script used: 03_adapter_trimming_script.sh
Calls	: bbduk.sh
Input	: 02_deduplicating / [setname]_[chip/ctrl]_rep[#]_R[1/2].deduped.fq.gz
          [path to genome folder] / bbmap / adapters.fa   (file provided by ChIP-AP)
Process	: Trim away adapter sequences based on given sequences in file ‘adapters.fa’
Output	: 03_adapter_trimming / [setname]_[chip/ctrl]_rep[#]_R[1/2].adaptertrimmed.fq.gz
Performed by trimmomatic. Trimmomatic scans every read trims low quality base calls from reads. Additionally, it scans with a moving window along the read and cuts the remainder of the read when the average quality of base calls within the scanning window drops below the set threshold. Finally, it discards the entirety of a read of it gets too short post-trimming for alignment to reference genome, minimizing the chance of reads being multi-mapped to multiple genomic locations.
Modular script used: 04_quality_trimming_script.sh
Calls	: trimmomatic
Input	: 03_adapter_trimming / [setname]_[chip/ctrl]_rep[#]_R[1/2].adaptertrimmed.fq.gz
Process	: Remove reads with low PHRED (base calling) score
Output	: 04_quality_trimming / [setname]_[chip/ctrl]_rep[#]_R[1/2].qualitytrimmed.fq.gz
Performed by FastQC. Quality assessment is performed to check for the efficiency of cleanup. Results are saved as reports.
Modular script used: 05_preprocessed_reads_quality_control_script.sh
Calls	: fastqc
Input	: 04_quality_trimming / [setname]_[chip/ctrl]_rep[#]_R[1/2].qualitytrimmed.fq.gz
Process	: Generate preprocessed reads quality assessment reports
Output	: 05_preprocessed_reads_quality_control / [setname]_[chip/ctrl]_rep[#]_R[1/2]_fastqc.html
Performed by the mem algorithm in BWA aligner. Appropriate genome reference for the sample organism is given as a command line argument. The default genome reference is hg38. Precomputed genome references hg38, hg19, mm9, mm10, dm6, and sacCer3 are downloaded as part of the ChIP-AP installation process.
Tutorials for custom/different genome references can be found on the ChIP-AP github (coming soon!). BWA is used in preference to other alignes such as Bowtie2 as in benchmarking papers (Thankaswamy-Kosalai et al., 2017), we were more statisfied with the results of BWA, hence its inclusion in this pipeline.
Modular script used: 06_bwa_mem_aligning_script.sh
Calls	: bwa mem
Input	: 04_quality_trimming / [setname]_[chip/ctrl]_rep[#]_R[1/2].qualitytrimmed.fq.gz
          [path to genome folder] / bwa /   (reference genome provided by ChIP-AP)
Process	: Align preprocessed reads to the designated reference genome
Output	: 06_bwa_mem_aligning / [setname]_[chip/ctrl]_rep[#].aligned.bam
Performed by samtools view. This filter (if set) will remove all reads with alignment score (MAPQ) below a user defined threshold. Reads with suboptimal fit into the genome and/or reads with multiple ambiguous mapped locations can easily be excluded from the reads file using this filter step also. To disable MAPQ filtering, simply remove all flags from the settings table for this step.
Modular script used: 06_bwa_mem_aligning_script.sh
Calls	: samtools view
Input	: 06_bwa_mem_aligning / [setname]_[chip/ctrl]_rep[#].aligned.bam
Process	: Remove reads with low MAPQ (alignment) score
Output	: 07_MAPQ_filtering / [setname]_[chip/ctrl]_rep[#].mapqfiltered.bam
Performed by samtools sort and samtools index, which do nothing to the aligned reads files other than sorting and indexing, priming the aligned reads files for further processing.
Modular script used: 08_results_script.sh

Calls	: samtools sort
Input	: 07_MAPQ_filtering / [setname]_[chip/ctrl]_rep[#].mapqfiltered.bam
Process	: Sort all bam files based on coordinate
Output	: 08_results / [setname]_[chip/ctrl]_rep[#].bam

Calls	: samtools merge
Input	: 08_results / [setname]_chip_rep[#].bam
          08_results / [setname]_ctrl_rep[#].bam
Process	: Merge all sorted ChIP bam files and all sorted control bam files.
Output	: 08_results / [setname]_chip_merged.bam
          08_results / [setname]_ctrl_merged.bam
Cond.	: --fcmerge flag is used OR unequal number of ChIP and control samples OR peak type is broad

Calls	: samtools index
Input	: 08_results / [setname]_[chip/ctrl]_rep[#].bam
          08_results / [setname]_[chip/ctrl]_merged.bam
Process	: Make indices for all coordinate-sorted bam files
Output	: 08_results / [setname]_[chip/ctrl]_rep[#].bam.bai
          08_results / [setname]_[chip/ctrl]_merged.bam.bai

Calls	: samtools sort -n
Input	: 08_results / [setname]_[chip/ctrl]_rep[#].bam
Process	: Sort all bam files based on read name
Output	: 08_results / [setname]_[chip/ctrl]_rep[#]_namesorted.bam
Performed by plotFingerprint from the deeptools package, which generates fingerprint plots. These serve as a quality control figure that shows DNA pulldown efficiency of the ChIP experiment. Refer to the appropriate documentation for full details but in short – the input should be as close to the 1:1 diagonal as possible and the better enrichment seen in your sample, the more its curve will bend towards the bottom right. You want (ideally) a large gap between the chip and the control samples. PNG files are provided for easy viewing, SVG files provided if you want to make HQ verions later for publication.
Modular script used: 08_results_script.sh
Calls	: plotFingerprint
Input	: 08_results / [setname]_[chip/ctrl]_rep[#].bam
Process	: Generate fingerprint plots for all bam files
Output	: 08_results / fingerprint_plots/[setname].[png/svg]
	      08_results / fingerprint_plots/[setname]_merged.[png/svg]
Performed by bamCoverage from the deeptools package. Generates bigwig files for quick and simple visualization of reads distribution along the referenced genome using local tools such as IGV. The Coverage tracks can be uploaded to genome browsers such as UCSC, however a track hub needs to be generated – something ChIP-AP does not do at this stage.
Modular script used: 08_results_script.sh
Calls	: bamCoverage
Input	: 08_results / [setname]_[chip/ctrl]_rep[#].bam
          08_results / [setname]_[chip/ctrl]_merged.bam
Process	: Generate BigWig coverage file for each individual bam file
Output	: 08_results / [setname]_[chip/ctrl]_rep[#].bw
          08_results / [setname]_[chip/ctrl]_merged.bw
Processed by FastQC. Quality assessment is performed to check for the alignment efficiency, such as how many reads failed to be mapped. Assessment results are saved as reports.
Modular script used: 09_aligned_reads_quality_control_script.sh
Calls	: fastqc
Input	: 08_results / [setname]_[chip/ctrl]_rep[#].bam
          08_results / [setname]_[chip/ctrl]_merged.bam
Process	: Generate raw reads quality assessment reports
Output	: 08_results / [setname]_[chip/ctrl]_rep[#]_fastqc.html
          08_results / [setname]_[chip/ctrl]_merged_fastqc.html
For Transcription Factors - Performed by MACS2 (default setting), GEM, HOMER (factor setting), and Genrich for transcription factor proteins of interest.
For Broad Peaks (Histone Marks) - Performed by MACS2 (broad setting), SICER2, HOMER (broad setting), and Genrich for histone modifier protein of interest.
The same track of aligned reads is scanned for potential protein-DNA binding sites. The process returns a list of enriched regions in various formats.
Modular script used: 11_macs2_peak_calling_script.sh
Calls	: macs2 callpeak
Input	: 08_results / [setname]_[chip/ctrl]_rep[#].bam
Process	: Generate a list of called peaks
Output	: 11_macs2_peak_calling / [setname]_MACS2_peaks.narrowPeak

Modular script used: 12_gem_peak_calling_script.sh
Calls	: gem
Input	: 08_results / [setname]_[chip/ctrl]_rep[#].bam
Process	: Generate a list of called peaks
Output	: 12_gem_peak_calling / [setname]_GEM_GEM_events.txt
Cond.	: Peak type is narrow. GEM is replaced by SICER2 for broad peak.

Modular script used: 12_sicer2_peak_calling_script.sh
Calls	: sicer
Input	: 08_results / [setname]_[chip/ctrl]_merged.bam
Process	: Generate a list of called peaks
Output	: 12_sicer2_peak_calling / [setname]-W*-G*-islands-summary
          (* depends on -w and -g flag arguments. Defaults are 200 and 600, respectively)
Cond.	: Peak type is broad. SICER2 is replaced by GEM for narrow peak.

Modular script used: 13_homer_peak_calling_script.sh
Calls	: findPeaks
Input	: 08_results / [setname]_[chip/ctrl]_rep[#].bam
Process	: Generate a list of called peaks
Output	: 13_homer_peak_calling / [setname]_HOMER.peaks

Modular script used: 14_genrich_peak_calling_script.sh
Calls	: Genrich
Input	: 08_results / [setname]_[chip/ctrl]_rep[#]_namesorted.bam
Process	: Generate a list of called peaks
Output	: 14_genrich_peak_calling / [setname]_Genrich.narrowPeak
Performed by a custom script and HOMER’s mergePeaks. The custom script reformats necessary peak caller outputs into HOMER region list format. mergePeaks looks for overlaps between the regions in the four peak caller outputs and lists the merged regions in multiple files based on the peak caller(s) that calls them. These multiple files are then concatenated together into a single regions list file.
Modular script used: 21_peaks_merging_script.sh
Calls	: mergePeaks
Input	: 11_macs2_peak_calling / [setname]_MACS2_peaks.narrowPeak
          12_gem_peak_calling / [setname]_GEM_GEM_events.txt (narrow peak only)
          12_sicer2_peak_calling / [setname]-W*-G*-islands-summary (broad peak only)
          13_homer_peak_calling / [setname]_HOMER.peaks
          14_genrich_peak_calling / [setname]_Genrich.narrowPeak
Process	: Generate multiple lists of merged peak coordinates based on peak callers
Output	: 21_peaks_merging / [setname]_merged_peaks*
          (* is the combination of peak callers where the listed peaks in are found in; e.g., [setname] _merged_peaks_MACS2_Genrich)


Modular script used: 22_peaks_processing_script.sh
Op. 	: cat (Bash)
Input	: 21_peaks_merging / [setname]_merged_peaks*
Process	: Generate concatenated list of peak coordinates
Output	: 22_peaks_processing / [setname]_all_peaks_concatenated.tsv
Performed by annotatePeaks from HOMER package. Each region in the concatenated list is annotated based on its genomic location for the genome specified. The process returns the same list of regions, with each entry row appended with various information pertaining to the gene name, database IDs, category, and instances of motif (if HOMER known motif matrix file is provided to ChIP-AP), etc.
Modular script used: 22_peaks_processing_script.sh
Calls	: annotatePeaks
Input	: 22_peaks_processing/[setname]_all_peaks_concatenated.tsv
Process	: Append gene annotations to the list of peak coordinates
Output	: 22_peaks_processing/[setname]_all_peaks_annotated.tsv
Performed by a custom script, with the help of samtools depth and view modules. For weighted peak center fold enrichment calculation in cases of narrow peak type datasets, the custom script sends out the reformatted genomic regions as command line arguments for multi-threaded samtools depth runs. Samtools depth returns a list of read depths at each base within the region and saves them in a temporary file. The script then reads the temporary files and determine the weighted peak centers and returns the read depth values along with the base locations. The custom script sends out the weighted peak center base locations as command line arguments for multi-threaded samtools view runs. Samtools view returns the read depth values at the given base locations. The custom script then calculates the fold enrichment values, corrected based on ChIP-to-control normalization factor.
For average fold enrichment calculation in cases of broad peak type datasets, samtools view simply sums up the number of reads in the whole peak region, then calculates the fold enrichment values, corrected based on ChIP-to-control normalization factor.
In addition, the custom-made script also makes some reformatting and provides additional information necessary for downstream analysis.
Modular script used: 22_peaks_processing_script.sh
Calls	: fold_change_calculator.py
Input	: 22_peaks_processing / [setname]_all_peaks_annotated.tsv
Process	: Calculate ChIP tag counts (read depth)
          Calculate weighted center fold change (narrow peak only)
          Calculate average fold change (broad peak only)
          Calculate number of peak callers overlaps
          Calculate number of user-provided (via --motif flag) motif instances found
Output	: 22_peaks_processing / [setname]_all_peaks_calculated.tsv
          (Ready to view, if user does not wish for gene ontology or pathway annotations)
Performed by a custom script plugged to IDR module. The IDR module compares two different peak sets and assign to each listed peak in both peak sets an irreproducibility rate (IDR) value based on that peak’s capacity to be recalled by the other peak set. IDR value of each peak listed in the full (union) peak list ([setname]_all_peaks_calculated.tsv) was obtained by pairing it against every individual peak caller sets, followed by calculating the pair-wise -logIDR values, then summing them all up, and finally converting it into a final IDR value. The final IDR value shows the chance of a finding (i.e., the peak) being unable to be reproduced by different peak calling algorithms. This step reprocesses the peak list [setname]_all_peaks_calculated.tsv, augment the table with relevant IDR values, and re-save it under the same file name. For more details about IDR calculation method, see the IDR module documentations.
Modular script used: 22_peaks_processing_script.sh
Calls   : IDR_integrator.py, IDR
Input   : 22_peaks_processing / [setname]_all_peaks_calculated.tsv
Process : Calculate -logIDR of peaks between union vs MACS2 peak set
          Calculate -logIDR of peaks between union vs GEM/SICER2 peak set
          Calculate -logIDR of peaks between union vs HOMER peak set
          Calculate -logIDR of peaks between union vs Genrich peak set
          Calculate IDR value of peaks from the sum of -logIDR values
Output  : 22_peaks_processing / [setname]_all_peaks_calculated.tsv
(Ready to view, if user does not wish for gene ontology or pathway annotations)
Performed by a custom script designed for quality assessment of called peaks. Returns a summary text file containing information pertaining to the peak read depth, peak fold enrichment, known motif hits, and positive peak hits (based on known motif presence), in each peak set along the continuum between single peak callers and the absolute consensus of all four peak callers.
Modular script used: 22_peaks_processing_script.sh
Calls	: peak_caller_stats_calculator.py
Input	: 22_peaks_processing / [setname]_all_peaks_calculated.tsv
Process	: Generate a separate summary table of key statistics in peak callers performance
Output	: 22_peaks_processing / [setname]_peak_caller_combinations_statistics.tsv
Each peak in the concatenated list is appended with all the gene ontology terms associated with its gene annotation. The gene ontology terms are derived from biological processes, molecular functions, and cellular compartments databases. This enables list filtering based on the gene ontology terms of the study’s interest
Modular script used: 23_go_annotation_script.sh
Calls	: go_annotator.py
Input	: 22_peaks_processing / [setname]_all_peaks_calculated.tsv
Process	: Append related gene ontology terms to the list of peaks
Output	: 23_supplementary_annotations / [setname]_all_peaks_go_annotated.tsv
Each peak in the concatenated list is appended with all the related biological pathways associated with its gene annotation. The biological pathway terms are derived from KEGG, SMPDB, Biocyc, Reactome, Wikipathways, and pathwayInteractionDB databases. This enables list filtering based on the biological pathways of the study’s interest. Additionally, this analysis also adds other terms pertaining to known interactions with common proteins and known gene mutations found in malignant cases, derived from common protein interaction and COSMIC databases, respectively.
Modular script used: 23_pathway_annotation_script.sh
Calls	: pathway_annotator.py
Input	: 22_peaks_processing / [setname]_all_peaks_calculated.tsv
Process	: Append known pathways and interactions to the list of peaks
Output	: 23_supplementary_annotations / [setname]_all_peaks_pathway_annotated.tsv
Genomic sequences are extracted based on the coordinates of the peaks in consensus (four peak callers overlap), union (all called peaks), or both peak lists. HOMER performs analysis to identify specific DNA sequence motifs to which the experimented protein(s) have binding affinity towards. For the sake of processing speed, HOMER utilizes cumulative binomial distribution to calculate motif enrichment by default. However, by utilizing ChIP-AP custom setting table, user may choose to utilize cumulative hypergeometric distribution, which describes motif enrichment problem more accurately. Besides the typically performed calculations for de novo motifs discovery, HOMER also calculates the enrichment scores of the known motifs in HOMER motifs database. Since the relevance of protein-DNA binding events are mainly more restricted to the context of transcription factors compared to its histone modifiers counterpart, this optional downstream analysis option is only available for datasets with narrow (transcription factor) peaks.
Modular script used: 24_homer_motif_enrichment_consensus_script.sh
                     24_homer_motif_enrichment_union_script.sh
Calls   : findMotifsGenome.pl
Input   : 22_peaks_processing / [setname]_all_peaks_calculated.tsv
Process : Performs motif enrichment analysis
Output  : 24_homer_motif_enrichment / ... / homerResults.html
          24_homer_motif_enrichment / ... / knownResults.html
sequences are extracted based on the coordinates of the peaks in consensus (four peak callers overlap), union (all called peaks), or both peak lists. With or without control sequences extracted from random genomic sequences, MEME performs analysis to identify specific DNA sequence motifs to which the experimented protein(s) have binding affinity towards. By utilizing separate dedicated modules included in MEME suite, MEME-ChIP performs de novo motif discovery, motif enrichment analysis, motif location analysis and motif clustering in one go, providing a comprehensive picture of the DNA motifs that are enriched in the extracted sequences. MEME-ChIP performs two complementary types of de novo motif discovery: weight matrix–based discovery for high accuracy, and word-based discovery for high sensitivity. Since the relevance of protein-DNA binding events are mainly more restricted to the context of transcription factors compared to its histone modifiers counterpart, this optional downstream analysis option is only available for datasets with narrow (transcription factor) peaks.
Modular script used: 25_meme_motif_enrichment_consensus_script.sh
                     25_meme_motif_enrichment_union_script.sh
Calls   : meme-chip
Input   : 22_peaks_processing / [setname]_all_peaks_calculated.tsv
Process : Performs motif enrichment analysis
Output  : 25_meme_motif_enrichment / ... / meme-chip.html
The table below shows the contents of [setname]_all_peaks_go_pathway_annotated.tsv. Smaller sized and less verbose variants of this table are saved in the output folder with suffixes: concatenated, annotated, and calculated (see Source in the table below)
| Column # | Peak Attribute | Source |
|---|---|---|
| Column 1 (A) | Peak ID (unique peak ID) |
Pipeline script: 22_peaks_ processing _script.sh Called program: cat (Bash) Output file: [setname]_all_peaks_concatenated.tsv Output folder: 22_peaks_processing |
| Column 2 (B) | Chr (chromosome) | |
| Column 3 (C) | Start (peak start coordinate) | |
| Column 4 (D) | End (peak end coordinate) | |
| Column 5 (E) | Strand (on which peak is found) | |
| Column 6 (F) | Peak Caller Combination | |
| Column 7 (G) | Peak Caller Overlaps |
Pipeline script: 22_peaks_processing_script.sh Called script: fold_change_calculator.py Output file: [setname]_all_peaks_calculated.tsv Output folder: 22_peaks_processing |
| Column 8 (H) | ChIP Tag Count | |
| Column 9 (I) | Control Tag Count | |
| Column 10 (J) | Fold Change | |
| Column 11 (K) | Peak Center | |
| Column 12 (L) | Number of Motifs | |
| Column 13 (M) | negLog10_IDR | |
| Column 14 (N) | IDR | |
| Column 15 (O) | Annotation |
Pipeline script: 22_peaks_processing_script.sh Called program: HOMER annotatePeaks Output file: [setname]_all_peaks_annotated.tsv Output folder: 22_peaks_processing |
| Column 16 (P) | Detailed Annotation | |
| Column 17 (Q) | Distance to TSS | |
| Column 18 (R) | Nearest PromoterID | |
| Column 19 (S) | Entrez ID | |
| Column 20 (T) | Nearest Unigene | |
| Column 21 (U) | Nearest Refseq | |
| Column 22 (V) | Nearest Ensembl | |
| Column 23 (W) | Gene Name | |
| Column 24 (X) | Gene Alias | |
| Column 25 (Y) | Gene Description | |
| Column 26 (Z) | Gene Type | |
| Column 27 (AA) | CpG% | |
| Column 28 (AB) | GC% | |
| Column 29 (AC) | Biological Process |
Pipeline script: 23_go_annotation_script.sh Called script: GO_annotator.py Output file: [setname]_all_peaks_go_annotated.tsv Output folder: 23_supplementary_annotations |
| Column 30 (AD) | Molecular Function | |
| Column 31 (AE) | Cellular Component | |
| Column 32 (AF) | Interaction with Common Protein |
Pipeline script: 23_pathway_annotation_script.sh Called script: pathway_annotator.py Output file: [setname]_all_peaks_pathway_annotated.tsv Output folder: 23_supplementary_annotations |
| Column 33 (AG) | Somatic Mutations (COSMIC) | |
| Column 34 (AH) | Pathway (KEGG) | |
| Column 35 (AI) | Pathway (BIOCYC) | |
| Column 36 (AJ) | Pathway (pathwayInteractionDB) | |
| Column 37 (AK) | Pathway (REACTOME) | |
| Column 38 (AL) | Pathway (SMPDB) | |
| Column 39 (AM) | Pathway (Wikipathways) |
All the results are compiled and can be viewed by opening the file homerResults.html in an HTML file viewer such as your internet browser. This file gives you a formatted, organized view of the enriched de novo motifs and all the relevant information, as can be seen below. Additionally, more details can be accessed by simply clicking on the links in the table.
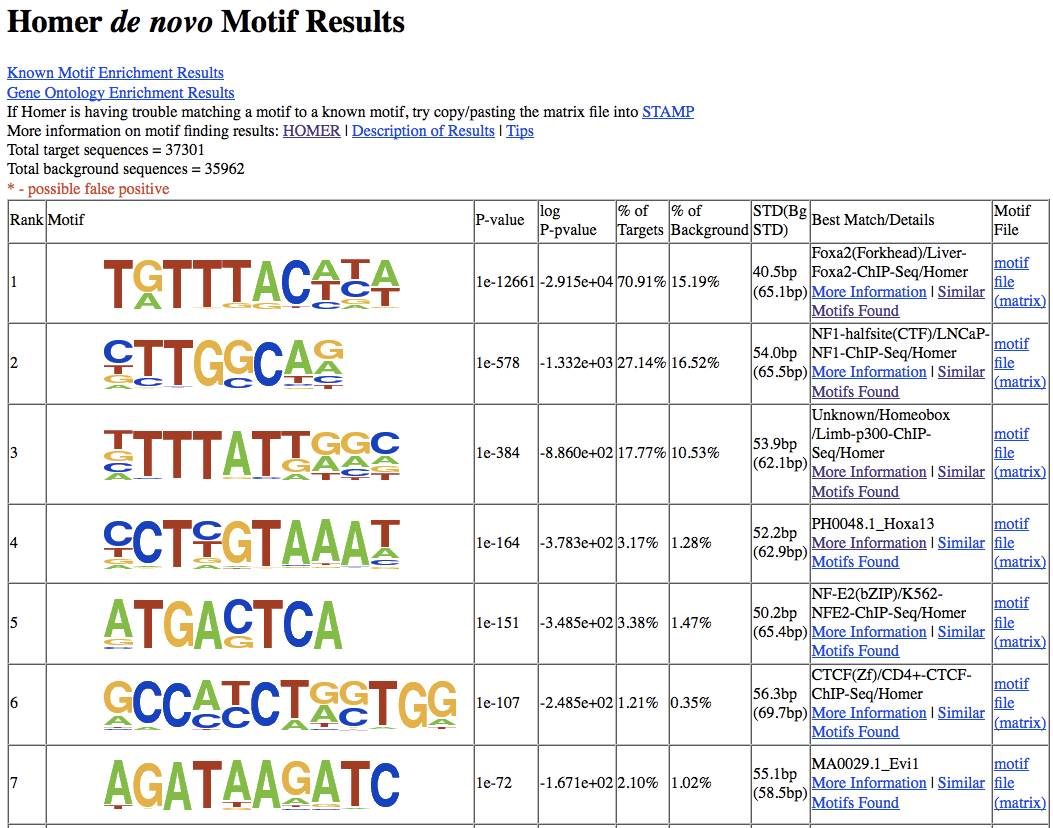
We can see these information listed below from the table:
| Column Name | Definition |
|---|---|
| Rank | Motif Rank |
| Motif | Motif position weight matrix logo |
| P-value | Final enrichment p-value |
| log P-pvalue | Log of p-value |
| % of Targets | Number of target sequences with motif/ total targets |
| % of Background | Number of background sequences with motif/ total background |
| STD(Bg STD) | Standard deviation of position in target and background sequences |
| Best Match/Details | Best match of de novo motif to motif database |
In addition to de novo motif enrichment, homer also performs motif enrichment analysis on the known binding motifs readily available within their database repertoire. The results for this analysis can be viewed in a similar way by opening the file knownResults.html, which contains similar information as its de novo counterpart.
More detailed information is available in http://homer.ucsd.edu/homer/ngs/peakMotifs.html
All the results are compiled and can be viewed by opening the file meme-chip.html in an HTML file viewer such as your internet browser. This file gives you a formatted, organized view of the enriched de novo motifs and all the relevant information. Additionally, more details can be accessed by simply clicking on the links in the table.
In datasets where there is an equal number of multiple-replicated ChIP and control samples, ChIP-AP will have MEME perform a pair-wise motif enrichment analysis. Therefore, in that case, there will be multiple replicates of motif enrichment results, each one looking like below.
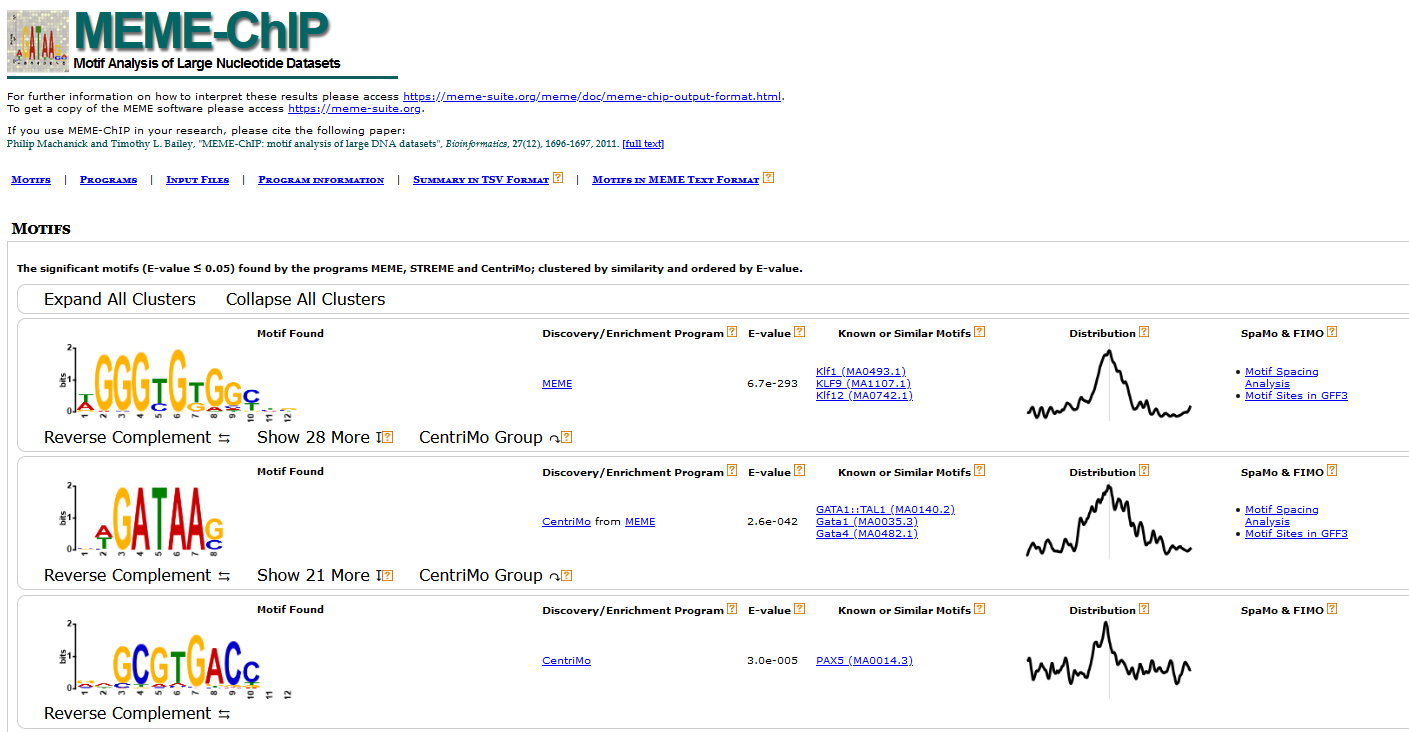
While the file above gives a more graphical representation of the results, meme-chip also generates another file: summary.tsv, which contains the same information (see below) repackaged in table format suitable for subsequent processing, if needed.
| Column Name | Definition |
|---|---|
| MOTIF_INDEX | The index of the motif in the "Motifs in MEME text format" file ('combined.meme') output by MEME-ChIP. |
| MOTIF_SOURCE | The name of the program that found the de novo motif, or the name of the motif file containing the known motif. |
| MOTIF_ID | The name of the motif, which is unique in the motif database file. |
| ALT_ID | An alternate name for the motif, which may be provided in the motif database file. |
| CONSENSUS | The ID of the de novo motif, or a consensus sequence computed from the letter frequencies in the known motif (as described below). |
| WIDTH | The width of the motif. |
| SITES | The number of sites reported by the de novo program, or the number of "Total Matches" reported by CentriMo. |
| E-VALUE | The statistical significance of the motif. |
| E-VALUE_SOURCE | The program that reported the E-value. |
| MOST_SIMILAR_MOTIF | The known motif most similar to this motif according to Tomtom. |
| URL | A link to a description of the most similar motif, or to the known motif. |
More detailed information is available in https://meme-suite.org/meme/doc/meme-chip.html
The table below shows the contents of [setname]_peak_caller_combinations_statistics.tsv.
| Column # | Peak Set Attribute |
|---|---|
| Column 1 (A) | Peak Callers Combination |
| Column 2 (B) | Exclusive Peak Count |
| Column 3 (C) | Exclusive Positive Peak Count |
| Column 4 (D) | Exclusive Motif Count |
| Column 5 (E) | Exclusive Positive Peak Hit Rate |
| Column 6 (F) | Exclusive Motif Hit Rate |
| Column 7 (G) | Exclusive ChIP Peak Read Depth |
| Column 8 (H) | Exclusive ChIP Peak Fold Change |
| Column 9 (I) | Inclusive Peak Count |
| Column 10 (J) | Inclusive Positive Peak Count |
| Column 11 (K) | Inclusive Motif Count |
| Column 12 (L) | Inclusive Positive Peak Hit Rate |
| Column 13 (M) | Inclusive Motif Hit Rate |
| Column 14 (N) | Inclusive ChIP Peak Read Depth |
| Column 15 (O) | Inclusive ChIP Peak Fold Change |
-
Exclusive: Only counts for a specific peak caller combination (e.g., Exclusive peak count of MACS2 only counts for peaks that is exclusively called by MACS2 alone).
-
Inclusive: Counts for other peak caller combinations containing the same peak callers (e.g., Inclusive peak count of MACS2|GEM also counts for all other peaks in MACS2|GEM|HOMER, MACS2|GEM|Genrich, and MACS2|GEM|HOMER|Genrich).
This file summarizes the assignment of the files (IP sample or control, read 1 or 2; replicate number) and the file name conversion for every unaligned or aligned sequencing reads to be processed. Each line tells the user what the original files have been renamed into. Check this file if you suspect the order of samples were incorrectly entered (i.e., swapped chip with control)
Chromatin IP dataset replicate 1, 1st read : Original filename = a.fastq --> New filename = setname_chip_rep1_R1.fq.gz

Chromatin IP dataset replicate 2, 1st read : Original filename = b.fastq --> New filename = setname _chip_rep2_R1.fq.gz

Chromatin IP dataset replicate 1, 2nd read : Original filename = c.fastq --> New filename = setname _chip_rep1_R2.fq.gz

Chromatin IP dataset replicate 2, 2nd read : Original filename = d.fastq --> New filename = setname _chip_rep2_R2.fq.gz

Control dataset replicate 1, 1st read : Original filename = e.fastq --> New filename = setname _ctrl_rep1_R1.fq.gz

Control dataset replicate 2, 1st read : Original filename = f.fastq --> New filename = setname _ctrl_rep2_R1.fq.gz

Control dataset replicate 1, 2nd read : Original filename = g.fastq --> New filename = setname _ctrl_rep1_R2.fq.gz

Control dataset replicate 2, 2nd read : Original filename = h.fastq --> New filename = setname _ctrl_rep2_R2.fq.gz
Contains the command line that was used to call the pipeline in a text file: [setname]_command_line.txt in the output save folder. This is useful for documentation of the run, and for re-running of the pipeline after a run failure or some tweaking if need be.
[chipap directory]/chipap.py --mode paired --ref hg38 --genome [path_to_genome_folder] --output [full_path_to_output_save_folder] --setname [dataset name] --sample_table [path_to_sample_table_file] --custom_setting_table [path_to_setting_table_file].tsv --motif [path_to_known_motif_file] --fcmerge --goann --pathann --deltemp --thread [#_of_threads_to_use] --run
Contains the full path of each input ChIP and control sample in the pipeline run in a tab-separated value file: [setname]_sample_table.tsv in the output save folder in ChIP-AP sample table format. This is useful for documentation of the run, and for re-running of the pipeline after a run failure or some tweaking if need be. Below is an example of sample table file content (header included), given paired-end samples with two ChIP replicates and two control replicates:
| chip_read_1 | chip_read_2 | ctrl_read_1 | ctrl_read_2 |
|---|---|---|---|
| ... /a.fastq | ... /c.fastq | ... /e.fastq | ... /g.fastq |
| ... /b.fastq | ... /d.fastq | ... /f.fastq | ... /h.fastq |
If your sample is single-ended, then the '..._read_2' columns can be simple be left blank, or the sample table can be simplified to as follows:
| chip_read_1 | ctrl_read_1 |
|---|---|
| ... /a.fastq | ... /e.fastq |
| ... /b.fastq | ... /f.fastq |
A cornerstone of ChIP-AP’s functionality is the settings table. ChIP-AP, with the raw fq files and the settings table, is able to reproduce (near) identically any analysis that was performed (provided the same program version numbers are used). The ‘near identically’ statements is owing to the fact that reported alignments of multi-mappers may, in some cases, give every so slightly different results. This ambiguity can be alleviated however by filtering out alignments with low MAPQ scores in the corresponding alignment filter step, post-alignment to ensure consistent results from every analysis run. The provision of the settings table therefore ensures reproducibility of any analysis with minimal effort and bypasses the usually sparse and significantly under-detailed methods sections of publications. Science is supposed to be reproducible, yet bioinformatics analysis are typically black-boxes which are irreproducible. This 1 file, changes that!
The structure of the settings table is simple. It is a 2 column tab-separated value file with the names of the programs on the 1st column, and the necessary flags required or changed in the 2nd column. If making your own custom table, then the 1st column below must be copied as-is and not changed. These 2 columns together, list the flags and argument values for each program used in the pipeline.
When ChIP-AP is run, a copy of the used settings table is saved as a tab-separated value file: [setname]_ setting_table.tsv in the output save folder.
If you have a custom settings table made and provided it as input, then ChIP-AP will make a 2nd copy of this table in the same output save folder. This decision is made as it is useful documentation of the run performed. This file is also useful for re-running of the pipeline after run failure or some tweaking if necessary. If submitting an issue request on Github, you must provide us your settings table used as well as all other requested information. See Github for details regarding this.
We consider the dissemination of the information of this file as vital and essential along with results obtained. The table can be included as a supplemental table in a manuscript or can be included as a processed data file when submitting data to GEO – either way, the information of this file must be presented when publishing data.
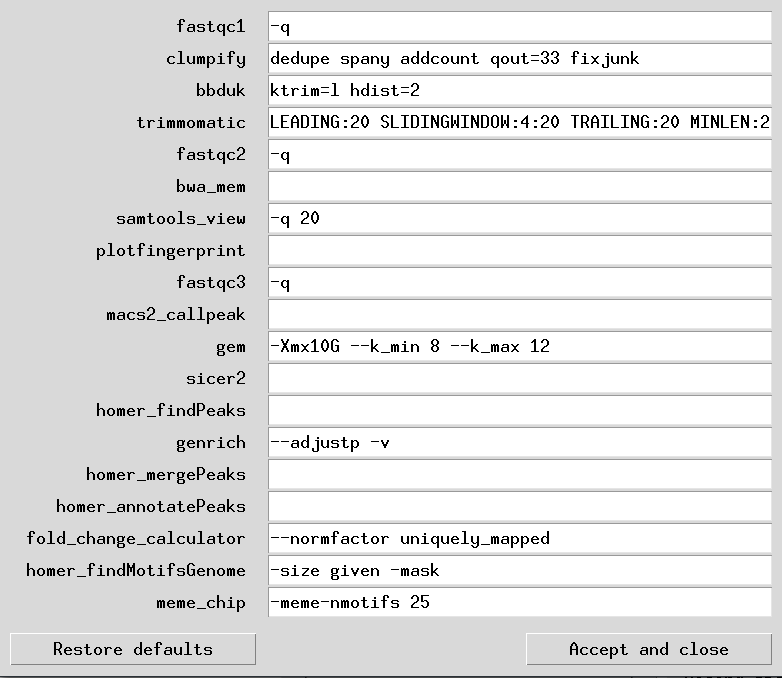
Below is an example of setting table file in its default-setting state:
Note: When running GEM, to ensure absolute reproducibility of all results every single run, you MUST add the flag "--t 1" to the DST below. When GEM is run in multi-threaded mode, its results are not reproducible over multiple runs even with the same parameters (although they are very close to each other). This is an issue we raised with the developers and is out of our hands. We highly doubt they will fix this aspect of GEM's behaviour. Therefore if 100% reproducibility of results is key for you, run in single-threaded mode only - even if it will take longer to run.
| program | argument |
|---|---|
| fastqc1 | -q |
| clumpify | dedupe spany addcount qout=33 fixjunk |
| bbduk | ktrim=r k=21 mink=8 hdist=2 hdist2=1 |
| trimmomatic | LEADING:20 SLIDINGWINDOW:4:20 TRAILING:20 MINLEN:20 |
| fastqc2 | -q |
| bwa_mem | |
| samtools_view | -q 20 |
| plotfingerprint | |
| fastqc3 | -q |
| macs2_callpeak | |
| gem | -Xmx10G --k_min 8 --k_max 12 |
| sicer2 | |
| homer_findPeaks | |
| genrich | --adjustp -v |
| homer_mergePeaks | |
| homer_annotatePeaks | |
| fold_change_calculator | --normfactor uniquely_mapped |
| homer_findMotifsGenome | -size given -mask |
| meme_chip | -meme-nmotifs 25 |
As can be seen, certain flags and values for some programs have been preset as per our testing and opinions. A point to note however, some flags for programs, such as -BAMPE in MACS2, are not listed since they are “hard-coded” into the pipeline and cannot be modified. For this example of -BAMPE in MACS2, this is “hard-coded” because this flag is essential for running peak calling in paired-end datsets. Parameters and flags like this that must be set are “hard-coded” and hidden and cannot be changed unless by choosing the appropriate narrow/broad run modes. A listing of all these “hard-coded” parameters can be found in the next section.
Below however is a listing of the values listed above in the default-settings with an explanation as to why we set these values as they are.
| Program | Flag / Argument | Explanation |
|---|---|---|
| fastqc | -q | This flag prevents FastQC from printing progress status in the terminal |
| clumpify | dedupe spany addcount qout=33 |
These parameters are added since they instruct clumpify to remove optical duplicates (dedupe spany) and count the reads input. Clumpify will automatically optimize compression of output gz files with no additional parameters. qout=33 is used to convert the fastq base calling score into phred33 format in case the input data still uses the old phred64 format. fixjunk is used so that clumpify will attempt to repair reads with broken attributes, preventing errors to occur down the pipeline |
| bbduk | ktrim=r k=21 mink=8 hdist=2 hdist2=1 |
The flag ktrim=r will instruct bbduk to operate in right-trimming mode for matched adaptor kmers (i.e., trim from the right / 3’ end of read). The flags k=21 and mink=8 set the full-length k-mer to 21 bases, which can gradually shorten down to 8 bases when scanning read ends. The flags hdist=2 and hdist2=1 instructs bbduk to use a hamming distance of 2 when processing full-length k-mers, and 1 when processing shorter -kmers. |
| Trimmomatic | LEADING:20 SLIDINGWINDOW:4:20 TRAILING:20 MINLEN:20 | These 4 flags and parameters instruct Trimmomatic (T) on how to trim reads. The LEADING:20 flag directs T to remove bases at the 5’ start of the read with PHRED scores <20. Likewise, TRAILING:20 instructs T to do the same but for the 3’ end of the read. The SLIDINGWINDOW:4:20 paramater instructs T to use a sliding window of 4bp, and to scan the entire read and when the average PHRED score drops below 20, then T will trim the remainder of the read at that point. Finally, the MINLEN:20 flag instructs T to drop all trimmed reads with a length <20bp as we believe shorter reads will likely map more ambiguously to the genome and not be informative. |
| samtools view | -q 20 | This option instructs samtools to remove all aligned reads with a MAPQ score < 20. This is seen as an optional but recommended step to remove reads with less favourable mapping scores. For more information on MAPQ scores, search online as that discussion is beyond the scope of this explanation. |
| GEM | -Xmx10G --k_min 8 --k_max 12 |
As GEM is java jar package, the amount of ram required to run needs to be specified. For this, the -Xmx10G flag is used which allocates 10Gb of ram for GEM to run. This can (and probably) should be increased if your system has the ram to accommodate it, to avoid any potential issues with out of memory errors and crashes. The –k_min and –k_max flags instruct GEM to search for kmers between 8 and 12bp. Depending on your datset you may need to change this, but for defaults these values will suffice. |
| Genrich | --adjustp | This flag is NOT part of Genrich’s default behaviour. We noted aberrant peak calling with low coverage datasets in our dataset and confirmed this behaviour with the developer in private communications. Through our testing, we derived equations that allow us to curtail Genrich’s aberrant behaviour in such scenarios. This adjustment is performed and derived by us and is not attirubuted to Genrich and/or its developer(s). |
| FC Calculator | --normfactor uniquely_mapped |
This flag instructs the fold-change calculator script to only consier uniquely-mapped reads in the fold-change calculation. While multi-mapped reads might be important to consider in some scenario’s, we deemed it more accurate to calculate FC based on uniquely-mapped reads. |
| HOMER findMotifsGenome |
-size given -mask |
These instruct findMotifsGenome to perform motif enrichment analysis based on the original size of the sequences based on the peak widths, with the genomic repeat sequences masked (discounted from contributing to the motif enrichment). |
| meme-chip | -meme-nmotifs 25 | This instructs meme-chip to find up to 25 top enriched motifs. Any more than rank 25 typically has too low enrichment values to be considered as a true binding event. |
Below are a listing of all the “hard-coded” settings hidden in ChIP-AP’s code with a brief explanation of why they are used. Full details can be found in the official documentation for each program.
In other words: AVOID providing any of these flags or giving any arguments through them in the settings table since it will cause conflicts, and quite possibly leading to pipeline break.
| Program Sub-cmd |
Flag | Definition | Explanation |
|---|---|---|---|
| fastqc1 | -t | Number of threads | Determined by ChIP-AP --thread |
| -o | Output directory | Locked to [output directory] / 01_raw_data | |
| clumpify | in= | Sequencing data input | Locked by ChIP-AP file naming and pathing |
| out= | Sequencing data output | Locked by ChIP-AP file naming and pathing | |
| in2= | Sequencing data input | Locked by ChIP-AP file naming and pathing | |
| out2= | Sequencing data output | Locked by ChIP-AP file naming and pathing | |
| bbduk | in= | Sequencing data input | Locked by ChIP-AP file naming and pathing |
| out= | Sequencing data output | Locked by ChIP-AP file naming and pathing | |
| in2= | Sequencing data input | Locked by ChIP-AP file naming and pathing | |
| out2= | Sequencing data output | Locked by ChIP-AP file naming and pathing | |
| ref= | Path to adapter sequences file | Locked to [path to genome folder] / bbmap / adapters.fa | |
| trimmomatic | SE | Flag to use single-end reads mode | Determined by ChIP-AP --mode |
| PE | Flag to use paired-end reads mode | Determined by ChIP-AP --mode | |
| -threads | Number of threads | Determined by ChIP-AP --thread | |
| fastqc2 | -t | Number of threads | Determined by ChIP-AP --thread |
| -o | Output directory | Locked by ChIP-AP file naming and pathing | |
| bwa mem |
-t | Number of threads | Determined by ChIP-AP --thread |
| samtools view |
-@ | Number of threads | Determined by ChIP-AP --thread |
| -h | Flag to include SAM file header | Locked to use -h | |
| -b | Flag to produce result in BAM format | Locked to use -b | |
| plotfingerprint | -p | Number of threads | Determined by ChIP-AP --thread |
| -b | Sequencing data input/output | Locked by ChIP-AP file naming and pathing | |
| -l | Sample input/output labels | Locked by ChIP-AP file naming and pathing | |
| -o | Output directory | Locked by ChIP-AP file naming and pathing | |
| fastqc3 | -t | Number of threads | Determined by ChIP-AP --thread |
| -o | Output directory | Locked by ChIP-AP file naming and pathing | |
| macs2 callpeak |
-f | Input format | Locked to SAM format |
| -t | Sequencing data input/output | Locked by ChIP-AP file naming and pathing | |
| -c | Sequencing data input/output | Locked by ChIP-AP file naming and pathing | |
| -g | Sample genome size | Determined by ChIP-AP internal genome size data | |
| --name | Output prefix | Locked by ChIP-AP file naming and pathing | |
| --outdir | Output directory | Locked by ChIP-AP file naming and pathing | |
| --broad | Flag to use broad peak calling mode | Determined by ChIP-AP --peak | |
| gem | --expt | Sequencing data input/output | Locked by ChIP-AP file naming and pathing |
| --ctrl | Sequencing data input/output | Locked by ChIP-AP file naming and pathing | |
| --t | Number of threads | Determined by ChIP-AP --thread | |
| --d | Path to file containing sample reads distribution | Locked to [path to genome folder] / GEM / Read_Distribution_default.txt | |
| --g | Path to file containing sample genome chromosome sizes | Locked to [path to genome folder] / GEM / [sample genome reference build].chrom.sizes | |
| --genome | Path to file containing sample whole genome FASTA sequence | Locked to [path to genome folder] / GEM / [sample genome reference build]_Chr_FASTA | |
| --s | Sample genome size | Determined by ChIP-AP internal genome size data | |
| --f | Input format | Locked to BAM format | |
| --out | Output directory | Locked by ChIP-AP file naming and pathing | |
| sicer2 | -cpu | Number of threads | Determined by ChIP-AP --thread |
| -t | Sequencing data input/output | Locked by ChIP-AP file naming and pathing | |
| -c | Sequencing data input/output | Locked by ChIP-AP file naming and pathing | |
| -s | Sample genome reference build | Determined by ChIP-AP --ref | |
| HOMER findPeaks |
-style | Sample peak type | Determined by ChIP-AP --peak |
| -gsize | Sample genome size | Determined by ChIP-AP internal genome size data | |
| -o | Output file name | Locked by ChIP-AP file naming and pathing | |
| -i | Input directory | Locked by ChIP-AP file naming and pathing | |
| genrich | --mode | Sample read mode | Determined by ChIP-AP --mode |
| -y | Flag to keep unpaired reads | Determined by ChIP-AP --mode | |
| -t | Sequencing data input/output | Locked by ChIP-AP file naming and pathing | |
| -o | Output file name | Locked by ChIP-AP file naming and pathing | |
| -c | Sequencing data input/output | Locked by ChIP-AP file naming and pathing | |
| HOMER mergePeaks |
-prefix | Output merged peaks files prefix | Locked to [setname]_merged_peaks |
| -matrix | Output data matrix files prefix | Locked to matrix; useful but not mandatory for subsequent processes for now | |
| -venn | Output venn diagram file name | Locked to venn.txt; useful but not mandatory for subsequent processes for now | |
| HOMER annotatePeaks |
-m | Path to file containing known motifs (.motif) | Determined by ChIP-AP --motif |
| -nmotifs | Flag to report the number of motifs per peak | Mandatory for subsequent processes | |
| -matrix | Output data matrix files prefix | Locked to [output directory] / 22_peaks_processing | |
| -go | Output directory for HOMER genome ontology analyses | Mandatory for subsequent processes | |
| fold_change_ calculator |
--thread | Number of threads that will be used to run this | Determined by ChIP-AP –thread |
| --input_tsv | Path to input peak list | Locked to [output directory] / 22_peaks_processing / [setname]_all_peaks_annotated.tsv | |
| --output_tsv | Path to output peak list | Locked to [output directory] / 22_peaks_processing / [setname]_all_peaks_calculated.tsv | |
| --chip_bam | Sequencing data input/output | Locked by ChIP-AP file naming and pathing | |
| --ctrl_bam | Sequencing data input/output | Locked by ChIP-AP file naming and pathing | |
| --peak | Sample peak type | Determined by ChIP-AP --peak | |
| HOMER findMotifsGenome |
-p | Number of threads that will be used to run this | Determined by ChIP-AP –thread |
| -dumpFasta | Flag to include fasta files of the analyzed sequences in the output | Locked on; useful but not mandatory for subsequent processes for now | |
| MEME meme-chip |
-oc | Path to output folder | Locked by ChIP-AP file naming and pathing |
| -neg | Path to background sequences fasta | Locked by ChIP-AP file naming and pathing | |
| -meme-p | Number of threads that will be used to run this | Determined by ChIP-AP –thread |
hg19, hg38, mm9, mm10, and dm6 effective genome size are derived from: https://deeptools.readthedocs.io/en/develop/content/feature/effectiveGenomeSize.html
hg19_effective_genome_size = '2864785220'
hg38_effective_genome_size = '2913022398'
mm9_effective_genome_size = '2620345972'
mm10_effective_genome_size = '2652783500'
dm6_effective_genome_size = '142573017'
The sacCer3 effective genome size was manually calculated based on the number of non-N characters in the genome's FASTA file. sacCer3_effective_genome_size = '12071326'
For transcription factor samples (narrow peaks), ChIP weighted peak center coordinate is determined by the median coordinate of all reads in the peak region. Fold change was then calculated as read depth in ChIP sample divided by non-zero read depth of control sample at the weighted peak center coordinate.
For histone modifier samples (broad peak type), fold change was simply calculated based on average read depth in ChIP sample, divided by non-zero average read depth of control sample, along the same peak region.
To correct for read depth discrepancies due to imbalanced number of reads between ChIP and control samples, ChIP-AP uses one of three available normalization factors depending on the commandline flag specified:
- (Default) Based on only uniquely mapped reads in ChIP vs control bam files (filtered using samtools view -F256 and counted using samtools view -c)
- Based on only successfully mapped reads in ChIP vs control bam files (filtered using samtools view -F4 and counted using samtools view -c)
- Based on user-determined value.
Advanced users may choose to change this by changing the argument field for fold_change_calculator in the settings table as follows:
- --normfactor uniquely_mapped
- Default - based on uniquely mapped reads; default setting
- --normfactor mapped
- change to all mapped reads
- --normfactor user_value --chip_norm [x] --ctrl_norm [y]
- change to user-determined normalization factor, where x / y is the user-determined ratio of the number of ChIP reads to the number of control reads
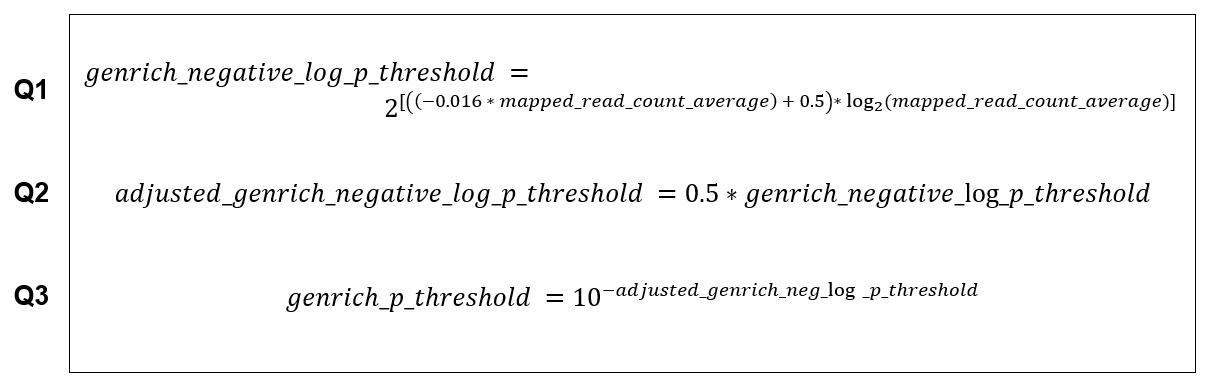
Based on our testing, Genrich tends to misbehave when processing datasets with low read depth. It starts to call low enrichment regions as peaks, leaving users with an impossibly large number of called peaks. We contacted the developer of Genrich and confirmed such behavior with them. Through our testing, we derived equations that allow us to curtail Genrich’s aberrant behavior in such scenarios. This adjustment is performed and derived by us and is not attributed to Genrich and/or its developer(s).
To avoid the aforementioned peak calling depth issue, we curtail such behavior by setting up an auto-adjusting p value threshold that responsively raises the default limit of peak’s minimum p value as the read depth gets lower using the following equations Q1, Q2, Q3.
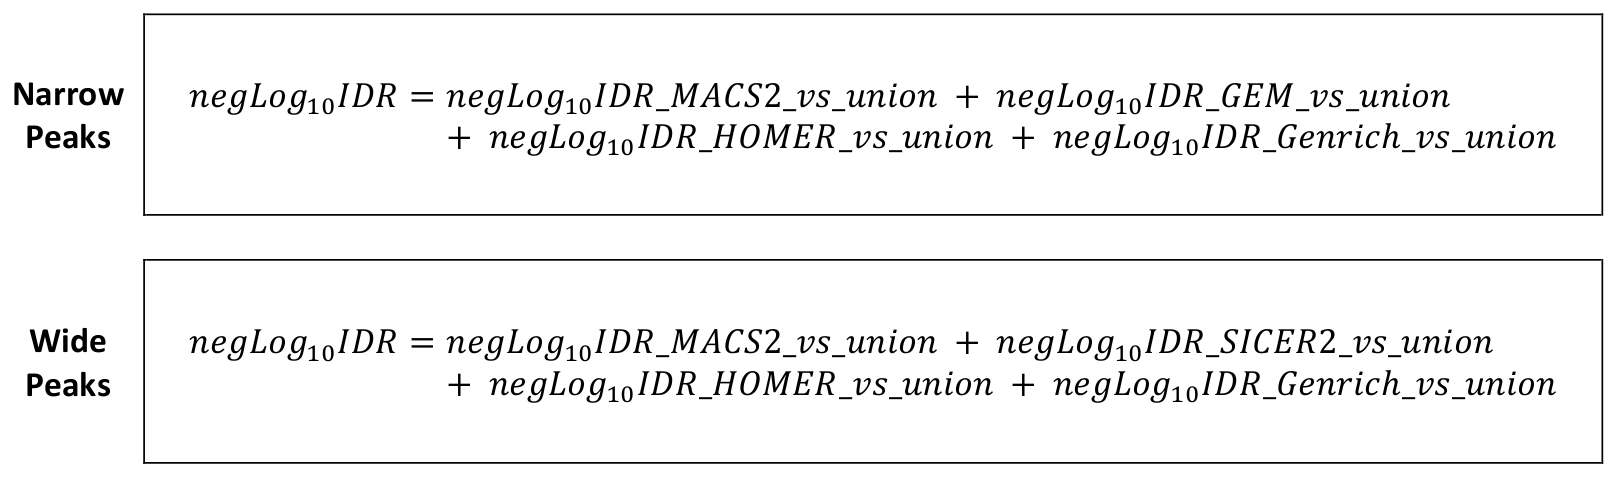
The irreproducible discovery rate (IDR) calculations for all peaks are integrated into a ChIP AP run. As the IDR suite calculate peak reproducibility rate between two replicates (i.e., peak sets) only, we chose as “replicates” each individual peak caller set and the union peak set. The output full peak list (union peak set) is ranked by number of detecting peak callers and fold change of sample signal over input, whereas the individual peak caller sets are ranked by peak score (or fold change if peak score is not available).
Reproducibility of all peaks in the output full peak list are calculated based on their detectability by different individual peak callers, and ranked accordingly. These four -log IDR values are copied into the output full peak list, providing four -log IDR values for every peak, which are then summed and converted into a final IDR value.
Ok so ChIP-AP does report a fair amount of stuff. If you ran it locally you have a swath of folders and you have nooooo clue what to look for and its all confusing. We get that. The reality though its very simple to know what to look for to know your experimental run worked and in this section were going to walk you through that!
There are a couple of things to look for to answer this question. 1, the fingerprint plot and 2, the venn diagram of the merged peaks. Let's begin…
-
The Fingerprint Plot
The fingerprint plot tells us how well the enrichment of your samples worked. It is generated by the function from the deeptools package and is generated after the alignment files. As such, the plots are found in the “08_results” folder and are labelled “fingerprint_xxxxx.png/svg.” The PNG files allow you to view them in any image viewer, the SVG files are for opening in Adobe Illustrator or Inkscape to make HQ publication figures later if you need.
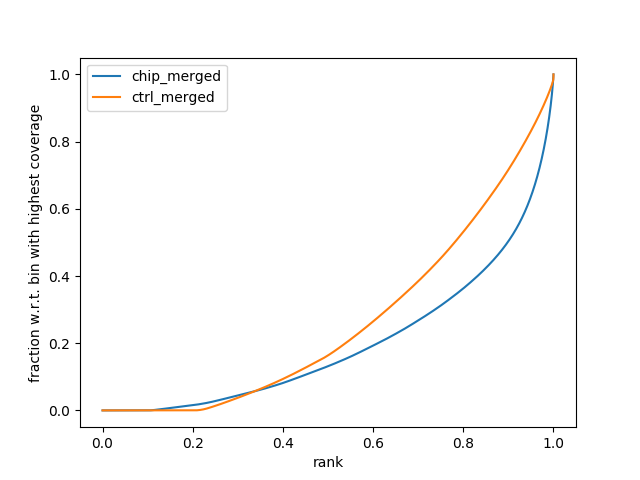
To interpret the fingerprint plot, (more information can be found on the deeptools documentation site), but put simply, the input control should be a diagonal line as close as possible toward the 1:1 diagonal. Your ChIP sample should have a bend/kink towards the bottom right corner. The greater the separation between the input and the chip sample, the greater the enrichment you will see in the final result (i.e., lots of peaks). If the lines are overlapping, then you will see little enrichment and your experiment didn’t work that well. If you’re sample lines are switched – then you probably switched the sample names and we recommend doing the right thing and repeating the experiment and not simply switch sample names for the sake of a publication.
In this example, there is reasonable enrichment in our chip samples. And so we are confident we can see enrichment.
-
The Venn Diagram (well Venn Text)
In the folder “21_peaks_merging” folder, you will find the “venn.txt” file. This will show you a textual venn diagram of the overlap between the called peaks across all peak callers. To know your experiment worked well, you should see a full list with combinations of all peak callers and relatively large numbers for the consensus peak sets (ie peaks called by multiple peak callers) – this is the ideal case. However, from our experience, there will almost always be 1, maybe 2 peak callers that don’t like a dataset for some reason and so you may find a peak caller performed poorly but the others performed admirably. This is still a good and valid result.
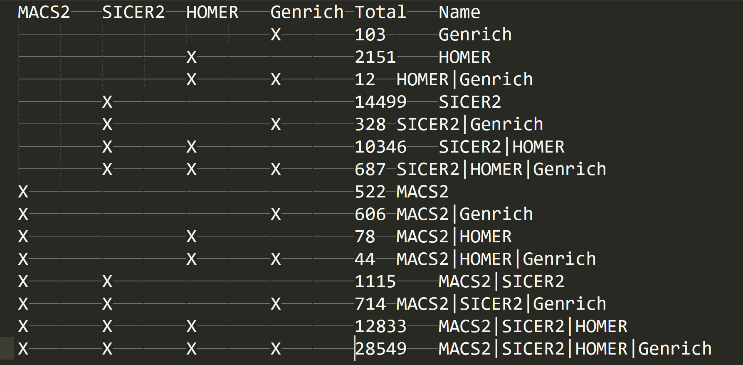
If you look at this file and only see small number of peaks and little overlap, and only 1 peak caller seems to have dominated peak calling, then likely your experiment didn’t work that great. Just because only 1 peak caller performed well though, doesn’t mean the experiment is a write-off and a failure. It can still be valid and so doing some manual validations on the top fold-change differential peaks by chip-PCR might give you an indication whether there is salvageable data or not. Also if you have other confirmatory experimental evidence then even 1 peak caller getting results is fine. This is why we implemented multiple peak callers, because there are many instances where the signal:noise just creates a mess for most peak callers but generally 1 will be the super-hero of the day in such a situation.
-
What Results Files Do I Look At Exactly?
Valid question. In the folder “22_peak_processing,” open the “xxxx_all_peaks_calculated.tsv” file in excel and you’re good to go. Now to open it there is a little step to do…
Open a new blank workbook in excel

In the ribbon at the top, go to “Data”, then select “From Text/CSV”

In the dialog box that opens up, find and open the peaks files “xxxx_all_peaks_calculated.tsv.” Follow all the prompts and keep pressing “Next” / “Proceed” till the end and the file opens. Opening the peak file this way circumvents an issue that Excel constantly makes which is it will interpret some gene names such as OCT1 as a date, when its not. So by following the aforementioned steps, excel will not do this stupid conversion and instead, when you save the file as an xlsx, it will ensure that this issue doesn’t happen (seen it in sooooo many publications its not funny – just import data this way please people?)
From this file, you can view all the results and data for you analysis. Refer to Interpreting ChIP-AP Output for the definition of what each column means.
-
How Do I View My Alignments And Data?
People typically want to view their results on UCSC or other genome browsers. As we don’t have a web-server to host such coverage files (and making accessible ucsc hub is a real pain and we don’t want to implement that), the onus is on you to view them locally on your machine. All laptops, whether then can run ChIP-AP or not can run IGV Downloads | Integrative Genomics Viewer (broadinstitute.org) and view the coverage and bam files. The coverage and bam failes can be located in the “08_results” folder.
Download IGV, install it (super easy) and then load the coverage and bam files needed. Make sure you load the right genome build however! That’s critical. From section Main Pipeline Output, you can copy columns B,C,D straight into IGV and it will take you to the peak section.
-
In Short, What's Relevant?
Easy answers-
Check fingerprint plot and make sure it looks good
-
Check venn.txt file and make sure you get good spread of peaks Together points 1 and 2 tell you your experiment worked!
-
Your final peak file is in “22_peak_processing” open the “xxxx_all_peaks_calculated.tsv” – This is the file you need to upload to GEO as your processed data file for your analysis and the only file you need to work with when looking through your data.
-
Also as part of your submission to GEO or as a supplemental table in your manuscript, you MUST include the settings table named “default_settings_table.txt” located in the root analysis directory. This provided with the raw fq files, which must be uploaded to GEO, will ensure complete reproducibility of the analysis performed.
-
Manuscript details for M&M. A statement such as the following should suffice:
For processing our ChIP-Seq analysis, we utilized ChIP-AP (https://academic.oup.com/bib/advance-article/doi/10.1093/bib/bbab537/6489109). Raw fq files are uploaded to GEO with accession number GSE172355, and the custom settings table utilized for analysis can be found on GEO as a processed settings file and also in Table 1 in our manuscript. Full details of ChIP-AP and its function can be found in its corresponding manuscript (https://academic.oup.com/bib/advance-article/doi/10.1093/bib/bbab537/6489109).
-
-
Q – What does ChIP-AP stand for?
A – ChIP-Seq Analysis Pipeline -
Q – What should I use as my control? Input or IgG?
A – The consensually accepted control to be used for ChIP-Seq experiments is input control and not IgG. You’re free to do so if you wish but that’s not whats commonly done in the literature. Take a look at consortia such as ENCODE and you won’t find IgG controls, only input. -
Q – How are peaks called? In what order?
A – Peaks are called as your ChIP-IP over Input control. -
Q – Can ChIP-AP handle an un-balanced number of replicates? (ie 3 ChIP and 1 input?)
A – Yes it can. The initial QC and cleanup steps are done on a per replicate basis, but after the alignment step, samples are merged and the remaining peak-calling, annotation, FC calculations etc… are done on the merged sample sets. -
Q – I’ve only input 1 sample ChIP and 1 Input control, why are there “_merged” files in the output directories?
A – Yeah… ideally ChIP-AP shouldn’t do this and we’re aware of this behaviour. The contents of the single replicate file and the merged are the same though so theres not really an issue which file you refer to as long as you’re consistent. We will address this small issue in future updates. -
Q – Why are you using BWA instead of other aligners such as Bowtie2?
A – BWA is used in preference to other aligners such as Bowtie2 as in benchmarking papers such as (Thankaswamy-Kosalai et al., 2017) and others, we were more statisfied with the results and performance of BWA over others, hence its inclusion in this pipeline. Personal preference ppl. -
Q – Can ChIP-AP handle bam files from other aligners as input, or only BWA?
A – Technically it should be able to handle alignment bam files from any aligner provided the files are formatted correctly. We have not tested it thoroughly though, but should still be fine. If there are issues let us know through the githib and we can work together to resolve such matters. -
Q – I have developed this incredibly awesome new peak caller called Peak2DaMax, can it be incorporated into ChIP-AP?
A – Owing to the modular nature of ChIP-AP, it is realtively easy for additional programs to be added/removed if need be. You can attempt to modify the source files to get this working and reach out if you have any issues. As for officially including it into ChIP-AP… Reach out to us and we can zoom. -
Q – Can ChIP-AP be setup on a shared computing cluster?
A – Technically yes it can. Have we done it? Yes (and no, we have access to 2 clusters, we’ve set it up on 1 and not the other yet). Was the installation more involved? Yes. Every shared computing cluster has its own configuration in terms of available software and personal profile configuration requirements. Its too difficult for us to do every possible combination in advance. Refer to the References and Citations section to see what programs need to be installed/available to for ChIP-AP to run and setup your environment accordingly to access those programs. ChIP-AP will also run a pre-flight check before each run to ensure everything is available and accessible. So check the logs to make sure ChIP-AP is happy and then you will be ok. If unfamiliar with working in said environments, contact the required IT support for the shared cluster to help you. -
Q – The installer script downloads genomes for which I’m never going to use (like fly), what gives? Why cant I chose what to install?
A – We have tried to streamline the installation as much as possible so we just install everything by default. Maybe in the future we will go through and make a more thorough installer with more fine-grained options but for now this is how it is. You can modify the installer script if you are savy enough to remove those commands – that’s up to you. This is why we provide all the code used for everything, so you can tinker with the pipeline how you want. If you break it though… The other option is wait till everything installs and then delete what you don’t want – the HOMER install directories are quite large for sure.For now its an all or nothing installer. Future updates should address being able to add/remove aspects of the installation without having to wipe the slate clean and start over. For a 1st release though, we are happy with this behaviour for now.
-
Q – If I get ChIP-AP working on my institutes computing cluster SuperUltraMegaVoltron, can you include the guide on the wiki?
A – If you’re computing cluster is called SuperUltraMegaVoltron then most certainly YES we can work together to get your installation guide up on the wiki simply to say we have it working on SuperUltraMegaVoltron (but does it have a V-MAX option??). Even if It doesn’t have an exciting name as that and is simply called BigPuddle, we will still work with you to get the installation guide up on the wiki. We want ChIP-AP to become the go-to tool for analyses. So we will work towards that goal with anyone who is willing to help and collaborate. -
Q – Is there a difference in the output between the GUI and command line versions of ChIP-AP?
A – Nope! We have designed ChIP-AP to be just as functional from the GUI or command line. Any feature accessible on the command line is also accessible from the GUI. However, with great power comes great responsibility! If you modify the settings table without knowing what you’re doing you will break the pipeline run and get wrong results.This option, while available for modification in the GUI, really is intended for the most advanced of users. Even most “bioinformaticians” wont know how to take full advantage of this functionality and will break the pipeline more times than improving its efficiency. So, the ability is there, but don’t use it unless you REALLLLLYYYYY know what you’re doing. This really goes for everyone, biologist or bioinformatician.
-
Q – What versions of Python are compatible?
A – From our testing, python3 is required, ChIP-AP is not compatible with python2. However, we have also noted that on macOS in particular, python 3.7.x is required and ChIP-AP will not work with python 3.8.x. This is because of how multi-processing is handled in 3.8 on macOS in particular. This doesn’t appear to be an issue in our usage with Linux based installations though.
Version 4.1
- Published version of ChIP-AP. First version to be released on GitHub.
Version 5.0
- Second version to be released on GitHub.
- Peak type "unsure" is now available as an optional argument for the --peak flag.
- When peak type is "unsure", ChIP-AP will run twice, sequentially, not altogether.
- First run with narrow peak type settings. Second run with broad peak type settings.
- Results and other files will be stored in folder [setname]_narrow and [setname]_broad
- The same settings table will be used for both runs.
- Motif enrichment analysis by HOMER and MEME are now integrated into ChIP-AP.
- ChIP-AP now is able to run motif enrichment analysis based on the consensus and/or union sets of the detected peaks
- HOMER's findMotifsGenome.pl module performs the first motif enrichment analysis
- Only available when processing narrow peaks dataset (--peak narrow)
- Will be performed when user includes --homer_motif [consensus/union/both] flag argument in ChIP-AP command line
- The results will be stored in a new folder 24_homer_motif_enrichment
- MEME's meme-chip module performs the second motif enrichment analysis
- Only available when processing narrow peaks dataset (--peak narrow)
- Will be performed when user includes --meme_motif [consensus/union/both] flag argument in ChIP-AP command line
- The results will be stored in a new folder 25_meme_motif_enrichment
- fold_change_calculator_suite_3.0.py replaces fold_change_calculator_suite_2.1.py
- Now adds each replicate's peak center coordinate into the resulting file: setname_all_peaks_calculated.tsv
- Weighted peak center coordinate for narrow peak type, and simply peak mid-point coordinate for broad peak type
- Weighted peak center coordinate value is needed for the new script meme_sequence_extractor_5.0.py
- A home-made script meme_sequence_extractor_5.0.py is added into the pipeline
- Needed for automated preparation of meme-chip FASTA-formatted target and background inputs
- Recognizes and processes multiple replicates separately (based on each weighted peak center coordinate). meme-chip then follows up by processing each replicate separately, generating respective results for each replicate
- Only when ChIP and control aligned reads (.bam) are not merged or force-merged
- chipap_dashboard_2.0.py replaces the older chipap_dashboard.py (1.0)
- Now supports unsure peak type
- Now supports motif enrichment analysis by HOMER and MEME
- Now supports real time detection of manually typed-in sample table, settings table, and known motifs file
- chipap_wizard_2.0.py replaces the older chipap_wizard.py (1.0)
- Now supports unsure peak type
- Now supports motif enrichment analysis by HOMER and MEME
- Now supports real time detection of manually typed-in sample table, settings table, and known motifs file
- A few minor tweaks on the data inputting flow
- For consistencies in codes between different versions of scripts, versions are removed from script file name. Additionally, the wording "suite" in several scripts does not really make sense, so we removed them.
- chipap_v5.0.py --> chipap.py
- Genrich_1.0.py --> Genrich.py
- fold_change_calculator_suite_3.0.py --> fold_change_calculator.py
- meme_sequence_extractor_5.0.py --> meme_sequence_extractor.py
- GO_annotate_suite_1.1.py --> GO_annotator.py
- pathway_annotate_suite_1.1.py --> pathway_annotator.py
- peak_caller_stats_suite.py --> peak_caller_stats_calculator.py
- chipap_dashboard_2.0.py --> chipap_dashboard.py
- chipap_wizard_2.0.py --> chipap_wizard.py
- File default_settings_table has been renamed to default_settings_table.tsv
- To better reflect its table format
- Software update check implemented at the beginning of pipeline.
- Informing users of newer version of ChIP-AP script(s) available on GitHub.
Version 5.1
- Third version to be released on GitHub
- Peak reproducibility (IDR) calculations are now intergrated into ChIP-AP pipeline
- Using the IDR module, calculates IDR value of each peak in the full peak list: dataset_name_all_peaks_calculated.tsv
- Reads aligned chr_alt, chr_fix, chrN_random, chrUn, and chrM in externally aligned .bam files are now properly filtered out
Version 5.2
- Fourth version to be released on GitHub
- ChIP-AP is now published in Briefings in Bioinformatics! Check our paper to get more insight on how it can be very useful for your ChIP-seq!
- Fixed a bug in GEM peak caller where ChIP and control files flags and arguments sometimes are buggy when multiple replicates are involved
- 'overwrite=t' is added to bbduk.sh command line to allow overwriting if any of its output file already exist
- Fixed a bug in script Genrich.py where ChIP and control files flags and arguments sometimes are buggy when -adjustp flag is not in use
Version 5.3
- Fifth version to be released on GitHub
- Fixed issue where GEM was given a non-integer value for its -t flag argument
Version 5.4
- Sixth version to be released on GitHub
- --fcmerge flag will now automatically be activated when the number of ChIP samples are unequal to control samples without requiring any user prompt.
- chipap_installer.py now works for anaconda installed under a different parent directory
name other than “anaconda3”
- Upon not finding “anaconda3” parent directory name, the installer will attempt to recognize the actual parent directory name, in which file bin/conda is located.
- As a failsafe measure, upon still being unable to find anaconda parent directory, the installer will prompt the user to manually key in the full path to anaconda parent directory, before proceeding with the installation.
- The .yaml files for ChIP-AP installation have been updated
- The R version the line “r-base=3.2.2=0” trying to install cannot be found anymore in
anaconda. To fix this issue, and possibly similar issues in the future, the line has now
been simplified to be able to flexibly find and install any compatible R version:
- “r-base=3.2.2=0” changed to “r”
- The R version the line “r-base=3.2.2=0” trying to install cannot be found anymore in
anaconda. To fix this issue, and possibly similar issues in the future, the line has now
been simplified to be able to flexibly find and install any compatible R version:
- default_settings_table.tsv has been updated
- Due to the prevalence of Illumina NGS in the field, the default arguments for adapter
trimming by BBDuk has been changed to better trim read-through adapter sequences
at the 3’ end of reads:
- “ktrim=l hdist=2” changed to “ktrim=r k=21 mink=8 hdist=2 hdist2=1”
- Due to the prevalence of Illumina NGS in the field, the default arguments for adapter
trimming by BBDuk has been changed to better trim read-through adapter sequences
at the 3’ end of reads:
You can find all the details of every individual program through the links provided in the table below. Reading these is strongly recommended if you plan to modify ChIP-AP default settings.
Lastly, if you use ChIP-AP in your analysis, please cite us and all the following programs.