Code Engine Monitoring: Create Dashboard - IraAngeles-sw-dev/IBM-Cloud-resources GitHub Wiki
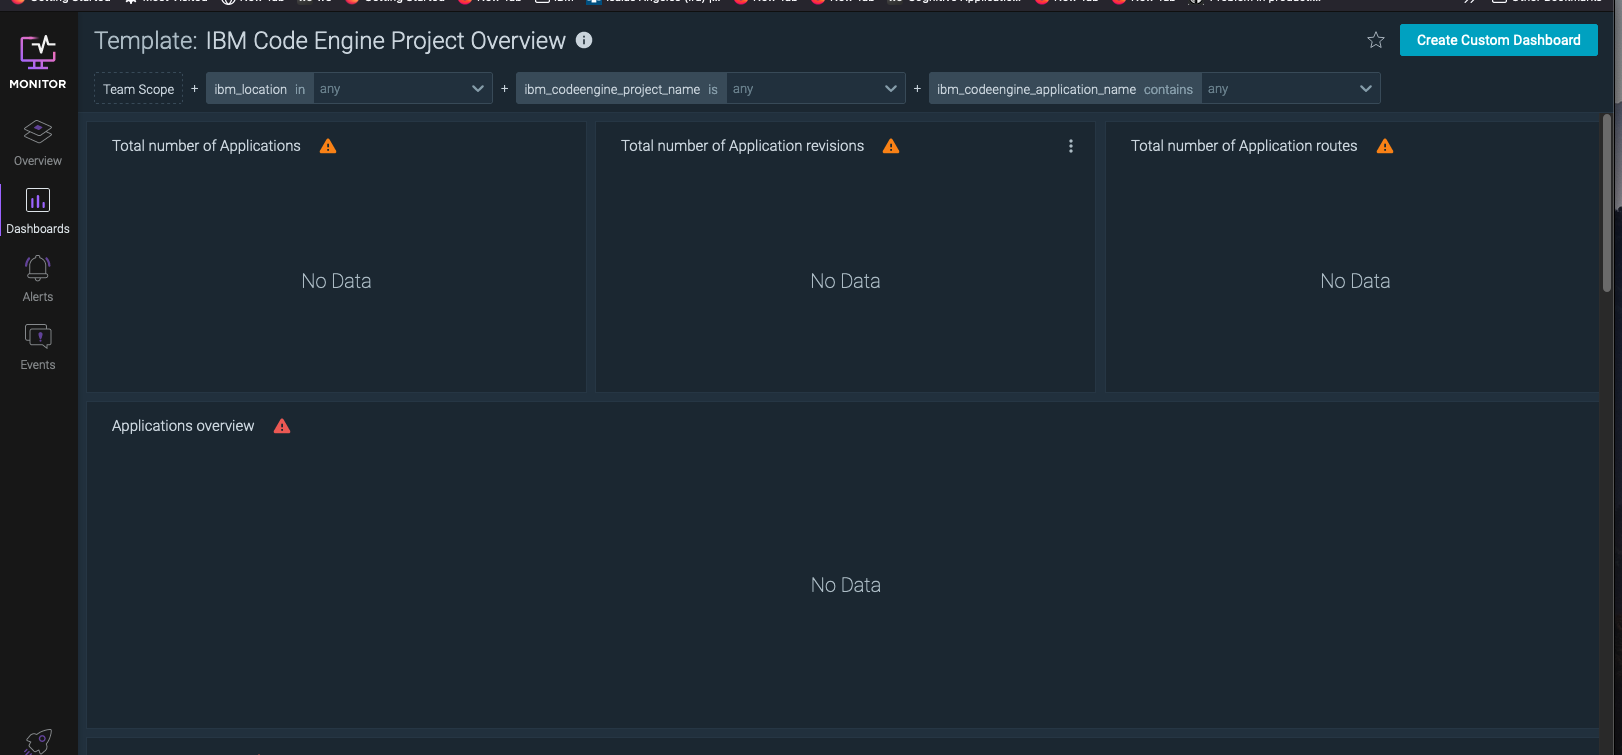
1. Launch IBM Cloud monitoring from Code Engine and click on the Create Custom Dashboard at the upper right hand menu
![monitor_dashboard.png](https://raw.githubusercontent.com/IraAngeles-IBM/IBM-Cloud-resources/main/images/monitor_dashboard.png)
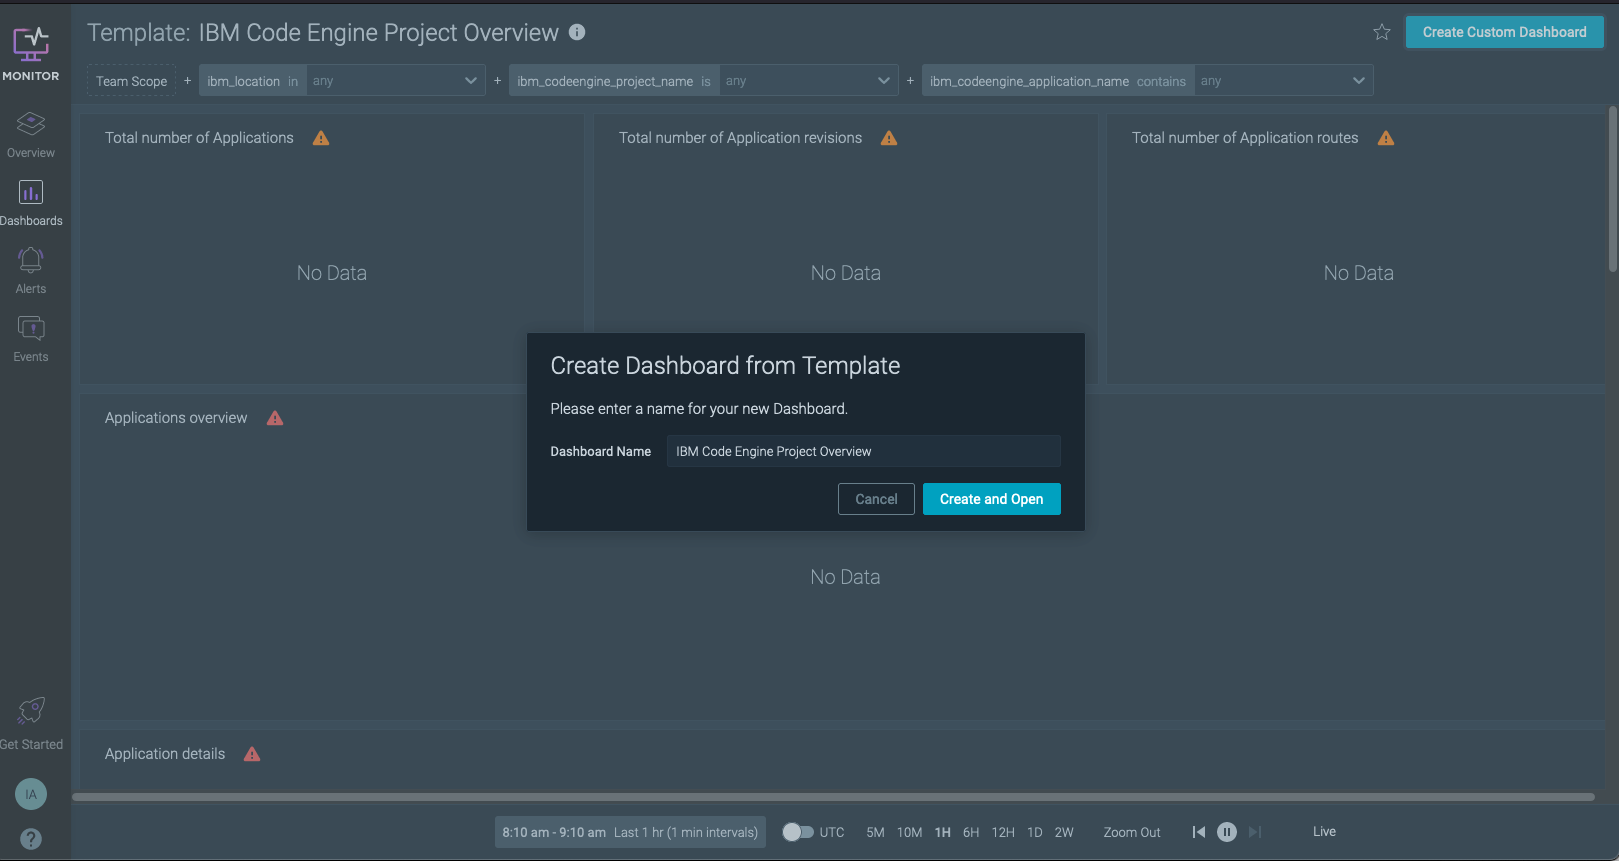
2. In the Create Dashboard from Template, enter preferred Dashboard Name or use default name
![monitor_create.png](https://raw.githubusercontent.com/IraAngeles-IBM/IBM-Cloud-resources/main/images/monitor_create.png)
3. The dashboard will be created from the template, however, there will be no data until the system initialization has completed
![monitor_dashboard.png](https://github.com/IraAngeles-IBM/IBM-Cloud-resources/raw/main/images/monitor_dashboard.png)
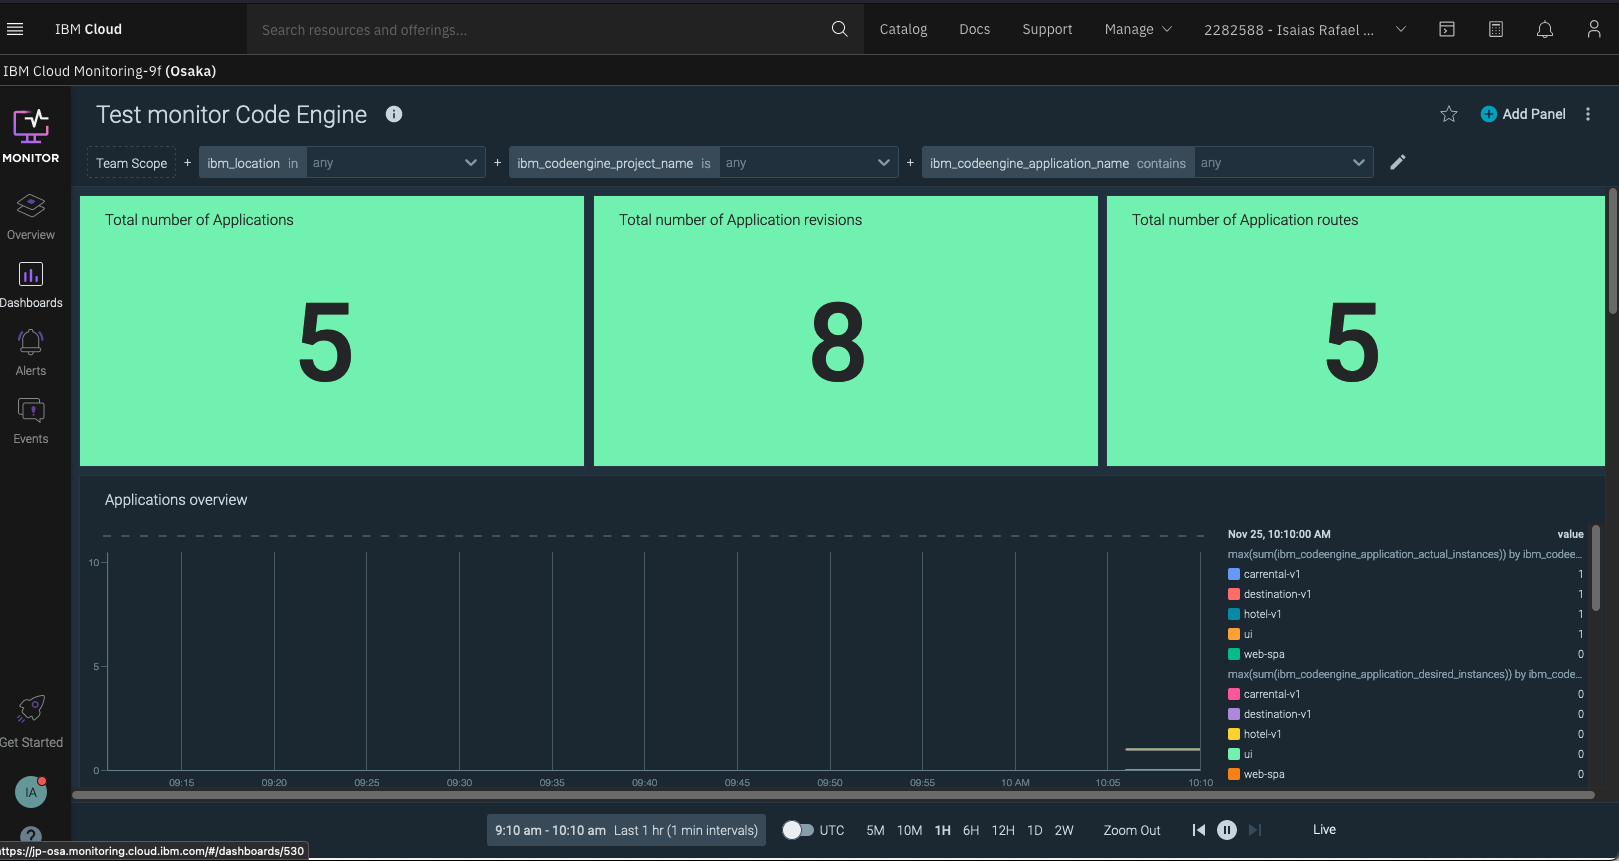
4. After a few minutes, either refresh the browser or open a new window, the dashboard with data will be displayed
![monitor-created-dashboard.png](https://raw.githubusercontent.com/IraAngeles-IBM/IBM-Cloud-resources/main/images/monitor-created-dashboard.png)
5. Select specific project
![monitor-select-project.png](https://github.com/IraAngeles-IBM/IBM-Cloud-resources/raw/main/images/monitor-select-project.png)
6. Select specific application
![monitor-select-application.png](https://github.com/IraAngeles-IBM/IBM-Cloud-resources/raw/main/images/monitor-select-application.png)