Sprint 2 - ISIS3510-grupo/Proyecto GitHub Wiki
Each member of the team is responsible for implementing at least one Business Question (BQ) defined during Sprint 1. For each implemented BQ, this section will include the responsible team member, its type, the implemented analysis, and a brief rationale explaining its relevance to CampusFind.
| Team Member | Business Question | Type | Rationale | Implementation |
|---|---|---|---|---|
| Jhostin | Which app features are used most frequently by students? | Type 3 | Shows which parts of the student app bring value and which ones are ignored, so the team can prioritize, improve or remove features with real usage data. | The Flutter app records a featureUsageEvents event each time a student uses a feature. An hourly Cloud Function aggregates the events per feature (total, last 7 days, by platform) into analytics/featureUsage. |
| Camilo | How does the successful ownership-verification rate differ between reports that include private identifying characteristics and those that do not? | Type 3 | This BQ shows staff whether asking students for private identifying details makes ownership verification more reliable. It supports deciding whether the app should encourage richer private details when a lost item is reported. | The Admin App reads all claims from Firestore and compares each student's private ownership answer with the private characteristics registered for the found item, using a word-overlap matcher. A verification is successful when the match score is at least 60% (LIKELY_MATCH). Claims are grouped by whether the lost report has a private detail document, and the screen shows the success rate of each group and the difference in percentage points. |
| Sofia | What percentage of students review a possible match after receiving a notification? | Type 3 | This business question measures the effectiveness and accuracy of the app's matching system from the student's perspective. In the context of Los Andes University, it evaluates the percentage of students who, upon receiving a notification, confirm that the system's suggested match actually corresponds to the item they reported lost. This metric is essential for validating the quality of the matching algorithm between lost item reports and items logged at the lost and found office, determining how many generated notifications lead to a successful recovery. | The BQ3 implementation uses an event-driven architecture to measure student response to lost-and-found match notifications. When a notification is dispatched, a notification_sent event is logged to the Firestore /analytics collection; when the student taps the notification in NotificationsScreen, a corresponding match_reviewed event is captured. MatchAnalyticsService queries these logs, utilizing Set data structures to eliminate duplicates from repeated taps and calculate the true conversion rate via set intersection, which is then rendered dynamically on the MatchAnalyticsScreen view. |
| Daniel | What is the average response time of the app when searching for possible matches between lost and found item reports? | Type 1 | My Business Question measures the performance of the Smart Lost–Found Matching process from the student’s perspective. This analysis makes it possible to identify how long the application takes to search for possible matches and determine whether that response time is acceptable for the user experience. It also helps evaluate whether the matching process remains responsive as the number of lost and found item reports increases. | This BQ is implemented in the Kotlin application, where the duration of each successful search for possible matches is measured from "SmartMatchingViewModel" using "SystemClock.elapsedRealtime()". The measurement starts before loading the matching configuration, querying Firestore for available found items, and executing the comparison. When the search process finishes successfully, the elapsed time is stored in milliseconds in the "performanceMetrics" collection, using the "match_search" metric and the kotlin platform. Then, "MatchSearchTimeRepository" retrieves the recorded times and calculates their average. Finally, the calculated result is presented to administrative staff as the Average match-search time KPI in the "AdminMatchSearchTimeScreen" view. |
| Emilio | How long does the application take to register a new lost or found item report? | Type 3 | This BQ measures the performance of the report registration process from the moment the validated submission starts until the backend confirms that the report was successfully created. It helps identify whether registering lost or found items is taking too long and whether the experience is consistent for both types of reports | The application uses a performance tracker around the complete report registration operation, including GPS retrieval and the Firestore write. For each successful registration, the system stores the report type and the elapsed time in milliseconds in perfomanceMetrics. These measurements are then aggregated and displayed in the Analytics Dashboard, showing the overall average registration time and separate averages for lost and found reports. |
| Alex | What types of unclaimed items at the end of the semester have the potential for donation to external organizations? | Type 4 | This BQ helps identify unclaimed items that could be donated instead of remaining indefinitely in storage. It supports better inventory management and allows the university to make use of items that are no longer likely to be claimed. | The analysis uses lost-and-found inventory data such as item category, status, date, condition, and whether the item remains unclaimed at the end of the semester. These records are processed through the analytics pipeline to identify categories of items with donation potential. |
The analytics pipeline will describe how data generated by the CampusFind applications is collected, stored, processed, and used to answer the implemented Business Questions.

Figure 1. CampusFind Analytics Pipeline.
The CampusFind analytics pipeline was designed to transform operational data generated by both mobile applications into information that can support the Business Questions defined for Sprint 2.
The pipeline is divided into five stages: Data Sources, Ingestion & Integration, Storage, Computation, and Presentation. This separation allows the system to collect data from both the Kotlin and Flutter applications while keeping a common analytics process based on the shared Firebase backend.
The Data Sources stage includes the main events and entities generated by CampusFind, such as lost-item reports, found items, claims, status-change events, notifications, and performance metrics. These data sources provide the information required to analyze user behavior, process performance, matching results, and item outcomes.
The Ingestion & Integration stage uses Firebase services and the shared Firestore data model to receive and persist information generated by both applications. Authentication and security rules ensure that data is associated with authorized users and that operational and analytics information is accessed according to the corresponding roles.
In the Storage stage, Firestore collections organize the information required by the different Business Questions. Keeping these records in a shared backend allows both mobile implementations to contribute data to the same analytics pipeline.
The Computation stage transforms the stored information into metrics and aggregated results. The pipeline includes analyses related to application performance, process times, matching behavior, user engagement, and item outcomes. Each Business Question is answered using the subset of data and calculations relevant to its objective.
Finally, the Presentation stage exposes the computed results through visualizations and indicators, such as average processing times, report bottlenecks, reviewed matches, and donation potential by item category.
This architecture was selected because it separates operational application logic from analytics processing, while allowing the Business Questions to be answered using consistent data generated by both CampusFind applications. It also makes the pipeline extensible, since new Business Questions can reuse the same stored events and add new computations or visualizations without modifying the main mobile application flows.
What types of unclaimed items at the end of the semester have the potential for donation to external organizations? Alex - BQ Type 4 Answer
Which app features are used most frequently by students? Jhostin - BQ Type 3 Answer
What percentage of students review a possible match after receiving a notification? Sofia - BQ Type 3
How does the successful ownership-verification rate differ between reports that include private identifying characteristics and those that do not? Camilo - BQ Type 3 Answer
What is the average response time of the app when searching for possible matches between lost and found item reports? Daniel- BQ Type 1 Answer
How long does the application take to register a new lost or found item report? Emilio- BQ Type 3 Answer
CampusFind uses two independent mobile implementations that provide the same application functionality: one developed with Flutter/Dart and another developed as a native Android application using Kotlin. Both applications share the same Firebase backend, authentication infrastructure, database model, security rules, and persistent information.
The architectural design is divided into three parts:
- 3.a. Architecture: overall system structure and components
- 3.b. Architecture design: interaction and communication between components
- 3.c. Design patterns and architectural tactics
CampusFind follows the Model-View-ViewModel (MVVM) architectural pattern. The project uses a shared architecture, backend, data model, and application logic organization.
MVVM separates the system into three main responsibilities:
-
View: Displays information, receives user interactions, and renders the state provided by the ViewModel. It includes the student and administrator interfaces such as authentication, reports, matching, inventory, and claims.
-
ViewModel: Manages screen state and coordinates application operations. It communicates with repositories and services and handles states such as loading, success, empty, and error.
-
Model: Contains the domain models, repositories, services, and business logic. It is responsible for accessing persistent data and executing application functionality such as authentication, report management, matching, analytics, and claim processing.
The Model communicates with the system infrastructure, which includes Firebase Authentication, Cloud Firestore, Firebase Storage, device capabilities such as camera, GPS and biometrics, and external services such as Google Maps, email, and SMS.

Figure 2. CampusFind overall architecture using MVVM.
MVVM was selected to separate the user interface from application state, business logic, and data access. This separation improves maintainability and allows each component to evolve independently while keeping a clear communication flow between the interface, application logic, and shared infrastructure.
In the Kotlin application, the user interacts with Jetpack Compose screens, which delegate actions and state management to ViewModels. The ViewModels coordinate the application logic and communicate with repositories or services responsible for accessing Firebase Authentication, Cloud Firestore, device sensors, and external services.
For data that must remain synchronized with the backend, the application uses Firestore listeners. When data changes in Firestore, the corresponding data source or service receives the update and propagates it to the ViewModel. The ViewModel updates its state, causing the Compose UI to recompose automatically.
The general interaction flow is:
- The user performs an action in the View.
- The View delegates the action to a ViewModel.
- The ViewModel communicates with a repository, service, or data source.
- The data layer interacts with Firebase or a device/external service.
- The result is returned or observed by the ViewModel.
- The ViewModel updates the UI state.
- Jetpack Compose renders the updated state.
This communication model is used in flows such as authentication, lost-report visualization, possible-match monitoring, notifications, and location-aware reporting

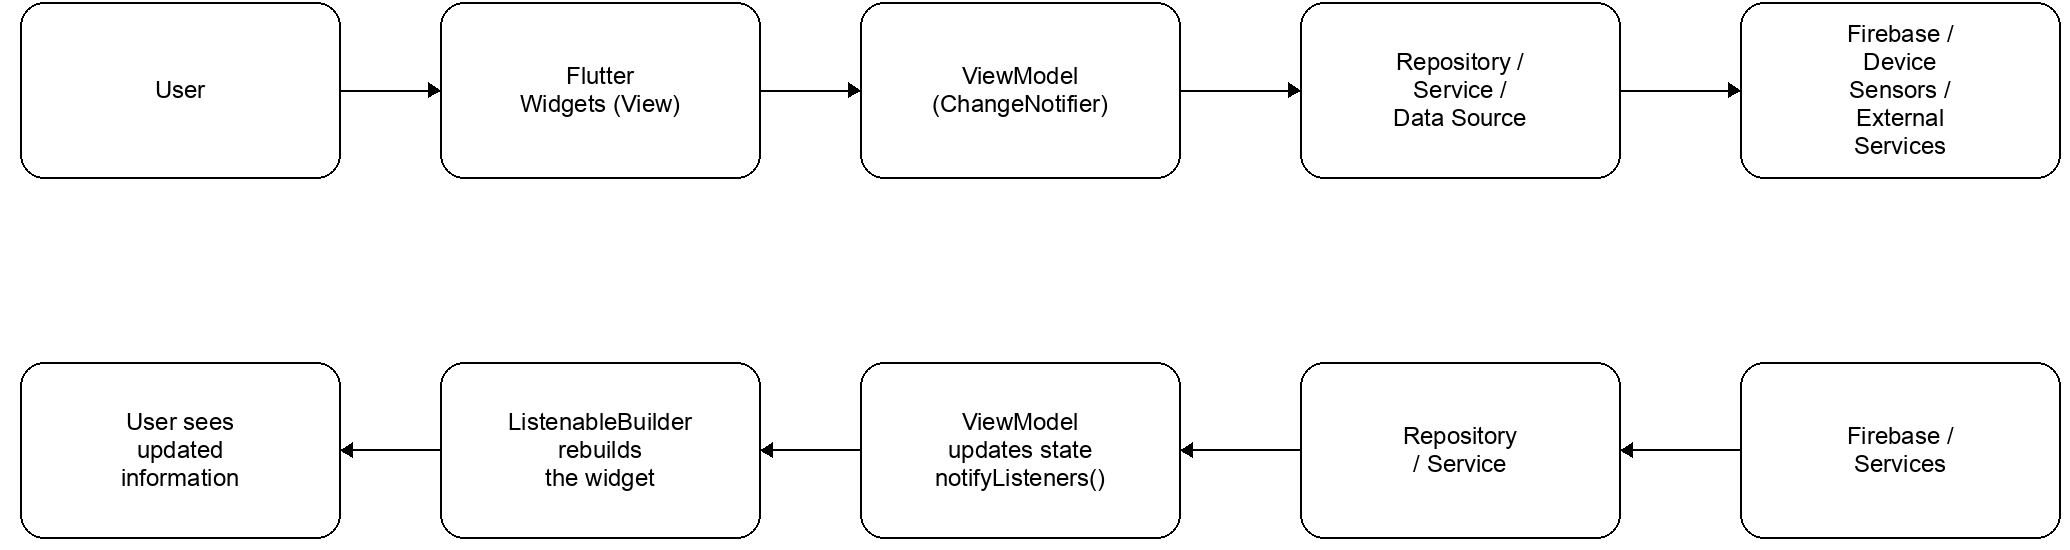
In the Flutter application, the user interacts with Flutter widgets (the View). Widgets do not access Firebase or device APIs directly: they call methods on a ViewModel, implemented as a ChangeNotifier (for example AuthViewModel, HomeViewModel, ReportLostItemController or ClaimFormController). The ViewModel holds the screen state and asks the data layer for what it needs through an interface (LostReportRepository, ClaimRepository, AuthService, the analytics repositories). Only the data layer talks to Firebase Auth, Cloud Firestore, Firebase Storage, the device APIs (camera, GPS, connectivity, biometrics, local storage) and external services such as Google Maps.
Dependencies are passed through constructors, so each ViewModel can be tested with fake repositories instead of Firebase. When a ViewModel changes its state it calls notifyListeners(), and the widget that wraps that part of the screen in a ListenableBuilder rebuilds it.
Most reads are one-time requests that return a Future; screens that must show fresh data (login role check and the feature usage BQ) read with Source.server. The notifications screen uses a Firestore snapshots() stream to update in real time. Two processes run outside the screens: PendingReportSync, started in main.dart, sends the reports saved offline when the connection returns, and the Cloud Functions (aggregateFeatureUsage, every hour, and sendPossibleMatchEmail) react to data written in Firestore without being called by the app.
The general interaction flow is:
- The user performs an action in a widget.
- The widget calls a method of its ViewModel.
- The ViewModel requests data or an operation through a repository or service interface.
- The data layer interacts with Firebase, a device API or an external service.
- The result returns to the ViewModel as a
Future(or aStreamfor real-time data). - The ViewModel updates its state and calls
notifyListeners(). -
ListenableBuilderrebuilds the affected part of the screen.
| Flow | View | ViewModel | Data layer | Source |
|---|---|---|---|---|
| Report lost item | ReportLostItemScreen |
ReportLostItemController |
LostReportRepository |
Firestore, Storage, local offline queue |
| Sign in | LoginScreen |
AuthViewModel |
AuthService |
Firebase Auth, Firestore role, biometrics |
| Home and possible match |
HomeScreen, MatchAlertScreen
|
HomeViewModel |
report repositories, MatchingService
|
Firestore |
| Report with location | ReportItemScreen |
ItemViewModel |
ItemDao |
Firestore, GPS |
| Claim a match | ClaimFormScreen |
ClaimFormController |
ClaimRepository |
Firestore (claims, claimPrivate) |
| Analytics dashboard | AnalyticsDashboardScreen |
one ViewModel per BQ panel | analytics repositories | Firestore (analytics/*) |
The following sequence diagram applies this flow to a concrete case, reporting a lost item, and shows both paths: when the device is online and when the report is saved offline to be sent later.
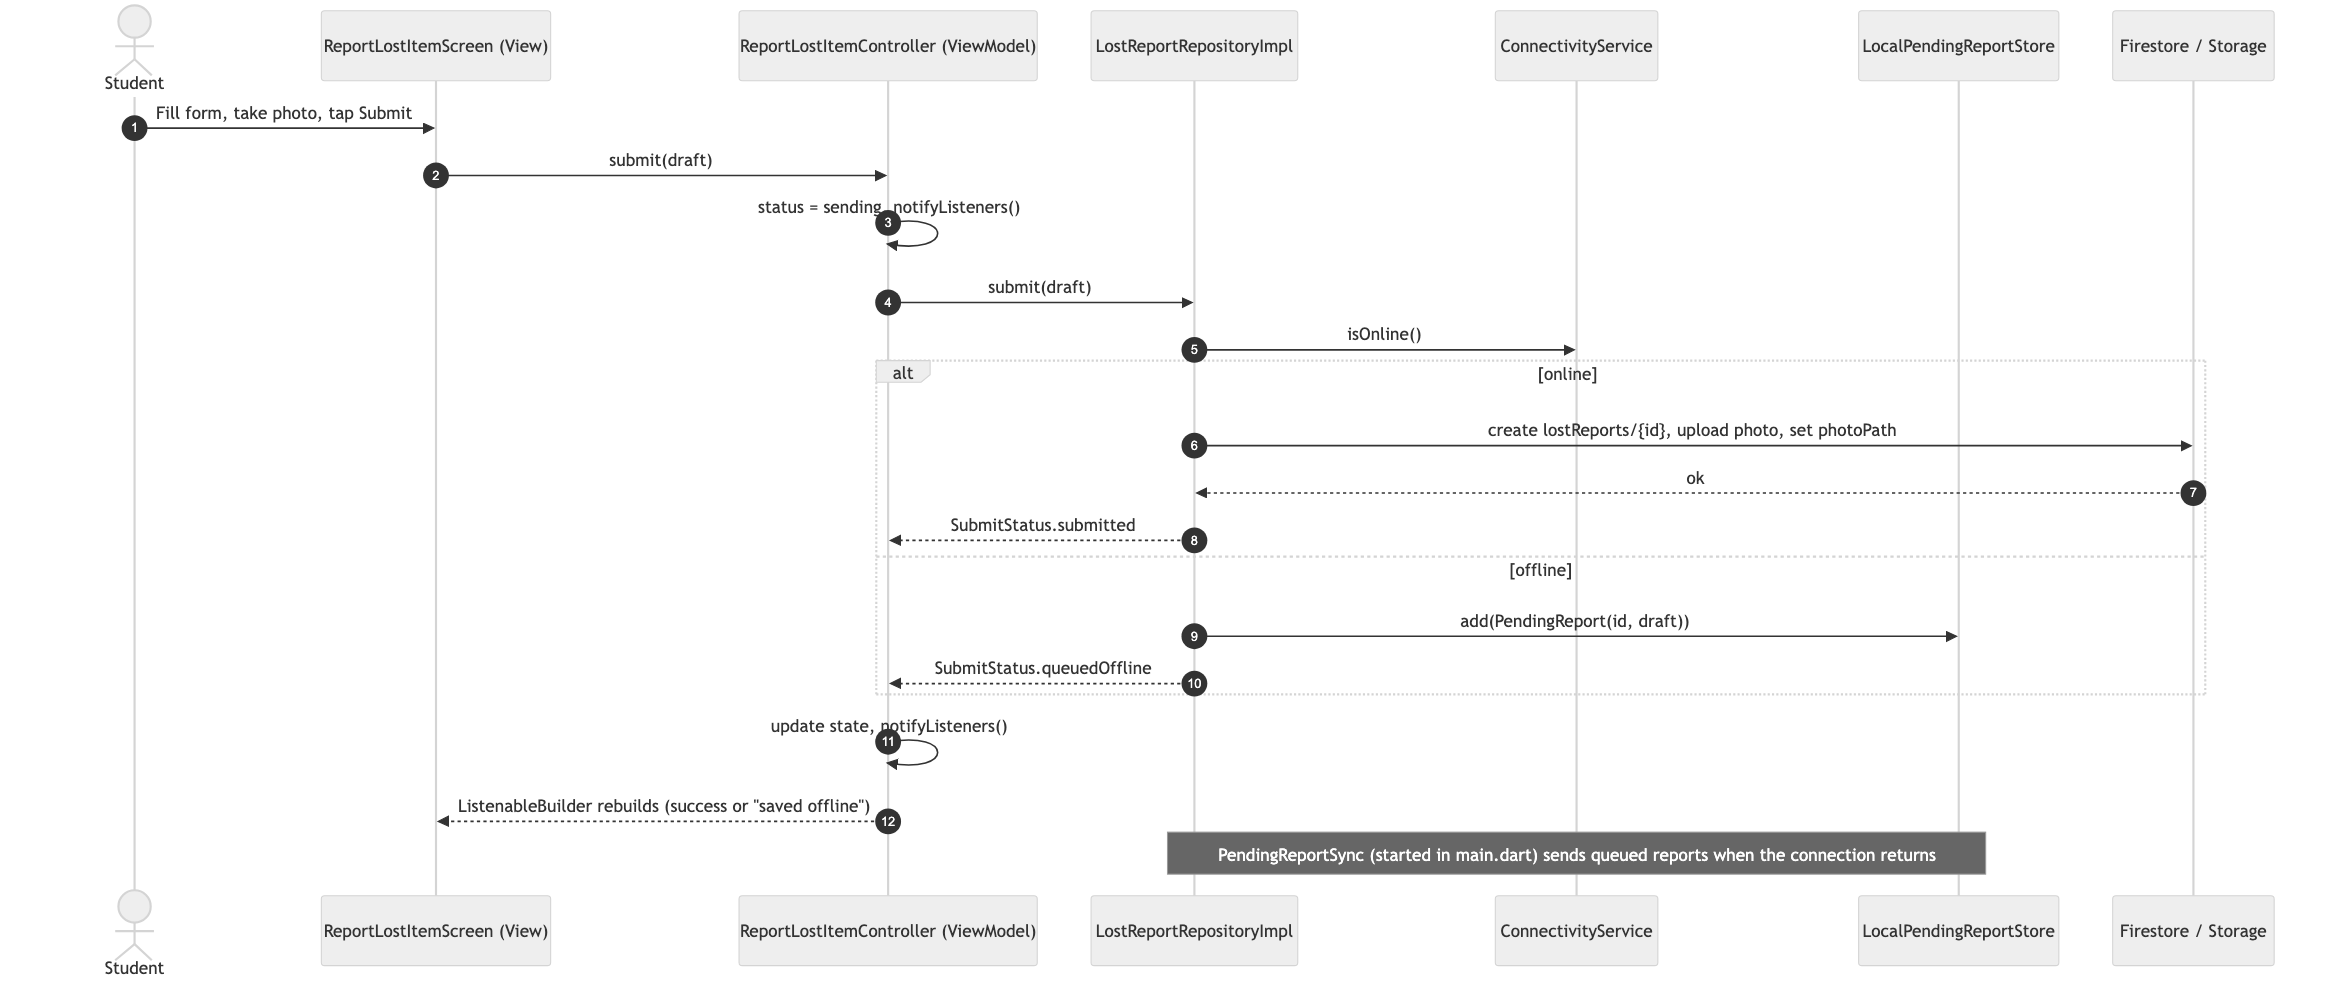
Figure. Sequence of the report lost item flow in Flutter.
Rationale. Keeping widgets free of data access means a screen can change without touching Firebase code, and the data source can change (online, offline queue, cache) without touching the screen. Passing interfaces to the ViewModels lets each flow be tested in isolation, and ListenableBuilder rebuilds only the part of the screen that changed.
The full explanation, diagram, participating classes, and rationale are on Emilio Zea
Implemented in the Flutter lost report feature: the screen and its ViewModel depend only on the LostReportRepository interface, while LostReportRepositoryImpl decides whether a report goes to Firestore, Firebase Storage or the offline queue. The diagram, the participating classes and the rationale are on Jhostin's page.
The full explanation, diagram, participating classes, and rationale are on Alex - Observer
The full explanation, diagram, participating classes, and rationale are on Camilo - Factory
Complete explanation and diagram are on individual page
The full explanation, diagram, participating classes, and rationale are on Daniel- Adapter
| App | Implemented feature | Responsible |
|---|---|---|
| Kotlin | Biometric identity verification | Daniel |
| Kotlin | Smart Lost–Found Matching | Daniel |
| Kotlin | Report Bottleneck analytics visualization | Daniel |
| Kotlin | Drop-off Instructions screen (S12) | Daniel |
| Kotlin | Directions to the Lost & Found location through Google Maps (External Service) | Daniel |
| Kotlin | Average Match-Search Time analytics visualization (Individual BQ) | Daniel |
| Flutter | Student sign-in and session access | Emilio Zea |
| Flutter | Biometric session verification | Emilio Zea |
| Flutter | Active lost report and possible match display on the Home screen | Emilio Zea |
| Flutter | Smart Lost–Found Matching | Emilio Zea |
| Flutter | Possible Match Alert screen (S08) | Emilio Zea |
| Flutter | Staff access to the Analytics Dashboard | Emilio Zea |
| Flutter | Report Bottleneck analytics visualization | Emilio Zea |
| Flutter | Drop-off Instructions screen (S12) | Emilio Zea |
| Flutter | Directions to the Lost & Found location through Google Maps | Emilio Zea |
| Flutter | Report Registration Time analytics visualization | Emilio Zea |
| Kotlin | Student authentication with Uniandes email validation | Alex |
| Kotlin | GPS-based location acquisition for lost-item reporting | Alex |
| Kotlin | Context-aware campus location suggestion | Alex |
| Kotlin | Possible match count per lost report (Type 2 BQ) | Alex |
| Kotlin | Android notification when a new possible match is detected | Alex |
| Backend / External Service/ Kotlin | Email notification infrastructure using Firebase Functions and Resend | Alex |
| Flutter | GPS-based location acquisition for lost-item reporting | Sofia |
| Flutter | Context-aware campus location suggestion | Sofia |
| Flutter | Student authentication with Uniandes email validation | Sofia |
| Flutter | Possible match count per lost report (Type 2 BQ) | Sofia |
| Flutter | Android notification when a new possible match is detected | Sofia |
| Backend / External Service/ Flutter | Email notification infrastructure using Firebase Functions and Resend | Sofia |
| Flutter | Report lost item with optional private verification detail | Jhostin |
| Flutter | Camera photo of the lost item (Sensor) | Jhostin |
| Flutter | Connectivity-aware submission with offline queue (Context-aware) | Jhostin |
| Flutter / Backend | Feature usage events and hourly aggregation (Type 3 BQ) | Jhostin |
| Kotlin | Admin authentication with role validation against Firestore | Camilo |
| Kotlin | Photo capture when registering a found item, uploaded to Firebase Storage and saved as photoPath | Camilo |
| Kotlin | Connectivity-aware registration: found items are saved on the device when offline and sent when the connection returns, without duplicates | Camilo |
| Kotlin | Average time from reported to found, grouped by category (Type 2 BQ) | Camilo |
| Kotlin | Smart claim verification: compares the student's answer with the item's private characteristics | Camilo |
| Kotlin | Private ownership detail stored separately from the public found item | Camilo |
| Kotlin | Ownership verification rate with and without private characteristics (individual BQ) | Camilo |
| Backend / External Service / Kotlin | SMS notification with Twilio, sent by a Cloud Function when a possible match is created (trial account, fixed template) | Camilo |