Level Design - Highvolt/FEUPdemic GitHub Wiki
FEUPdemic features a retro look and feel, and so the levels aren't an exception. The game comes along with a separate module, called SVGMapParser, conceived from the zero in Java, to help with the creation of the levels.
The game was designed with only one level in mind (FEUP seen from above) but the creation of new levels is very simple and unobstructive. It doesn't need programming know-how to create a new level.
A level consists of two layers:
- The first layer is for pure aesthetic purposes only and is placed on the game as the background.
- The second layer represents the clickable areas in the form of polygons.

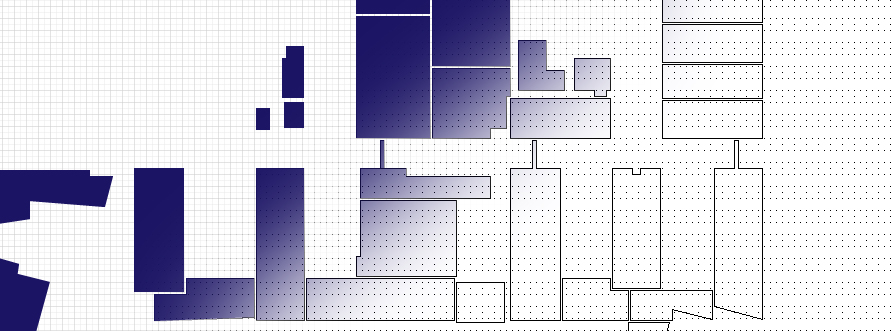
To create a level two resources are needed, each one representing the respective layer previously mentioned.
The background layer is a simple image that must follow simple rules:
- Format: .jpeg
- Width: 667 px
- Height: 640 px
- Style: Seen from above (top view) with a retro appearance (faux 8-bit)
The foreground layer includes only the clickable areas of the level. This areas must be represented by polygons or rectangles in a SVG file. This file is then parsed using SVGMapParser which creates a file with all necessary code to draw the interactive areas of the level.
The rules for the SVG file are the following:
-
Format: .svg with only three allowed types of nodes:
g(group),polygonandrect(rectangle).A group node represents a region (a set of related areas where a area is represented by a polygon or a rectangle). A group must have a unique ID following the format
A<x>, being<x>a number greater than zero. It's worth noting that it's not mandatory to separate the areas in groups but, in that case, all the areas must be grouped in one single group.Polygons and rectangles represent infectable areas and the important aspect of them is their coordinates.
Example of a region composed of five infectable areas: ```
The map may be drawn using any software capable of exporting to SVG (like Adobe Illustrator or Inkscape). After created, the usage of the parser is really straightforward since the only requirement is to provide the SVG file's path and the output path. The parser does the rest and, in the final, a ready-to-run Torque script is generated.
Input - map.svg:
<?xml version="1.0" encoding="utf-8"?>
<!DOCTYPE svg PUBLIC "-//W3C//DTD SVG 1.1//EN" "http://www.w3.org/Graphics/SVG/1.1/DTD/svg11.dtd">
<svg version="1.1" id="picking" xmlns="http://www.w3.org/2000/svg" xmlns:xlink="http://www.w3.org/1999/xlink" x="0px" y="0px"
  width="667px" height="640px" viewBox="0 0 667 640" enable-background="new 0 0 667 640" xml:space="preserve">
<g id="A1">
  <rect x="139" y="285" fill="#1B1464" width="32" height="33"/>
  <polygon fill="#1B1464" points="171,292 188.5,297 187.75,302 203.875,306 193.938,342 167.969,337 176.484,318.25 171,316"/>
  <polygon fill="#1B1464" points="212,346 208,364 162,358 166,339"/>
</g>
<g id="A2">
  <polygon fill="#1B1464" points="172,250 224,250 224,253 235.5,253 231.417,268.5 194,265.5 194,274.5 172,277.833"/>
</g>
<g id="A3">
  <polygon fill="#1B1464" points="213,346 212,352 227,354 228,349"/>
  <polygon fill="#1B1464" points="229,349 252,352 245,403 222,400"/>
  <polygon fill="#1B1464" points="253,352 251,371 276,375 271,407 295,410 302,359"/>
  <polygon fill="#1B1464" points="303,360 301,378 326,382 321,413 344,417 351,366"/>
  <polygon fill="#1B1464" points="352,367 350,385 374,388 370,420 394,424 400,374"/>
  <polygon fill="#1B1464" points="401,341 419,341 412,364 407,364"/>
  <polygon fill="#1B1464" points="416,366 422,368 439,350 422.833,341.5"/>
  <polygon fill="#1B1464" points="441.667,352.5 450.75,369.167 429.375,377 424,373.167 424,369"/>
  <polygon fill="#1B1464" points="399,399 422,404 415,429 438,435 445.596,404.528 450.763,405.105 453,387 401,374"/>
  <polygon fill="#1B1464" points="405,365 415,365 424,369.813 424,374.5 430.5,381.375 405.167,375.042"/>
  <polygon fill="#1B1464" points="454,387 453,405.834 472,411 464,442 486,447.834 496,408 489,405 490.5,396"/>
</g>
</svg>
Output - level.cs:
function createAreas() {
  createArea(1, "0/-178 18;-16 16 16 16 16 -16 -16 -16,1/-149 2;-14 26 4 21 3 16 19 12 9 -24 -17 -19 -8 -0 -14 2,2/-147 -32;25 6 21 -12 -25 -6 -21 13");
  createArea(2, "3/-134 59;-27 11 25 11 25 8 36 8 32 -8 -5 -5 -5 -14 -27 -17");
  createArea(3, "4/-114 -30;-7 4 -8 -2 7 -4 8 1,5/-96 -56;-8 27 15 24 8 -27 -15 -24,6/-53 -57;-27 25 -29 6 -4 2 -9 -30 15 -33 22 18,7/-3 -64;-27 24 -29 6 -4 2 -9 -29 14 -33 21 18,8/46 -72;-27 25 -29 7 -5 4 -9 -28 15 -32 21 18,9/76 -30;-9 9 9 9 2 -14 -3 -14,10/92 -35;-10 -11 -4 -13 13 5 -3 13,11/104 -46;5 14 14 -3 -8 -11 -13 -7 -13 -3,12/93 -81;-28 2 -5 -3 -12 -28 11 -34 19 -3 24 -4 26 14 -26 27,13/82 -52;-10 7 -0 7 9 2 9 -2 15 -9 -10 -3,14/142 -95;-22 28 -23 9 -4 4 -12 -27 10 -33 20 7 13 10 15 19");
}