product - HenrikBengtsson/matrixStats GitHub Wiki
matrixStats: Benchmark report
This report benchmark the performance of product() against alternative methods.
- product_R()
- prod()
where
> product_R <- function(x, na.rm = FALSE, ...) {
+     if (length(x) == 0L)
+         return(0)
+     if (na.rm) {
+         x <- x[!is.na(x)]
+     }
+     if (is.integer(x) && any(x == 0))
+         return(0)
+     sign <- if (sum(x < 0)%%2 == 0)
+         +1     else -1
+     x <- abs(x)
+     x <- log(x)
+     x <- sum(x, na.rm = FALSE)
+     x <- exp(x)
+     y <- sign * x
+     y
+ }> rvector <- function(n, mode = c("logical", "double", "integer"), range = c(-100, +100), na_prob = 0) {
+ mode <- match.arg(mode)
+ if (mode == "logical") {
+ x <- sample(c(FALSE, TRUE), size = n, replace = TRUE)
+ } else {
+ x <- runif(n, min = range[1], max = range[2])
+ }
+ storage.mode(x) <- mode
+ if (na_prob > 0)
+ x[sample(n, size = na_prob * n)] <- NA
+ x
+ }
> rvectors <- function(scale = 10, seed = 1, ...) {
+ set.seed(seed)
+ data <- list()
+ data[[1]] <- rvector(n = scale * 100, ...)
+ data[[2]] <- rvector(n = scale * 1000, ...)
+ data[[3]] <- rvector(n = scale * 10000, ...)
+ data[[4]] <- rvector(n = scale * 1e+05, ...)
+ data[[5]] <- rvector(n = scale * 1e+06, ...)
+ names(data) <- sprintf("n = %d", sapply(data, FUN = length))
+ data
+ }
> data <- rvectors(mode = "double")
> data <- data[1:4]> x <- data[["n = 1000"]]
> gc()
used (Mb) gc trigger (Mb) max used (Mb)
Ncells 3240999 173.1 5709258 305.0 5709258 305.0
Vcells 9545756 72.9 28839795 220.1 87357391 666.5
> stats <- microbenchmark(product = product(x, na.rm = FALSE), product_R = product_R(x, na.rm = FALSE),
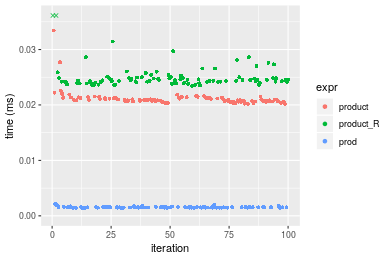
+ prod = prod(x, na.rm = FALSE), unit = "ms")Table: Benchmarking of product(), product_R() and prod() on n = 1000 data. The top panel shows times in milliseconds and the bottom panel shows relative times.
| expr | min | lq | mean | median | uq | max | |
|---|---|---|---|---|---|---|---|
| 3 | prod | 0.001454 | 0.0014800 | 0.0015492 | 0.001526 | 0.001571 | 0.002171 |
| 1 | product | 0.020207 | 0.0206310 | 0.0211301 | 0.020869 | 0.021239 | 0.033423 |
| 2 | product_R | 0.023420 | 0.0240305 | 0.1004694 | 0.024384 | 0.024887 | 7.542430 |
| expr | min | lq | mean | median | uq | max | |
|---|---|---|---|---|---|---|---|
| 3 | prod | 1.00000 | 1.00000 | 1.00000 | 1.00000 | 1.00000 | 1.00000 |
| 1 | product | 13.89752 | 13.93986 | 13.63945 | 13.67562 | 13.51941 | 15.39521 |
| 2 | product_R | 16.10729 | 16.23682 | 64.85288 | 15.97903 | 15.84150 | 3474.17319 |
Figure: Benchmarking of product(), product_R() and prod() on n = 1000 data. Outliers are displayed as crosses. Times are in milliseconds.
> x <- data[["n = 10000"]]
> gc()
          used  (Mb) gc trigger  (Mb) max used  (Mb)
Ncells 3238371 173.0    5709258 305.0  5709258 305.0
Vcells 7340845  56.1   28839795 220.1 87357391 666.5
> stats <- microbenchmark(product = product(x, na.rm = FALSE), product_R = product_R(x, na.rm = FALSE),
+     prod = prod(x, na.rm = FALSE), unit = "ms")
Table: Benchmarking of product(), product_R() and prod() on n = 10000 data. The top panel shows times in milliseconds and the bottom panel shows relative times.
| expr | min | lq | mean | median | uq | max | |
|---|---|---|---|---|---|---|---|
| 1 | product | 0.210217 | 0.2161440 | 0.2177103 | 0.2166890 | 0.2170745 | 0.302627 |
| 2 | product_R | 0.220781 | 0.2260090 | 0.2278485 | 0.2269185 | 0.2283045 | 0.269593 |
| 3 | prod | 0.618741 | 0.6364945 | 0.6391060 | 0.6383845 | 0.6412670 | 0.654995 |
| expr | min | lq | mean | median | uq | max | |
|---|---|---|---|---|---|---|---|
| 1 | product | 1.000000 | 1.000000 | 1.000000 | 1.000000 | 1.000000 | 1.0000000 |
| 2 | product_R | 1.050253 | 1.045641 | 1.046567 | 1.047208 | 1.051733 | 0.8908425 |
| 3 | prod | 2.943344 | 2.944771 | 2.935579 | 2.946086 | 2.954133 | 2.1643641 |
Figure: Benchmarking of product(), product_R() and prod() on n = 10000 data. Outliers are displayed as crosses. Times are in milliseconds.

> x <- data[["n = 100000"]]
> gc()
used (Mb) gc trigger (Mb) max used (Mb)
Ncells 3238443 173.0 5709258 305.0 5709258 305.0
Vcells 7341405 56.1 28839795 220.1 87357391 666.5
> stats <- microbenchmark(product = product(x, na.rm = FALSE), product_R = product_R(x, na.rm = FALSE),
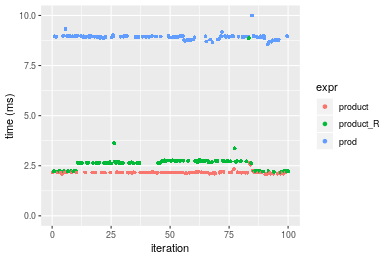
+ prod = prod(x, na.rm = FALSE), unit = "ms")Table: Benchmarking of product(), product_R() and prod() on n = 100000 data. The top panel shows times in milliseconds and the bottom panel shows relative times.
| expr | min | lq | mean | median | uq | max | |
|---|---|---|---|---|---|---|---|
| 1 | product | 2.059192 | 2.158189 | 2.165974 | 2.161252 | 2.164298 | 2.657390 |
| 2 | product_R | 2.165295 | 2.234107 | 2.648095 | 2.646342 | 2.736399 | 8.872142 |
| 3 | prod | 8.558142 | 8.896304 | 8.921136 | 8.938166 | 8.962616 | 9.997612 |
| expr | min | lq | mean | median | uq | max | |
|---|---|---|---|---|---|---|---|
| 1 | product | 1.000000 | 1.000000 | 1.000000 | 1.000000 | 1.000000 | 1.000000 |
| 2 | product_R | 1.051527 | 1.035177 | 1.222588 | 1.224449 | 1.264336 | 3.338668 |
| 3 | prod | 4.156068 | 4.122116 | 4.118763 | 4.135643 | 4.141119 | 3.762192 |
Figure: Benchmarking of product(), product_R() and prod() on n = 100000 data. Outliers are displayed as crosses. Times are in milliseconds.
> x <- data[["n = 1000000"]]
> gc()
          used  (Mb) gc trigger  (Mb) max used  (Mb)
Ncells 3238515 173.0    5709258 305.0  5709258 305.0
Vcells 7341454  56.1   28839795 220.1 87357391 666.5
> stats <- microbenchmark(product = product(x, na.rm = FALSE), product_R = product_R(x, na.rm = FALSE),
+     prod = prod(x, na.rm = FALSE), unit = "ms")
Table: Benchmarking of product(), product_R() and prod() on n = 1000000 data. The top panel shows times in milliseconds and the bottom panel shows relative times.
| expr | min | lq | mean | median | uq | max | |
|---|---|---|---|---|---|---|---|
| 1 | product | 21.19785 | 21.65016 | 21.99446 | 21.79449 | 22.28581 | 24.36656 |
| 2 | product_R | 22.22681 | 22.50587 | 25.34696 | 22.92577 | 28.00132 | 46.10271 |
| 3 | prod | 90.02739 | 91.93805 | 92.09276 | 92.08135 | 92.21465 | 97.15381 |
| expr | min | lq | mean | median | uq | max | |
|---|---|---|---|---|---|---|---|
| 1 | product | 1.000000 | 1.000000 | 1.000000 | 1.000000 | 1.000000 | 1.000000 |
| 2 | product_R | 1.048541 | 1.039524 | 1.152425 | 1.051907 | 1.256464 | 1.892049 |
| 3 | prod | 4.247007 | 4.246529 | 4.187089 | 4.224983 | 4.137819 | 3.987179 |
Figure: Benchmarking of product(), product_R() and prod() on n = 1000000 data. Outliers are displayed as crosses. Times are in milliseconds.

R version 3.6.1 Patched (2019-08-27 r77078)
Platform: x86_64-pc-linux-gnu (64-bit)
Running under: Ubuntu 18.04.3 LTS

Matrix products: default
BLAS:   /home/hb/software/R-devel/R-3-6-branch/lib/R/lib/libRblas.so
LAPACK: /home/hb/software/R-devel/R-3-6-branch/lib/R/lib/libRlapack.so

locale:
 [1] LC_CTYPE=en_US.UTF-8       LC_NUMERIC=C
 [3] LC_TIME=en_US.UTF-8        LC_COLLATE=en_US.UTF-8
 [5] LC_MONETARY=en_US.UTF-8    LC_MESSAGES=en_US.UTF-8
 [7] LC_PAPER=en_US.UTF-8       LC_NAME=C
 [9] LC_ADDRESS=C               LC_TELEPHONE=C
[11] LC_MEASUREMENT=en_US.UTF-8 LC_IDENTIFICATION=C

attached base packages:
[1] stats     graphics  grDevices utils     datasets  methods   base

other attached packages:
[1] microbenchmark_1.4-6    matrixStats_0.55.0-9000 ggplot2_3.2.1
[4] knitr_1.24              R.devices_2.16.0        R.utils_2.9.0
[7] R.oo_1.22.0             R.methodsS3_1.7.1       history_0.0.0-9002

loaded via a namespace (and not attached):
 [1] Biobase_2.45.0       bit64_0.9-7          splines_3.6.1
 [4] network_1.15         assertthat_0.2.1     highr_0.8
 [7] stats4_3.6.1         blob_1.2.0           robustbase_0.93-5
[10] pillar_1.4.2         RSQLite_2.1.2        backports_1.1.4
[13] lattice_0.20-38      glue_1.3.1           digest_0.6.20
[16] colorspace_1.4-1     sandwich_2.5-1       Matrix_1.2-17
[19] XML_3.98-1.20        lpSolve_5.6.13.3     pkgconfig_2.0.2
[22] genefilter_1.66.0    purrr_0.3.2          ergm_3.10.4
[25] xtable_1.8-4         mvtnorm_1.0-11       scales_1.0.0
[28] tibble_2.1.3         annotate_1.62.0      IRanges_2.18.2
[31] TH.data_1.0-10       withr_2.1.2          BiocGenerics_0.30.0
[34] lazyeval_0.2.2       mime_0.7             survival_2.44-1.1
[37] magrittr_1.5         crayon_1.3.4         statnet.common_4.3.0
[40] memoise_1.1.0        laeken_0.5.0         R.cache_0.13.0
[43] MASS_7.3-51.4        R.rsp_0.43.1         tools_3.6.1
[46] multcomp_1.4-10      S4Vectors_0.22.1     trust_0.1-7
[49] munsell_0.5.0        AnnotationDbi_1.46.1 compiler_3.6.1
[52] rlang_0.4.0          grid_3.6.1           RCurl_1.95-4.12
[55] cwhmisc_6.6          rappdirs_0.3.1       labeling_0.3
[58] bitops_1.0-6         base64enc_0.1-3      boot_1.3-23
[61] gtable_0.3.0         codetools_0.2-16     DBI_1.0.0
[64] markdown_1.1         R6_2.4.0             zoo_1.8-6
[67] dplyr_0.8.3          bit_1.1-14           zeallot_0.1.0
[70] parallel_3.6.1       Rcpp_1.0.2           vctrs_0.2.0
[73] DEoptimR_1.0-8       tidyselect_0.2.5     xfun_0.9
[76] coda_0.19-3
Total processing time was 20.36 secs.
To reproduce this report, do:
html <- matrixStats:::benchmark('product')Copyright Henrik Bengtsson. Last updated on 2019-09-10 21:09:22 (-0700 UTC). Powered by RSP.
<script> var link = document.createElement('link'); link.rel = 'icon'; link.href = "data:image/png;base64,iVBORw0KGgoAAAANSUhEUgAAACAAAAAgCAMAAABEpIrGAAAA21BMVEUAAAAAAP8AAP8AAP8AAP8AAP8AAP8AAP8AAP8AAP8AAP8AAP8AAP8AAP8AAP8AAP8AAP8AAP8AAP8AAP8AAP8AAP8AAP8AAP8AAP8AAP8AAP8AAP8AAP8AAP8AAP8AAP8AAP8AAP8AAP8AAP8AAP8AAP8AAP8AAP8AAP8AAP8BAf4CAv0DA/wdHeIeHuEfH+AgIN8hId4lJdomJtknJ9g+PsE/P8BAQL9yco10dIt1dYp3d4h4eIeVlWqWlmmXl2iYmGeZmWabm2Tn5xjo6Bfp6Rb39wj4+Af//wA2M9hbAAAASXRSTlMAAQIJCgsMJSYnKD4/QGRlZmhpamtsbautrrCxuru8y8zN5ebn6Pn6+///////////////////////////////////////////LsUNcQAAAS9JREFUOI29k21XgkAQhVcFytdSMqMETU26UVqGmpaiFbL//xc1cAhhwVNf6n5i5z67M2dmYOyfJZUqlVLhkKucG7cgmUZTybDz6g0iDeq51PUr37Ds2cy2/C9NeES5puDjxuUk1xnToZsg8pfA3avHQ3lLIi7iWRrkv/OYtkScxBIMgDee0ALoyxHQBJ68JLCjOtQIMIANF7QG9G9fNnHvisCHBVMKgSJgiz7nE+AoBKrAPA3MgepvgR9TSCasrCKH0eB1wBGBFdCO+nAGjMVGPcQb5bd6mQRegN6+1axOs9nGfYcCtfi4NQosdtH7dB+txFIpXQqN1p9B/asRHToyS0jRgpV7nk4nwcq1BJ+x3Gl/v7S9Wmpp/aGquum7w3ZDyrADFYrl8vHBH+ev9AUASW1dmU4h4wAAAABJRU5ErkJggg==" document.getElementsByTagName('head')[0].appendChild(link); </script>