colRowWeightedMedians - HenrikBengtsson/matrixStats GitHub Wiki
matrixStats: Benchmark report
This report benchmark the performance of colWeightedMedians() and rowWeightedMedians() against alternative methods.
- apply() + weightedMedian()
> rmatrix <- function(nrow, ncol, mode = c("logical", "double", "integer", "index"), range = c(-100,
+     +100), na_prob = 0) {
+     mode <- match.arg(mode)
+     n <- nrow * ncol
+     if (mode == "logical") {
+         x <- sample(c(FALSE, TRUE), size = n, replace = TRUE)
+     }     else if (mode == "index") {
+         x <- seq_len(n)
+         mode <- "integer"
+     }     else {
+         x <- runif(n, min = range[1], max = range[2])
+     }
+     storage.mode(x) <- mode
+     if (na_prob > 0)
+         x[sample(n, size = na_prob * n)] <- NA
+     dim(x) <- c(nrow, ncol)
+     x
+ }
> rmatrices <- function(scale = 10, seed = 1, ...) {
+     set.seed(seed)
+     data <- list()
+     data[[1]] <- rmatrix(nrow = scale * 1, ncol = scale * 1, ...)
+     data[[2]] <- rmatrix(nrow = scale * 10, ncol = scale * 10, ...)
+     data[[3]] <- rmatrix(nrow = scale * 100, ncol = scale * 1, ...)
+     data[[4]] <- t(data[[3]])
+     data[[5]] <- rmatrix(nrow = scale * 10, ncol = scale * 100, ...)
+     data[[6]] <- t(data[[5]])
+     names(data) <- sapply(data, FUN = function(x) paste(dim(x), collapse = "x"))
+     data
+ }
> data <- rmatrices(mode = "double")> X <- data[["10x10"]]
> w <- runif(nrow(X))
> gc()
used (Mb) gc trigger (Mb) max used (Mb)
Ncells 3230545 172.6 5709258 305.0 5709258 305.0
Vcells 6863260 52.4 22345847 170.5 56666022 432.4
> colStats <- microbenchmark(colWeightedMedians = colWeightedMedians(X, w = w, na.rm = FALSE), `apply+weigthedMedian` = apply(X,
+ MARGIN = 2L, FUN = weightedMedian, w = w, na.rm = FALSE), unit = "ms")
> X <- t(X)
> gc()
used (Mb) gc trigger (Mb) max used (Mb)
Ncells 3229068 172.5 5709258 305.0 5709258 305.0
Vcells 6859048 52.4 22345847 170.5 56666022 432.4
> rowStats <- microbenchmark(rowWeightedMedians = rowWeightedMedians(X, w = w, na.rm = FALSE), `apply+weigthedMedian` = apply(X,
+ MARGIN = 1L, FUN = weightedMedian, w = w, na.rm = FALSE), unit = "ms")Table: Benchmarking of colWeightedMedians() and apply+weigthedMedian() on 10x10 data. The top panel shows times in milliseconds and the bottom panel shows relative times.
| expr | min | lq | mean | median | uq | max | |
|---|---|---|---|---|---|---|---|
| 2 | apply+weigthedMedian | 0.034414 | 0.0353165 | 0.036865 | 0.0356925 | 0.0361500 | 0.142468 |
| 1 | colWeightedMedians | 0.042417 | 0.0432755 | 0.044040 | 0.0437040 | 0.0441705 | 0.062775 |
| expr | min | lq | mean | median | uq | max | |
|---|---|---|---|---|---|---|---|
| 2 | apply+weigthedMedian | 1.000000 | 1.000000 | 1.000000 | 1.000000 | 1.000000 | 1.0000000 |
| 1 | colWeightedMedians | 1.232551 | 1.225362 | 1.194627 | 1.224459 | 1.221867 | 0.4406253 |
Table: Benchmarking of rowWeightedMedians() and apply+weigthedMedian() on 10x10 data (transposed). The top panel shows times in milliseconds and the bottom panel shows relative times.
| expr | min | lq | mean | median | uq | max | |
|---|---|---|---|---|---|---|---|
| 2 | apply+weigthedMedian | 0.033587 | 0.034515 | 0.0360039 | 0.0348925 | 0.0353215 | 0.136032 |
| 1 | rowWeightedMedians | 0.041822 | 0.042836 | 0.0434889 | 0.0431860 | 0.0434855 | 0.064376 |
| expr | min | lq | mean | median | uq | max | |
|---|---|---|---|---|---|---|---|
| 2 | apply+weigthedMedian | 1.000000 | 1.000000 | 1.000000 | 1.000000 | 1.000000 | 1.0000000 |
| 1 | rowWeightedMedians | 1.245184 | 1.241084 | 1.207895 | 1.237687 | 1.231134 | 0.4732416 |
Figure: Benchmarking of colWeightedMedians() and apply+weigthedMedian() on 10x10 data as well as rowWeightedMedians() and apply+weigthedMedian() on the same data transposed. Outliers are displayed as crosses. Times are in milliseconds.
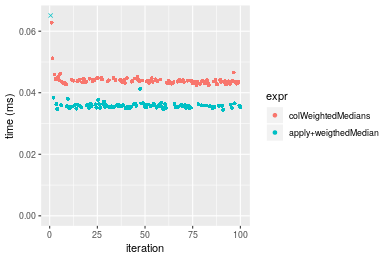
 Table: Benchmarking of colWeightedMedians() and rowWeightedMedians() on 10x10 data (original and transposed). The top panel shows times in milliseconds and the bottom panel shows relative times.
| expr | min | lq | mean | median | uq | max | |
|---|---|---|---|---|---|---|---|
| 2 | rowWeightedMedians | 41.822 | 42.8360 | 43.48893 | 43.186 | 43.4855 | 64.376 |
| 1 | colWeightedMedians | 42.417 | 43.2755 | 44.03998 | 43.704 | 44.1705 | 62.775 |
| expr | min | lq | mean | median | uq | max | |
|---|---|---|---|---|---|---|---|
| 2 | rowWeightedMedians | 1.000000 | 1.00000 | 1.000000 | 1.000000 | 1.000000 | 1.0000000 |
| 1 | colWeightedMedians | 1.014227 | 1.01026 | 1.012671 | 1.011995 | 1.015752 | 0.9751305 |
Figure: Benchmarking of colWeightedMedians() and rowWeightedMedians() on 10x10 data (original and transposed). Outliers are displayed as crosses. Times are in milliseconds.

> X <- data[["100x100"]]
> w <- runif(nrow(X))
> gc()
          used  (Mb) gc trigger  (Mb) max used  (Mb)
Ncells 3227620 172.4    5709258 305.0  5709258 305.0
Vcells 6473879  49.4   22345847 170.5 56666022 432.4
> colStats <- microbenchmark(colWeightedMedians = colWeightedMedians(X, w = w, na.rm = FALSE), `apply+weigthedMedian` = apply(X,
+     MARGIN = 2L, FUN = weightedMedian, w = w, na.rm = FALSE), unit = "ms")
> X <- t(X)
> gc()
          used  (Mb) gc trigger  (Mb) max used  (Mb)
Ncells 3227611 172.4    5709258 305.0  5709258 305.0
Vcells 6483917  49.5   22345847 170.5 56666022 432.4
> rowStats <- microbenchmark(rowWeightedMedians = rowWeightedMedians(X, w = w, na.rm = FALSE), `apply+weigthedMedian` = apply(X,
+     MARGIN = 1L, FUN = weightedMedian, w = w, na.rm = FALSE), unit = "ms")
Table: Benchmarking of colWeightedMedians() and apply+weigthedMedian() on 100x100 data. The top panel shows times in milliseconds and the bottom panel shows relative times.
| expr | min | lq | mean | median | uq | max | |
|---|---|---|---|---|---|---|---|
| 2 | apply+weigthedMedian | 0.653854 | 0.6767645 | 0.6846320 | 0.6831130 | 0.6882005 | 0.805764 |
| 1 | colWeightedMedians | 0.704007 | 0.7319885 | 0.7369661 | 0.7388305 | 0.7430675 | 0.766118 |
| expr | min | lq | mean | median | uq | max | |
|---|---|---|---|---|---|---|---|
| 2 | apply+weigthedMedian | 1.000000 | 1.0000 | 1.000000 | 1.000000 | 1.000000 | 1.000000 |
| 1 | colWeightedMedians | 1.076704 | 1.0816 | 1.076441 | 1.081564 | 1.079725 | 0.950797 |
Table: Benchmarking of rowWeightedMedians() and apply+weigthedMedian() on 100x100 data (transposed). The top panel shows times in milliseconds and the bottom panel shows relative times.
| expr | min | lq | mean | median | uq | max | |
|---|---|---|---|---|---|---|---|
| 2 | apply+weigthedMedian | 0.613283 | 0.6326505 | 0.6433630 | 0.6416485 | 0.6508290 | 0.834961 |
| 1 | rowWeightedMedians | 0.662970 | 0.6789810 | 0.6977486 | 0.6984910 | 0.7112255 | 0.770928 |
| expr | min | lq | mean | median | uq | max | |
|---|---|---|---|---|---|---|---|
| 2 | apply+weigthedMedian | 1.000000 | 1.000000 | 1.000000 | 1.000000 | 1.000000 | 1.0000000 |
| 1 | rowWeightedMedians | 1.081018 | 1.073232 | 1.084533 | 1.088588 | 1.092799 | 0.9233102 |
Figure: Benchmarking of colWeightedMedians() and apply+weigthedMedian() on 100x100 data as well as rowWeightedMedians() and apply+weigthedMedian() on the same data transposed. Outliers are displayed as crosses. Times are in milliseconds.

 Table: Benchmarking of colWeightedMedians() and rowWeightedMedians() on 100x100 data (original and transposed). The top panel shows times in milliseconds and the bottom panel shows relative times.
| expr | min | lq | mean | median | uq | max | |
|---|---|---|---|---|---|---|---|
| 2 | rowWeightedMedians | 662.970 | 678.9810 | 697.7486 | 698.4910 | 711.2255 | 770.928 |
| 1 | colWeightedMedians | 704.007 | 731.9885 | 736.9661 | 738.8305 | 743.0675 | 766.118 |
| expr | min | lq | mean | median | uq | max | |
|---|---|---|---|---|---|---|---|
| 2 | rowWeightedMedians | 1.000000 | 1.000000 | 1.000000 | 1.000000 | 1.000000 | 1.0000000 |
| 1 | colWeightedMedians | 1.061899 | 1.078069 | 1.056206 | 1.057752 | 1.044771 | 0.9937608 |
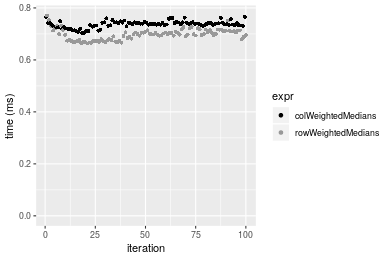
Figure: Benchmarking of colWeightedMedians() and rowWeightedMedians() on 100x100 data (original and transposed). Outliers are displayed as crosses. Times are in milliseconds.
> X <- data[["1000x10"]]
> w <- runif(nrow(X))
> gc()
          used  (Mb) gc trigger  (Mb) max used  (Mb)
Ncells 3226997 172.4    5709258 305.0  5709258 305.0
Vcells 6451877  49.3   22345847 170.5 56666022 432.4
> colStats <- microbenchmark(colWeightedMedians = colWeightedMedians(X, w = w, na.rm = FALSE), `apply+weigthedMedian` = apply(X,
+     MARGIN = 2L, FUN = weightedMedian, w = w, na.rm = FALSE), unit = "ms")
> X <- t(X)
> gc()
          used  (Mb) gc trigger  (Mb) max used  (Mb)
Ncells 3226988 172.4    5709258 305.0  5709258 305.0
Vcells 6461915  49.4   22345847 170.5 56666022 432.4
> rowStats <- microbenchmark(rowWeightedMedians = rowWeightedMedians(X, w = w, na.rm = FALSE), `apply+weigthedMedian` = apply(X,
+     MARGIN = 1L, FUN = weightedMedian, w = w, na.rm = FALSE), unit = "ms")
Table: Benchmarking of colWeightedMedians() and apply+weigthedMedian() on 1000x10 data. The top panel shows times in milliseconds and the bottom panel shows relative times.
| expr | min | lq | mean | median | uq | max | |
|---|---|---|---|---|---|---|---|
| 2 | apply+weigthedMedian | 0.576738 | 0.5898190 | 0.5987584 | 0.596093 | 0.6094355 | 0.654816 |
| 1 | colWeightedMedians | 0.595121 | 0.6048425 | 0.6180627 | 0.616453 | 0.6304220 | 0.686339 |
| expr | min | lq | mean | median | uq | max | |
|---|---|---|---|---|---|---|---|
| 2 | apply+weigthedMedian | 1.000000 | 1.000000 | 1.00000 | 1.000000 | 1.000000 | 1.00000 |
| 1 | colWeightedMedians | 1.031874 | 1.025471 | 1.03224 | 1.034156 | 1.034436 | 1.04814 |
Table: Benchmarking of rowWeightedMedians() and apply+weigthedMedian() on 1000x10 data (transposed). The top panel shows times in milliseconds and the bottom panel shows relative times.
| expr | min | lq | mean | median | uq | max | |
|---|---|---|---|---|---|---|---|
| 2 | apply+weigthedMedian | 0.535405 | 0.542933 | 0.5565937 | 0.5527315 | 0.5657045 | 0.665231 |
| 1 | rowWeightedMedians | 0.554885 | 0.562550 | 0.5782437 | 0.5743815 | 0.5869250 | 0.695733 |
| expr | min | lq | mean | median | uq | max | |
|---|---|---|---|---|---|---|---|
| 2 | apply+weigthedMedian | 1.000000 | 1.000000 | 1.000000 | 1.000000 | 1.000000 | 1.000000 |
| 1 | rowWeightedMedians | 1.036384 | 1.036131 | 1.038897 | 1.039169 | 1.037512 | 1.045852 |
Figure: Benchmarking of colWeightedMedians() and apply+weigthedMedian() on 1000x10 data as well as rowWeightedMedians() and apply+weigthedMedian() on the same data transposed. Outliers are displayed as crosses. Times are in milliseconds.

 Table: Benchmarking of colWeightedMedians() and rowWeightedMedians() on 1000x10 data (original and transposed). The top panel shows times in milliseconds and the bottom panel shows relative times.
| expr | min | lq | mean | median | uq | max | |
|---|---|---|---|---|---|---|---|
| 2 | rowWeightedMedians | 554.885 | 562.5500 | 578.2437 | 574.3815 | 586.925 | 695.733 |
| 1 | colWeightedMedians | 595.121 | 604.8425 | 618.0626 | 616.4530 | 630.422 | 686.339 |
| expr | min | lq | mean | median | uq | max | |
|---|---|---|---|---|---|---|---|
| 2 | rowWeightedMedians | 1.000000 | 1.00000 | 1.000000 | 1.000000 | 1.00000 | 1.0000000 |
| 1 | colWeightedMedians | 1.072512 | 1.07518 | 1.068862 | 1.073247 | 1.07411 | 0.9864977 |
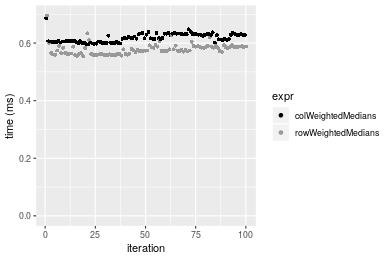
Figure: Benchmarking of colWeightedMedians() and rowWeightedMedians() on 1000x10 data (original and transposed). Outliers are displayed as crosses. Times are in milliseconds.
> X <- data[["10x1000"]]
> w <- runif(nrow(X))
> gc()
          used  (Mb) gc trigger  (Mb) max used  (Mb)
Ncells 3227195 172.4    5709258 305.0  5709258 305.0
Vcells 6451702  49.3   22345847 170.5 56666022 432.4
> colStats <- microbenchmark(colWeightedMedians = colWeightedMedians(X, w = w, na.rm = FALSE), `apply+weigthedMedian` = apply(X,
+     MARGIN = 2L, FUN = weightedMedian, w = w, na.rm = FALSE), unit = "ms")
> X <- t(X)
> gc()
          used  (Mb) gc trigger  (Mb) max used  (Mb)
Ncells 3227186 172.4    5709258 305.0  5709258 305.0
Vcells 6461740  49.3   22345847 170.5 56666022 432.4
> rowStats <- microbenchmark(rowWeightedMedians = rowWeightedMedians(X, w = w, na.rm = FALSE), `apply+weigthedMedian` = apply(X,
+     MARGIN = 1L, FUN = weightedMedian, w = w, na.rm = FALSE), unit = "ms")
Table: Benchmarking of colWeightedMedians() and apply+weigthedMedian() on 10x1000 data. The top panel shows times in milliseconds and the bottom panel shows relative times.
| expr | min | lq | mean | median | uq | max | |
|---|---|---|---|---|---|---|---|
| 2 | apply+weigthedMedian | 2.172776 | 2.408167 | 2.541653 | 2.471104 | 2.544382 | 8.466055 |
| 1 | colWeightedMedians | 2.643734 | 2.912365 | 3.051955 | 2.985746 | 3.057475 | 9.222259 |
| expr | min | lq | mean | median | uq | max | |
|---|---|---|---|---|---|---|---|
| 2 | apply+weigthedMedian | 1.000000 | 1.00000 | 1.000000 | 1.000000 | 1.000000 | 1.000000 |
| 1 | colWeightedMedians | 1.216754 | 1.20937 | 1.200775 | 1.208264 | 1.201658 | 1.089322 |
Table: Benchmarking of rowWeightedMedians() and apply+weigthedMedian() on 10x1000 data (transposed). The top panel shows times in milliseconds and the bottom panel shows relative times.
| expr | min | lq | mean | median | uq | max | |
|---|---|---|---|---|---|---|---|
| 2 | apply+weigthedMedian | 2.159425 | 2.401065 | 2.476082 | 2.474407 | 2.532453 | 3.375131 |
| 1 | rowWeightedMedians | 2.618450 | 2.898156 | 3.155197 | 2.966784 | 3.045298 | 9.044380 |
| expr | min | lq | mean | median | uq | max | |
|---|---|---|---|---|---|---|---|
| 2 | apply+weigthedMedian | 1.000000 | 1.000000 | 1.00000 | 1.000000 | 1.000000 | 1.000000 |
| 1 | rowWeightedMedians | 1.212568 | 1.207029 | 1.27427 | 1.198988 | 1.202509 | 2.679712 |
Figure: Benchmarking of colWeightedMedians() and apply+weigthedMedian() on 10x1000 data as well as rowWeightedMedians() and apply+weigthedMedian() on the same data transposed. Outliers are displayed as crosses. Times are in milliseconds.

 Table: Benchmarking of colWeightedMedians() and rowWeightedMedians() on 10x1000 data (original and transposed). The top panel shows times in milliseconds and the bottom panel shows relative times.
| expr | min | lq | mean | median | uq | max | |
|---|---|---|---|---|---|---|---|
| 2 | rowWeightedMedians | 2.618450 | 2.898156 | 3.155197 | 2.966784 | 3.045298 | 9.044380 |
| 1 | colWeightedMedians | 2.643734 | 2.912365 | 3.051955 | 2.985746 | 3.057475 | 9.222259 |
| expr | min | lq | mean | median | uq | max | |
|---|---|---|---|---|---|---|---|
| 2 | rowWeightedMedians | 1.000000 | 1.000000 | 1.0000000 | 1.000000 | 1.000000 | 1.000000 |
| 1 | colWeightedMedians | 1.009656 | 1.004903 | 0.9672786 | 1.006392 | 1.003999 | 1.019667 |
Figure: Benchmarking of colWeightedMedians() and rowWeightedMedians() on 10x1000 data (original and transposed). Outliers are displayed as crosses. Times are in milliseconds.

> X <- data[["100x1000"]]
> w <- runif(nrow(X))
> gc()
          used  (Mb) gc trigger  (Mb) max used  (Mb)
Ncells 3227382 172.4    5709258 305.0  5709258 305.0
Vcells 6452296  49.3   22345847 170.5 56666022 432.4
> colStats <- microbenchmark(colWeightedMedians = colWeightedMedians(X, w = w, na.rm = FALSE), `apply+weigthedMedian` = apply(X,
+     MARGIN = 2L, FUN = weightedMedian, w = w, na.rm = FALSE), unit = "ms")
> X <- t(X)
> gc()
          used  (Mb) gc trigger  (Mb) max used  (Mb)
Ncells 3227376 172.4    5709258 305.0  5709258 305.0
Vcells 6552339  50.0   22345847 170.5 56666022 432.4
> rowStats <- microbenchmark(rowWeightedMedians = rowWeightedMedians(X, w = w, na.rm = FALSE), `apply+weigthedMedian` = apply(X,
+     MARGIN = 1L, FUN = weightedMedian, w = w, na.rm = FALSE), unit = "ms")
Table: Benchmarking of colWeightedMedians() and apply+weigthedMedian() on 100x1000 data. The top panel shows times in milliseconds and the bottom panel shows relative times.
| expr | min | lq | mean | median | uq | max | |
|---|---|---|---|---|---|---|---|
| 2 | apply+weigthedMedian | 6.335133 | 6.735972 | 6.968173 | 6.795899 | 6.859356 | 22.81473 |
| 1 | colWeightedMedians | 6.894953 | 7.324806 | 7.795424 | 7.393520 | 7.537198 | 23.18486 |
| expr | min | lq | mean | median | uq | max | |
|---|---|---|---|---|---|---|---|
| 2 | apply+weigthedMedian | 1.000000 | 1.000000 | 1.000000 | 1.000000 | 1.00000 | 1.000000 |
| 1 | colWeightedMedians | 1.088367 | 1.087416 | 1.118719 | 1.087938 | 1.09882 | 1.016223 |
Table: Benchmarking of rowWeightedMedians() and apply+weigthedMedian() on 100x1000 data (transposed). The top panel shows times in milliseconds and the bottom panel shows relative times.
| expr | min | lq | mean | median | uq | max | |
|---|---|---|---|---|---|---|---|
| 2 | apply+weigthedMedian | 5.956803 | 6.321299 | 6.941218 | 6.359146 | 6.425687 | 23.89361 |
| 1 | rowWeightedMedians | 6.487969 | 6.814432 | 6.997135 | 6.872865 | 6.939459 | 10.44708 |
| expr | min | lq | mean | median | uq | max | |
|---|---|---|---|---|---|---|---|
| 2 | apply+weigthedMedian | 1.00000 | 1.000000 | 1.000000 | 1.000000 | 1.000000 | 1.0000000 |
| 1 | rowWeightedMedians | 1.08917 | 1.078011 | 1.008056 | 1.080784 | 1.079956 | 0.4372332 |
Figure: Benchmarking of colWeightedMedians() and apply+weigthedMedian() on 100x1000 data as well as rowWeightedMedians() and apply+weigthedMedian() on the same data transposed. Outliers are displayed as crosses. Times are in milliseconds.
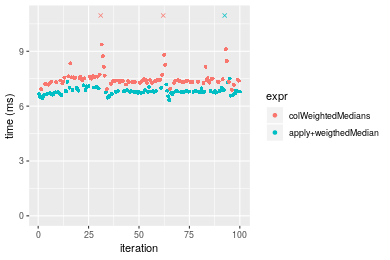
 Table: Benchmarking of colWeightedMedians() and rowWeightedMedians() on 100x1000 data (original and transposed). The top panel shows times in milliseconds and the bottom panel shows relative times.
| expr | min | lq | mean | median | uq | max | |
|---|---|---|---|---|---|---|---|
| 2 | rowWeightedMedians | 6.487969 | 6.814432 | 6.997135 | 6.872865 | 6.939459 | 10.44708 |
| 1 | colWeightedMedians | 6.894953 | 7.324806 | 7.795424 | 7.393520 | 7.537198 | 23.18486 |
| expr | min | lq | mean | median | uq | max | |
|---|---|---|---|---|---|---|---|
| 2 | rowWeightedMedians | 1.000000 | 1.000000 | 1.000000 | 1.000000 | 1.000000 | 1.000000 |
| 1 | colWeightedMedians | 1.062729 | 1.074896 | 1.114088 | 1.075755 | 1.086136 | 2.219267 |
Figure: Benchmarking of colWeightedMedians() and rowWeightedMedians() on 100x1000 data (original and transposed). Outliers are displayed as crosses. Times are in milliseconds.

> X <- data[["1000x100"]]
> w <- runif(nrow(X))
> gc()
          used  (Mb) gc trigger  (Mb) max used  (Mb)
Ncells 3227572 172.4    5709258 305.0  5709258 305.0
Vcells 6453850  49.3   22345847 170.5 56666022 432.4
> colStats <- microbenchmark(colWeightedMedians = colWeightedMedians(X, w = w, na.rm = FALSE), `apply+weigthedMedian` = apply(X,
+     MARGIN = 2L, FUN = weightedMedian, w = w, na.rm = FALSE), unit = "ms")
> X <- t(X)
> gc()
          used  (Mb) gc trigger  (Mb) max used  (Mb)
Ncells 3227563 172.4    5709258 305.0  5709258 305.0
Vcells 6553888  50.1   22345847 170.5 56666022 432.4
> rowStats <- microbenchmark(rowWeightedMedians = rowWeightedMedians(X, w = w, na.rm = FALSE), `apply+weigthedMedian` = apply(X,
+     MARGIN = 1L, FUN = weightedMedian, w = w, na.rm = FALSE), unit = "ms")
Table: Benchmarking of colWeightedMedians() and apply+weigthedMedian() on 1000x100 data. The top panel shows times in milliseconds and the bottom panel shows relative times.
| expr | min | lq | mean | median | uq | max | |
|---|---|---|---|---|---|---|---|
| 2 | apply+weigthedMedian | 5.174672 | 5.421680 | 8.084785 | 5.450757 | 5.519330 | 255.12654 |
| 1 | colWeightedMedians | 5.253931 | 5.485418 | 5.658828 | 5.512492 | 5.590269 | 14.12993 |
| expr | min | lq | mean | median | uq | max | |
|---|---|---|---|---|---|---|---|
| 2 | apply+weigthedMedian | 1.000000 | 1.000000 | 1.0000000 | 1.000000 | 1.000000 | 1.000000 |
| 1 | colWeightedMedians | 1.015317 | 1.011756 | 0.6999355 | 1.011326 | 1.012853 | 0.055384 |
Table: Benchmarking of rowWeightedMedians() and apply+weigthedMedian() on 1000x100 data (transposed). The top panel shows times in milliseconds and the bottom panel shows relative times.
| expr | min | lq | mean | median | uq | max | |
|---|---|---|---|---|---|---|---|
| 2 | apply+weigthedMedian | 5.271997 | 5.455296 | 5.707209 | 5.493001 | 5.540624 | 14.16726 |
| 1 | rowWeightedMedians | 5.296073 | 5.529117 | 5.656510 | 5.551160 | 5.603319 | 13.57193 |
| expr | min | lq | mean | median | uq | max | |
|---|---|---|---|---|---|---|---|
| 2 | apply+weigthedMedian | 1.000000 | 1.000000 | 1.0000000 | 1.000000 | 1.000000 | 1.0000000 |
| 1 | rowWeightedMedians | 1.004567 | 1.013532 | 0.9911167 | 1.010588 | 1.011316 | 0.9579784 |
Figure: Benchmarking of colWeightedMedians() and apply+weigthedMedian() on 1000x100 data as well as rowWeightedMedians() and apply+weigthedMedian() on the same data transposed. Outliers are displayed as crosses. Times are in milliseconds.

 Table: Benchmarking of colWeightedMedians() and rowWeightedMedians() on 1000x100 data (original and transposed). The top panel shows times in milliseconds and the bottom panel shows relative times.
| expr | min | lq | mean | median | uq | max | |
|---|---|---|---|---|---|---|---|
| 1 | colWeightedMedians | 5.253931 | 5.485418 | 5.658828 | 5.512492 | 5.590269 | 14.12993 |
| 2 | rowWeightedMedians | 5.296073 | 5.529117 | 5.656510 | 5.551160 | 5.603319 | 13.57193 |
| expr | min | lq | mean | median | uq | max | |
|---|---|---|---|---|---|---|---|
| 1 | colWeightedMedians | 1.000000 | 1.000000 | 1.0000000 | 1.000000 | 1.000000 | 1.0000000 |
| 2 | rowWeightedMedians | 1.008021 | 1.007966 | 0.9995903 | 1.007015 | 1.002334 | 0.9605098 |
Figure: Benchmarking of colWeightedMedians() and rowWeightedMedians() on 1000x100 data (original and transposed). Outliers are displayed as crosses. Times are in milliseconds.

R version 3.6.1 Patched (2019-08-27 r77078)
Platform: x86_64-pc-linux-gnu (64-bit)
Running under: Ubuntu 18.04.3 LTS

Matrix products: default
BLAS:   /home/hb/software/R-devel/R-3-6-branch/lib/R/lib/libRblas.so
LAPACK: /home/hb/software/R-devel/R-3-6-branch/lib/R/lib/libRlapack.so

locale:
 [1] LC_CTYPE=en_US.UTF-8       LC_NUMERIC=C
 [3] LC_TIME=en_US.UTF-8        LC_COLLATE=en_US.UTF-8
 [5] LC_MONETARY=en_US.UTF-8    LC_MESSAGES=en_US.UTF-8
 [7] LC_PAPER=en_US.UTF-8       LC_NAME=C
 [9] LC_ADDRESS=C               LC_TELEPHONE=C
[11] LC_MEASUREMENT=en_US.UTF-8 LC_IDENTIFICATION=C

attached base packages:
[1] stats     graphics  grDevices utils     datasets  methods   base

other attached packages:
[1] microbenchmark_1.4-6    matrixStats_0.55.0-9000 ggplot2_3.2.1
[4] knitr_1.24              R.devices_2.16.0        R.utils_2.9.0
[7] R.oo_1.22.0             R.methodsS3_1.7.1       history_0.0.0-9002

loaded via a namespace (and not attached):
 [1] Biobase_2.45.0       bit64_0.9-7          splines_3.6.1
 [4] network_1.15         assertthat_0.2.1     highr_0.8
 [7] stats4_3.6.1         blob_1.2.0           robustbase_0.93-5
[10] pillar_1.4.2         RSQLite_2.1.2        backports_1.1.4
[13] lattice_0.20-38      glue_1.3.1           digest_0.6.20
[16] colorspace_1.4-1     sandwich_2.5-1       Matrix_1.2-17
[19] XML_3.98-1.20        lpSolve_5.6.13.3     pkgconfig_2.0.2
[22] genefilter_1.66.0    purrr_0.3.2          ergm_3.10.4
[25] xtable_1.8-4         mvtnorm_1.0-11       scales_1.0.0
[28] tibble_2.1.3         annotate_1.62.0      IRanges_2.18.2
[31] TH.data_1.0-10       withr_2.1.2          BiocGenerics_0.30.0
[34] lazyeval_0.2.2       mime_0.7             survival_2.44-1.1
[37] magrittr_1.5         crayon_1.3.4         statnet.common_4.3.0
[40] memoise_1.1.0        laeken_0.5.0         R.cache_0.13.0
[43] MASS_7.3-51.4        R.rsp_0.43.1         tools_3.6.1
[46] multcomp_1.4-10      S4Vectors_0.22.1     trust_0.1-7
[49] munsell_0.5.0        AnnotationDbi_1.46.1 compiler_3.6.1
[52] rlang_0.4.0          grid_3.6.1           RCurl_1.95-4.12
[55] cwhmisc_6.6          rappdirs_0.3.1       labeling_0.3
[58] bitops_1.0-6         base64enc_0.1-3      boot_1.3-23
[61] gtable_0.3.0         codetools_0.2-16     DBI_1.0.0
[64] markdown_1.1         R6_2.4.0             zoo_1.8-6
[67] dplyr_0.8.3          bit_1.1-14           zeallot_0.1.0
[70] parallel_3.6.1       Rcpp_1.0.2           vctrs_0.2.0
[73] DEoptimR_1.0-8       tidyselect_0.2.5     xfun_0.9
[76] coda_0.19-3
Total processing time was 18.39 secs.
To reproduce this report, do:
html <- matrixStats:::benchmark('colWeightedMedians')Copyright Henrik Bengtsson. Last updated on 2019-09-10 20:56:15 (-0700 UTC). Powered by RSP.
<script> var link = document.createElement('link'); link.rel = 'icon'; link.href = "data:image/png;base64,iVBORw0KGgoAAAANSUhEUgAAACAAAAAgCAMAAABEpIrGAAAA21BMVEUAAAAAAP8AAP8AAP8AAP8AAP8AAP8AAP8AAP8AAP8AAP8AAP8AAP8AAP8AAP8AAP8AAP8AAP8AAP8AAP8AAP8AAP8AAP8AAP8AAP8AAP8AAP8AAP8AAP8AAP8AAP8AAP8AAP8AAP8AAP8AAP8AAP8AAP8AAP8AAP8AAP8AAP8BAf4CAv0DA/wdHeIeHuEfH+AgIN8hId4lJdomJtknJ9g+PsE/P8BAQL9yco10dIt1dYp3d4h4eIeVlWqWlmmXl2iYmGeZmWabm2Tn5xjo6Bfp6Rb39wj4+Af//wA2M9hbAAAASXRSTlMAAQIJCgsMJSYnKD4/QGRlZmhpamtsbautrrCxuru8y8zN5ebn6Pn6+///////////////////////////////////////////LsUNcQAAAS9JREFUOI29k21XgkAQhVcFytdSMqMETU26UVqGmpaiFbL//xc1cAhhwVNf6n5i5z67M2dmYOyfJZUqlVLhkKucG7cgmUZTybDz6g0iDeq51PUr37Ds2cy2/C9NeES5puDjxuUk1xnToZsg8pfA3avHQ3lLIi7iWRrkv/OYtkScxBIMgDee0ALoyxHQBJ68JLCjOtQIMIANF7QG9G9fNnHvisCHBVMKgSJgiz7nE+AoBKrAPA3MgepvgR9TSCasrCKH0eB1wBGBFdCO+nAGjMVGPcQb5bd6mQRegN6+1axOs9nGfYcCtfi4NQosdtH7dB+txFIpXQqN1p9B/asRHToyS0jRgpV7nk4nwcq1BJ+x3Gl/v7S9Wmpp/aGquum7w3ZDyrADFYrl8vHBH+ev9AUASW1dmU4h4wAAAABJRU5ErkJggg==" document.getElementsByTagName('head')[0].appendChild(link); </script>