colRowWeightedMeans - HenrikBengtsson/matrixStats GitHub Wiki
matrixStats: Benchmark report
This report benchmark the performance of colWeightedMeans() and rowWeightedMeans() against alternative methods.
- apply() + weighted.mean()
> rmatrix <- function(nrow, ncol, mode = c("logical", "double", "integer", "index"), range = c(-100,
+     +100), na_prob = 0) {
+     mode <- match.arg(mode)
+     n <- nrow * ncol
+     if (mode == "logical") {
+         x <- sample(c(FALSE, TRUE), size = n, replace = TRUE)
+     }     else if (mode == "index") {
+         x <- seq_len(n)
+         mode <- "integer"
+     }     else {
+         x <- runif(n, min = range[1], max = range[2])
+     }
+     storage.mode(x) <- mode
+     if (na_prob > 0)
+         x[sample(n, size = na_prob * n)] <- NA
+     dim(x) <- c(nrow, ncol)
+     x
+ }
> rmatrices <- function(scale = 10, seed = 1, ...) {
+     set.seed(seed)
+     data <- list()
+     data[[1]] <- rmatrix(nrow = scale * 1, ncol = scale * 1, ...)
+     data[[2]] <- rmatrix(nrow = scale * 10, ncol = scale * 10, ...)
+     data[[3]] <- rmatrix(nrow = scale * 100, ncol = scale * 1, ...)
+     data[[4]] <- t(data[[3]])
+     data[[5]] <- rmatrix(nrow = scale * 10, ncol = scale * 100, ...)
+     data[[6]] <- t(data[[5]])
+     names(data) <- sapply(data, FUN = function(x) paste(dim(x), collapse = "x"))
+     data
+ }
> data <- rmatrices(mode = "double")> X <- data[["10x10"]]
> w <- runif(nrow(X))
> gc()
used (Mb) gc trigger (Mb) max used (Mb)
Ncells 3224474 172.3 5709258 305.0 5709258 305.0
Vcells 6809017 52.0 22345847 170.5 56666022 432.4
> colStats <- microbenchmark(colWeightedMeans = colWeightedMeans(X, w = w, na.rm = FALSE), `apply+weigthed.mean` = apply(X,
+ MARGIN = 2L, FUN = weighted.mean, w = w, na.rm = FALSE), unit = "ms")
> X <- t(X)
> gc()
used (Mb) gc trigger (Mb) max used (Mb)
Ncells 3222908 172.2 5709258 305.0 5709258 305.0
Vcells 6804464 52.0 22345847 170.5 56666022 432.4
> rowStats <- microbenchmark(rowWeightedMeans = rowWeightedMeans(X, w = w, na.rm = FALSE), `apply+weigthed.mean` = apply(X,
+ MARGIN = 1L, FUN = weighted.mean, w = w, na.rm = FALSE), unit = "ms")Table: Benchmarking of colWeightedMeans() and apply+weigthed.mean() on 10x10 data. The top panel shows times in milliseconds and the bottom panel shows relative times.
| expr | min | lq | mean | median | uq | max | |
|---|---|---|---|---|---|---|---|
| 1 | colWeightedMeans | 0.008693 | 0.009417 | 0.0106235 | 0.0101925 | 0.0113220 | 0.035141 |
| 2 | apply+weigthed.mean | 0.056830 | 0.058049 | 0.0606144 | 0.0587155 | 0.0596145 | 0.225416 |
| expr | min | lq | mean | median | uq | max | |
|---|---|---|---|---|---|---|---|
| 1 | colWeightedMeans | 1.000000 | 1.000000 | 1.000000 | 1.000000 | 1.000000 | 1.000000 |
| 2 | apply+weigthed.mean | 6.537444 | 6.164277 | 5.705701 | 5.760657 | 5.265368 | 6.414615 |
Table: Benchmarking of rowWeightedMeans() and apply+weigthed.mean() on 10x10 data (transposed). The top panel shows times in milliseconds and the bottom panel shows relative times.
| expr | min | lq | mean | median | uq | max | |
|---|---|---|---|---|---|---|---|
| 1 | rowWeightedMeans | 0.010868 | 0.0119150 | 0.0133688 | 0.0134600 | 0.0139455 | 0.044320 |
| 2 | apply+weigthed.mean | 0.056178 | 0.0575745 | 0.0591443 | 0.0583855 | 0.0588660 | 0.131455 |
| expr | min | lq | mean | median | uq | max | |
|---|---|---|---|---|---|---|---|
| 1 | rowWeightedMeans | 1.00000 | 1.000000 | 1.000000 | 1.000000 | 1.000000 | 1.000000 |
| 2 | apply+weigthed.mean | 5.16912 | 4.832102 | 4.424048 | 4.337704 | 4.221147 | 2.966042 |
Figure: Benchmarking of colWeightedMeans() and apply+weigthed.mean() on 10x10 data as well as rowWeightedMeans() and apply+weigthed.mean() on the same data transposed. Outliers are displayed as crosses. Times are in milliseconds.

 Table: Benchmarking of colWeightedMeans() and rowWeightedMeans() on 10x10 data (original and transposed). The top panel shows times in milliseconds and the bottom panel shows relative times.
| expr | min | lq | mean | median | uq | max | |
|---|---|---|---|---|---|---|---|
| 1 | colWeightedMeans | 8.693 | 9.417 | 10.62348 | 10.1925 | 11.3220 | 35.141 |
| 2 | rowWeightedMeans | 10.868 | 11.915 | 13.36883 | 13.4600 | 13.9455 | 44.320 |
| expr | min | lq | mean | median | uq | max | |
|---|---|---|---|---|---|---|---|
| 1 | colWeightedMeans | 1.000000 | 1.000000 | 1.000000 | 1.000000 | 1.000000 | 1.000000 |
| 2 | rowWeightedMeans | 1.250201 | 1.265265 | 1.258423 | 1.320579 | 1.231717 | 1.261205 |
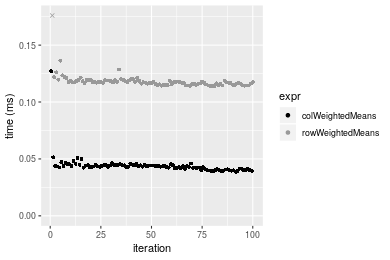
Figure: Benchmarking of colWeightedMeans() and rowWeightedMeans() on 10x10 data (original and transposed). Outliers are displayed as crosses. Times are in milliseconds.

> X <- data[["100x100"]]
> w <- runif(nrow(X))
> gc()
          used  (Mb) gc trigger  (Mb) max used  (Mb)
Ncells 3221457 172.1    5709258 305.0  5709258 305.0
Vcells 6419290  49.0   22345847 170.5 56666022 432.4
> colStats <- microbenchmark(colWeightedMeans = colWeightedMeans(X, w = w, na.rm = FALSE), `apply+weigthed.mean` = apply(X,
+     MARGIN = 2L, FUN = weighted.mean, w = w, na.rm = FALSE), unit = "ms")
> X <- t(X)
> gc()
          used  (Mb) gc trigger  (Mb) max used  (Mb)
Ncells 3221451 172.1    5709258 305.0  5709258 305.0
Vcells 6429333  49.1   22345847 170.5 56666022 432.4
> rowStats <- microbenchmark(rowWeightedMeans = rowWeightedMeans(X, w = w, na.rm = FALSE), `apply+weigthed.mean` = apply(X,
+     MARGIN = 1L, FUN = weighted.mean, w = w, na.rm = FALSE), unit = "ms")
Table: Benchmarking of colWeightedMeans() and apply+weigthed.mean() on 100x100 data. The top panel shows times in milliseconds and the bottom panel shows relative times.
| expr | min | lq | mean | median | uq | max | |
|---|---|---|---|---|---|---|---|
| 1 | colWeightedMeans | 0.027920 | 0.0299280 | 0.0316412 | 0.0308905 | 0.0322100 | 0.059950 |
| 2 | apply+weigthed.mean | 0.607759 | 0.6153645 | 0.6292381 | 0.6225935 | 0.6315155 | 0.898593 |
| expr | min | lq | mean | median | uq | max | |
|---|---|---|---|---|---|---|---|
| 1 | colWeightedMeans | 1.00000 | 1.0000 | 1.00000 | 1.00000 | 1.00000 | 1.00000 |
| 2 | apply+weigthed.mean | 21.76787 | 20.5615 | 19.88664 | 20.15485 | 19.60619 | 14.98904 |
Table: Benchmarking of rowWeightedMeans() and apply+weigthed.mean() on 100x100 data (transposed). The top panel shows times in milliseconds and the bottom panel shows relative times.
| expr | min | lq | mean | median | uq | max | |
|---|---|---|---|---|---|---|---|
| 1 | rowWeightedMeans | 0.103243 | 0.104445 | 0.1064423 | 0.1056270 | 0.1071515 | 0.139339 |
| 2 | apply+weigthed.mean | 0.564707 | 0.572189 | 0.5869633 | 0.5776505 | 0.5892865 | 0.800169 |
| expr | min | lq | mean | median | uq | max | |
|---|---|---|---|---|---|---|---|
| 1 | rowWeightedMeans | 1.000000 | 1.000000 | 1.000000 | 1.000000 | 1.000000 | 1.000000 |
| 2 | apply+weigthed.mean | 5.469688 | 5.478376 | 5.514382 | 5.468777 | 5.499564 | 5.742606 |
Figure: Benchmarking of colWeightedMeans() and apply+weigthed.mean() on 100x100 data as well as rowWeightedMeans() and apply+weigthed.mean() on the same data transposed. Outliers are displayed as crosses. Times are in milliseconds.

 Table: Benchmarking of colWeightedMeans() and rowWeightedMeans() on 100x100 data (original and transposed). The top panel shows times in milliseconds and the bottom panel shows relative times.
| expr | min | lq | mean | median | uq | max | |
|---|---|---|---|---|---|---|---|
| 1 | colWeightedMeans | 27.920 | 29.928 | 31.64124 | 30.8905 | 32.2100 | 59.950 |
| 2 | rowWeightedMeans | 103.243 | 104.445 | 106.44226 | 105.6270 | 107.1515 | 139.339 |
| expr | min | lq | mean | median | uq | max | |
|---|---|---|---|---|---|---|---|
| 1 | colWeightedMeans | 1.000000 | 1.000000 | 1.000000 | 1.000000 | 1.000000 | 1.000000 |
| 2 | rowWeightedMeans | 3.697815 | 3.489876 | 3.364036 | 3.419401 | 3.326653 | 2.324254 |
Figure: Benchmarking of colWeightedMeans() and rowWeightedMeans() on 100x100 data (original and transposed). Outliers are displayed as crosses. Times are in milliseconds.

> X <- data[["1000x10"]]
> w <- runif(nrow(X))
> gc()
          used  (Mb) gc trigger  (Mb) max used  (Mb)
Ncells 3222179 172.1    5709258 305.0  5709258 305.0
Vcells 6423694  49.1   22345847 170.5 56666022 432.4
> colStats <- microbenchmark(colWeightedMeans = colWeightedMeans(X, w = w, na.rm = FALSE), `apply+weigthed.mean` = apply(X,
+     MARGIN = 2L, FUN = weighted.mean, w = w, na.rm = FALSE), unit = "ms")
> X <- t(X)
> gc()
          used  (Mb) gc trigger  (Mb) max used  (Mb)
Ncells 3222170 172.1    5709258 305.0  5709258 305.0
Vcells 6433732  49.1   22345847 170.5 56666022 432.4
> rowStats <- microbenchmark(rowWeightedMeans = rowWeightedMeans(X, w = w, na.rm = FALSE), `apply+weigthed.mean` = apply(X,
+     MARGIN = 1L, FUN = weighted.mean, w = w, na.rm = FALSE), unit = "ms")
Table: Benchmarking of colWeightedMeans() and apply+weigthed.mean() on 1000x10 data. The top panel shows times in milliseconds and the bottom panel shows relative times.
| expr | min | lq | mean | median | uq | max | |
|---|---|---|---|---|---|---|---|
| 1 | colWeightedMeans | 0.038679 | 0.0414205 | 0.0440360 | 0.043397 | 0.044463 | 0.127149 |
| 2 | apply+weigthed.mean | 0.206058 | 0.2166725 | 0.2233923 | 0.223155 | 0.228157 | 0.290184 |
| expr | min | lq | mean | median | uq | max | |
|---|---|---|---|---|---|---|---|
| 1 | colWeightedMeans | 1.000000 | 1.000000 | 1.000000 | 1.000000 | 1.00000 | 1.000000 |
| 2 | apply+weigthed.mean | 5.327387 | 5.231045 | 5.072946 | 5.142176 | 5.13139 | 2.282236 |
Table: Benchmarking of rowWeightedMeans() and apply+weigthed.mean() on 1000x10 data (transposed). The top panel shows times in milliseconds and the bottom panel shows relative times.
| expr | min | lq | mean | median | uq | max | |
|---|---|---|---|---|---|---|---|
| 1 | rowWeightedMeans | 0.114099 | 0.1158545 | 0.1182368 | 0.117336 | 0.1186590 | 0.180816 |
| 2 | apply+weigthed.mean | 0.161699 | 0.1643335 | 0.1751542 | 0.169834 | 0.1829515 | 0.233958 |
| expr | min | lq | mean | median | uq | max | |
|---|---|---|---|---|---|---|---|
| 1 | rowWeightedMeans | 1.000000 | 1.000000 | 1.000000 | 1.000000 | 1.000000 | 1.000000 |
| 2 | apply+weigthed.mean | 1.417182 | 1.418447 | 1.481385 | 1.447416 | 1.541826 | 1.293901 |
Figure: Benchmarking of colWeightedMeans() and apply+weigthed.mean() on 1000x10 data as well as rowWeightedMeans() and apply+weigthed.mean() on the same data transposed. Outliers are displayed as crosses. Times are in milliseconds.

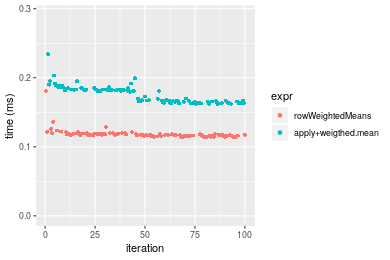 Table: Benchmarking of colWeightedMeans() and rowWeightedMeans() on 1000x10 data (original and transposed). The top panel shows times in milliseconds and the bottom panel shows relative times.
| expr | min | lq | mean | median | uq | max | |
|---|---|---|---|---|---|---|---|
| 1 | colWeightedMeans | 38.679 | 41.4205 | 44.03601 | 43.397 | 44.463 | 127.149 |
| 2 | rowWeightedMeans | 114.099 | 115.8545 | 118.23683 | 117.336 | 118.659 | 180.816 |
| expr | min | lq | mean | median | uq | max | |
|---|---|---|---|---|---|---|---|
| 1 | colWeightedMeans | 1.000000 | 1.000000 | 1.000000 | 1.000000 | 1.000000 | 1.00000 |
| 2 | rowWeightedMeans | 2.949895 | 2.797033 | 2.685003 | 2.703781 | 2.668713 | 1.42208 |
Figure: Benchmarking of colWeightedMeans() and rowWeightedMeans() on 1000x10 data (original and transposed). Outliers are displayed as crosses. Times are in milliseconds.
> X <- data[["10x1000"]]
> w <- runif(nrow(X))
> gc()
          used  (Mb) gc trigger  (Mb) max used  (Mb)
Ncells 3222374 172.1    5709258 305.0  5709258 305.0
Vcells 6423490  49.1   22345847 170.5 56666022 432.4
> colStats <- microbenchmark(colWeightedMeans = colWeightedMeans(X, w = w, na.rm = FALSE), `apply+weigthed.mean` = apply(X,
+     MARGIN = 2L, FUN = weighted.mean, w = w, na.rm = FALSE), unit = "ms")
> X <- t(X)
> gc()
          used  (Mb) gc trigger  (Mb) max used  (Mb)
Ncells 3222368 172.1    5709258 305.0  5709258 305.0
Vcells 6433533  49.1   22345847 170.5 56666022 432.4
> rowStats <- microbenchmark(rowWeightedMeans = rowWeightedMeans(X, w = w, na.rm = FALSE), `apply+weigthed.mean` = apply(X,
+     MARGIN = 1L, FUN = weighted.mean, w = w, na.rm = FALSE), unit = "ms")
Table: Benchmarking of colWeightedMeans() and apply+weigthed.mean() on 10x1000 data. The top panel shows times in milliseconds and the bottom panel shows relative times.
| expr | min | lq | mean | median | uq | max | |
|---|---|---|---|---|---|---|---|
| 1 | colWeightedMeans | 0.028433 | 0.030165 | 0.0359748 | 0.033409 | 0.038258 | 0.10123 |
| 2 | apply+weigthed.mean | 4.349560 | 4.494647 | 4.7989474 | 4.656507 | 4.792277 | 11.09634 |
| expr | min | lq | mean | median | uq | max | |
|---|---|---|---|---|---|---|---|
| 1 | colWeightedMeans | 1.0000 | 1.0000 | 1.0000 | 1.0000 | 1.0000 | 1.0000 |
| 2 | apply+weigthed.mean | 152.9758 | 149.0021 | 133.3976 | 139.3788 | 125.2621 | 109.6151 |
Table: Benchmarking of rowWeightedMeans() and apply+weigthed.mean() on 10x1000 data (transposed). The top panel shows times in milliseconds and the bottom panel shows relative times.
| expr | min | lq | mean | median | uq | max | |
|---|---|---|---|---|---|---|---|
| 1 | rowWeightedMeans | 0.099616 | 0.1016885 | 0.1137857 | 0.1069615 | 0.119232 | 0.173575 |
| 2 | apply+weigthed.mean | 4.433739 | 4.5614075 | 4.9078075 | 4.6794500 | 4.797594 | 10.898394 |
| expr | min | lq | mean | median | uq | max | |
|---|---|---|---|---|---|---|---|
| 1 | rowWeightedMeans | 1.0000 | 1.00000 | 1.00000 | 1.00000 | 1.00000 | 1.00000 |
| 2 | apply+weigthed.mean | 44.5083 | 44.85667 | 43.13202 | 43.74892 | 40.23747 | 62.78781 |
Figure: Benchmarking of colWeightedMeans() and apply+weigthed.mean() on 10x1000 data as well as rowWeightedMeans() and apply+weigthed.mean() on the same data transposed. Outliers are displayed as crosses. Times are in milliseconds.

 Table: Benchmarking of colWeightedMeans() and rowWeightedMeans() on 10x1000 data (original and transposed). The top panel shows times in milliseconds and the bottom panel shows relative times.
| expr | min | lq | mean | median | uq | max | |
|---|---|---|---|---|---|---|---|
| 1 | colWeightedMeans | 28.433 | 30.1650 | 35.97476 | 33.4090 | 38.258 | 101.230 |
| 2 | rowWeightedMeans | 99.616 | 101.6885 | 113.78570 | 106.9615 | 119.232 | 173.575 |
| expr | min | lq | mean | median | uq | max | |
|---|---|---|---|---|---|---|---|
| 1 | colWeightedMeans | 1.000000 | 1.000000 | 1.000000 | 1.000000 | 1.000000 | 1.00000 |
| 2 | rowWeightedMeans | 3.503535 | 3.371076 | 3.162932 | 3.201577 | 3.116525 | 1.71466 |
Figure: Benchmarking of colWeightedMeans() and rowWeightedMeans() on 10x1000 data (original and transposed). Outliers are displayed as crosses. Times are in milliseconds.

> X <- data[["100x1000"]]
> w <- runif(nrow(X))
> gc()
          used  (Mb) gc trigger  (Mb) max used  (Mb)
Ncells 3222567 172.2    5709258 305.0  5709258 305.0
Vcells 6424088  49.1   22345847 170.5 56666022 432.4
> colStats <- microbenchmark(colWeightedMeans = colWeightedMeans(X, w = w, na.rm = FALSE), `apply+weigthed.mean` = apply(X,
+     MARGIN = 2L, FUN = weighted.mean, w = w, na.rm = FALSE), unit = "ms")
> X <- t(X)
> gc()
          used  (Mb) gc trigger  (Mb) max used  (Mb)
Ncells 3222558 172.2    5709258 305.0  5709258 305.0
Vcells 6524126  49.8   22345847 170.5 56666022 432.4
> rowStats <- microbenchmark(rowWeightedMeans = rowWeightedMeans(X, w = w, na.rm = FALSE), `apply+weigthed.mean` = apply(X,
+     MARGIN = 1L, FUN = weighted.mean, w = w, na.rm = FALSE), unit = "ms")
Table: Benchmarking of colWeightedMeans() and apply+weigthed.mean() on 100x1000 data. The top panel shows times in milliseconds and the bottom panel shows relative times.
| expr | min | lq | mean | median | uq | max | |
|---|---|---|---|---|---|---|---|
| 1 | colWeightedMeans | 0.168430 | 0.214824 | 0.5719912 | 0.2336885 | 0.2628565 | 16.14153 |
| 2 | apply+weigthed.mean | 5.864435 | 5.987965 | 6.7585538 | 6.0624905 | 6.4554550 | 27.67489 |
| expr | min | lq | mean | median | uq | max | |
|---|---|---|---|---|---|---|---|
| 1 | colWeightedMeans | 1.00000 | 1.00000 | 1.00000 | 1.00000 | 1.00000 | 1.000000 |
| 2 | apply+weigthed.mean | 34.81823 | 27.87382 | 11.81584 | 25.94261 | 24.55886 | 1.714515 |
Table: Benchmarking of rowWeightedMeans() and apply+weigthed.mean() on 100x1000 data (transposed). The top panel shows times in milliseconds and the bottom panel shows relative times.
| expr | min | lq | mean | median | uq | max | |
|---|---|---|---|---|---|---|---|
| 1 | rowWeightedMeans | 0.899402 | 0.908582 | 0.9750369 | 0.9174375 | 0.983048 | 1.508171 |
| 2 | apply+weigthed.mean | 5.551639 | 5.648465 | 6.6217834 | 5.6926085 | 6.169376 | 23.063148 |
| expr | min | lq | mean | median | uq | max | |
|---|---|---|---|---|---|---|---|
| 1 | rowWeightedMeans | 1.000000 | 1.000000 | 1.000000 | 1.000000 | 1.000000 | 1.00000 |
| 2 | apply+weigthed.mean | 6.172589 | 6.216792 | 6.791315 | 6.204901 | 6.275763 | 15.29213 |
Figure: Benchmarking of colWeightedMeans() and apply+weigthed.mean() on 100x1000 data as well as rowWeightedMeans() and apply+weigthed.mean() on the same data transposed. Outliers are displayed as crosses. Times are in milliseconds.

 Table: Benchmarking of colWeightedMeans() and rowWeightedMeans() on 100x1000 data (original and transposed). The top panel shows times in milliseconds and the bottom panel shows relative times.
| expr | min | lq | mean | median | uq | max | |
|---|---|---|---|---|---|---|---|
| 1 | colWeightedMeans | 168.430 | 214.824 | 571.9911 | 233.6885 | 262.8565 | 16141.528 |
| 2 | rowWeightedMeans | 899.402 | 908.582 | 975.0369 | 917.4375 | 983.0480 | 1508.171 |
| expr | min | lq | mean | median | uq | max | |
|---|---|---|---|---|---|---|---|
| 1 | colWeightedMeans | 1.000000 | 1.000000 | 1.000000 | 1.000000 | 1.000000 | 1.0000000 |
| 2 | rowWeightedMeans | 5.339916 | 4.229425 | 1.704636 | 3.925899 | 3.739866 | 0.0934342 |
Figure: Benchmarking of colWeightedMeans() and rowWeightedMeans() on 100x1000 data (original and transposed). Outliers are displayed as crosses. Times are in milliseconds.

> X <- data[["1000x100"]]
> w <- runif(nrow(X))
> gc()
          used  (Mb) gc trigger  (Mb) max used  (Mb)
Ncells 3222754 172.2    5709258 305.0  5709258 305.0
Vcells 6425627  49.1   22345847 170.5 56666022 432.4
> colStats <- microbenchmark(colWeightedMeans = colWeightedMeans(X, w = w, na.rm = FALSE), `apply+weigthed.mean` = apply(X,
+     MARGIN = 2L, FUN = weighted.mean, w = w, na.rm = FALSE), unit = "ms")
> X <- t(X)
> gc()
          used  (Mb) gc trigger  (Mb) max used  (Mb)
Ncells 3222745 172.2    5709258 305.0  5709258 305.0
Vcells 6525665  49.8   22345847 170.5 56666022 432.4
> rowStats <- microbenchmark(rowWeightedMeans = rowWeightedMeans(X, w = w, na.rm = FALSE), `apply+weigthed.mean` = apply(X,
+     MARGIN = 1L, FUN = weighted.mean, w = w, na.rm = FALSE), unit = "ms")
Table: Benchmarking of colWeightedMeans() and apply+weigthed.mean() on 1000x100 data. The top panel shows times in milliseconds and the bottom panel shows relative times.
| expr | min | lq | mean | median | uq | max | |
|---|---|---|---|---|---|---|---|
| 1 | colWeightedMeans | 0.193951 | 0.209496 | 0.3010527 | 0.227436 | 0.2476485 | 7.450469 |
| 2 | apply+weigthed.mean | 1.477644 | 1.540457 | 1.9163656 | 1.674757 | 1.8800335 | 9.139492 |
| expr | min | lq | mean | median | uq | max | |
|---|---|---|---|---|---|---|---|
| 1 | colWeightedMeans | 1.000000 | 1.000000 | 1.000000 | 1.000000 | 1.00000 | 1.0000 |
| 2 | apply+weigthed.mean | 7.618646 | 7.353157 | 6.365549 | 7.363643 | 7.59154 | 1.2267 |
Table: Benchmarking of rowWeightedMeans() and apply+weigthed.mean() on 1000x100 data (transposed). The top panel shows times in milliseconds and the bottom panel shows relative times.
| expr | min | lq | mean | median | uq | max | |
|---|---|---|---|---|---|---|---|
| 1 | rowWeightedMeans | 0.922334 | 0.930577 | 1.003068 | 0.956406 | 1.044642 | 1.227156 |
| 2 | apply+weigthed.mean | 1.504050 | 1.524069 | 1.948271 | 1.593894 | 1.827955 | 8.985222 |
| expr | min | lq | mean | median | uq | max | |
|---|---|---|---|---|---|---|---|
| 1 | rowWeightedMeans | 1.0000 | 1.000000 | 1.000000 | 1.000000 | 1.000000 | 1.000000 |
| 2 | apply+weigthed.mean | 1.6307 | 1.637768 | 1.942313 | 1.666546 | 1.749839 | 7.321988 |
Figure: Benchmarking of colWeightedMeans() and apply+weigthed.mean() on 1000x100 data as well as rowWeightedMeans() and apply+weigthed.mean() on the same data transposed. Outliers are displayed as crosses. Times are in milliseconds.

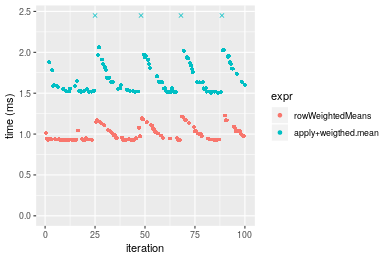 Table: Benchmarking of colWeightedMeans() and rowWeightedMeans() on 1000x100 data (original and transposed). The top panel shows times in milliseconds and the bottom panel shows relative times.
| expr | min | lq | mean | median | uq | max | |
|---|---|---|---|---|---|---|---|
| 1 | colWeightedMeans | 193.951 | 209.496 | 301.0527 | 227.436 | 247.6485 | 7450.469 |
| 2 | rowWeightedMeans | 922.334 | 930.577 | 1003.0679 | 956.406 | 1044.6420 | 1227.156 |
| expr | min | lq | mean | median | uq | max | |
|---|---|---|---|---|---|---|---|
| 1 | colWeightedMeans | 1.0000 | 1.00000 | 1.000000 | 1.000000 | 1.000000 | 1.0000000 |
| 2 | rowWeightedMeans | 4.7555 | 4.44198 | 3.331869 | 4.205165 | 4.218245 | 0.1647086 |
Figure: Benchmarking of colWeightedMeans() and rowWeightedMeans() on 1000x100 data (original and transposed). Outliers are displayed as crosses. Times are in milliseconds.

R version 3.6.1 Patched (2019-08-27 r77078)
Platform: x86_64-pc-linux-gnu (64-bit)
Running under: Ubuntu 18.04.3 LTS

Matrix products: default
BLAS:   /home/hb/software/R-devel/R-3-6-branch/lib/R/lib/libRblas.so
LAPACK: /home/hb/software/R-devel/R-3-6-branch/lib/R/lib/libRlapack.so

locale:
 [1] LC_CTYPE=en_US.UTF-8       LC_NUMERIC=C
 [3] LC_TIME=en_US.UTF-8        LC_COLLATE=en_US.UTF-8
 [5] LC_MONETARY=en_US.UTF-8    LC_MESSAGES=en_US.UTF-8
 [7] LC_PAPER=en_US.UTF-8       LC_NAME=C
 [9] LC_ADDRESS=C               LC_TELEPHONE=C
[11] LC_MEASUREMENT=en_US.UTF-8 LC_IDENTIFICATION=C

attached base packages:
[1] stats     graphics  grDevices utils     datasets  methods   base

other attached packages:
[1] microbenchmark_1.4-6    matrixStats_0.55.0-9000 ggplot2_3.2.1
[4] knitr_1.24              R.devices_2.16.0        R.utils_2.9.0
[7] R.oo_1.22.0             R.methodsS3_1.7.1       history_0.0.0-9002

loaded via a namespace (and not attached):
 [1] Biobase_2.45.0       bit64_0.9-7          splines_3.6.1
 [4] network_1.15         assertthat_0.2.1     highr_0.8
 [7] stats4_3.6.1         blob_1.2.0           robustbase_0.93-5
[10] pillar_1.4.2         RSQLite_2.1.2        backports_1.1.4
[13] lattice_0.20-38      glue_1.3.1           digest_0.6.20
[16] colorspace_1.4-1     sandwich_2.5-1       Matrix_1.2-17
[19] XML_3.98-1.20        lpSolve_5.6.13.3     pkgconfig_2.0.2
[22] genefilter_1.66.0    purrr_0.3.2          ergm_3.10.4
[25] xtable_1.8-4         mvtnorm_1.0-11       scales_1.0.0
[28] tibble_2.1.3         annotate_1.62.0      IRanges_2.18.2
[31] TH.data_1.0-10       withr_2.1.2          BiocGenerics_0.30.0
[34] lazyeval_0.2.2       mime_0.7             survival_2.44-1.1
[37] magrittr_1.5         crayon_1.3.4         statnet.common_4.3.0
[40] memoise_1.1.0        laeken_0.5.0         R.cache_0.13.0
[43] MASS_7.3-51.4        R.rsp_0.43.1         tools_3.6.1
[46] multcomp_1.4-10      S4Vectors_0.22.1     trust_0.1-7
[49] munsell_0.5.0        AnnotationDbi_1.46.1 compiler_3.6.1
[52] rlang_0.4.0          grid_3.6.1           RCurl_1.95-4.12
[55] cwhmisc_6.6          rappdirs_0.3.1       labeling_0.3
[58] bitops_1.0-6         base64enc_0.1-3      boot_1.3-23
[61] gtable_0.3.0         codetools_0.2-16     DBI_1.0.0
[64] markdown_1.1         R6_2.4.0             zoo_1.8-6
[67] dplyr_0.8.3          bit_1.1-14           zeallot_0.1.0
[70] parallel_3.6.1       Rcpp_1.0.2           vctrs_0.2.0
[73] DEoptimR_1.0-8       tidyselect_0.2.5     xfun_0.9
[76] coda_0.19-3
Total processing time was 14.37 secs.
To reproduce this report, do:
html <- matrixStats:::benchmark('colWeightedMeans')Copyright Henrik Bengtsson. Last updated on 2019-09-10 20:55:36 (-0700 UTC). Powered by RSP.
<script> var link = document.createElement('link'); link.rel = 'icon'; link.href = "data:image/png;base64,iVBORw0KGgoAAAANSUhEUgAAACAAAAAgCAMAAABEpIrGAAAA21BMVEUAAAAAAP8AAP8AAP8AAP8AAP8AAP8AAP8AAP8AAP8AAP8AAP8AAP8AAP8AAP8AAP8AAP8AAP8AAP8AAP8AAP8AAP8AAP8AAP8AAP8AAP8AAP8AAP8AAP8AAP8AAP8AAP8AAP8AAP8AAP8AAP8AAP8AAP8AAP8AAP8AAP8AAP8BAf4CAv0DA/wdHeIeHuEfH+AgIN8hId4lJdomJtknJ9g+PsE/P8BAQL9yco10dIt1dYp3d4h4eIeVlWqWlmmXl2iYmGeZmWabm2Tn5xjo6Bfp6Rb39wj4+Af//wA2M9hbAAAASXRSTlMAAQIJCgsMJSYnKD4/QGRlZmhpamtsbautrrCxuru8y8zN5ebn6Pn6+///////////////////////////////////////////LsUNcQAAAS9JREFUOI29k21XgkAQhVcFytdSMqMETU26UVqGmpaiFbL//xc1cAhhwVNf6n5i5z67M2dmYOyfJZUqlVLhkKucG7cgmUZTybDz6g0iDeq51PUr37Ds2cy2/C9NeES5puDjxuUk1xnToZsg8pfA3avHQ3lLIi7iWRrkv/OYtkScxBIMgDee0ALoyxHQBJ68JLCjOtQIMIANF7QG9G9fNnHvisCHBVMKgSJgiz7nE+AoBKrAPA3MgepvgR9TSCasrCKH0eB1wBGBFdCO+nAGjMVGPcQb5bd6mQRegN6+1axOs9nGfYcCtfi4NQosdtH7dB+txFIpXQqN1p9B/asRHToyS0jRgpV7nk4nwcq1BJ+x3Gl/v7S9Wmpp/aGquum7w3ZDyrADFYrl8vHBH+ev9AUASW1dmU4h4wAAAABJRU5ErkJggg==" document.getElementsByTagName('head')[0].appendChild(link); </script>