Making a Excel graph step by step - HendriXML/XMLScripts-Project-WaveCapture GitHub Wiki
Making a Excel graph step by step
Cloning the repository
git clone --recurse-submodules https://github.com/HendriXML/XMLScripts-Project-WaveCapture.git C:\WaveCaptureDemo
Setup/show traces on scope
Execute tool
"C:\WaveCaptureDemo\Run.cmd"
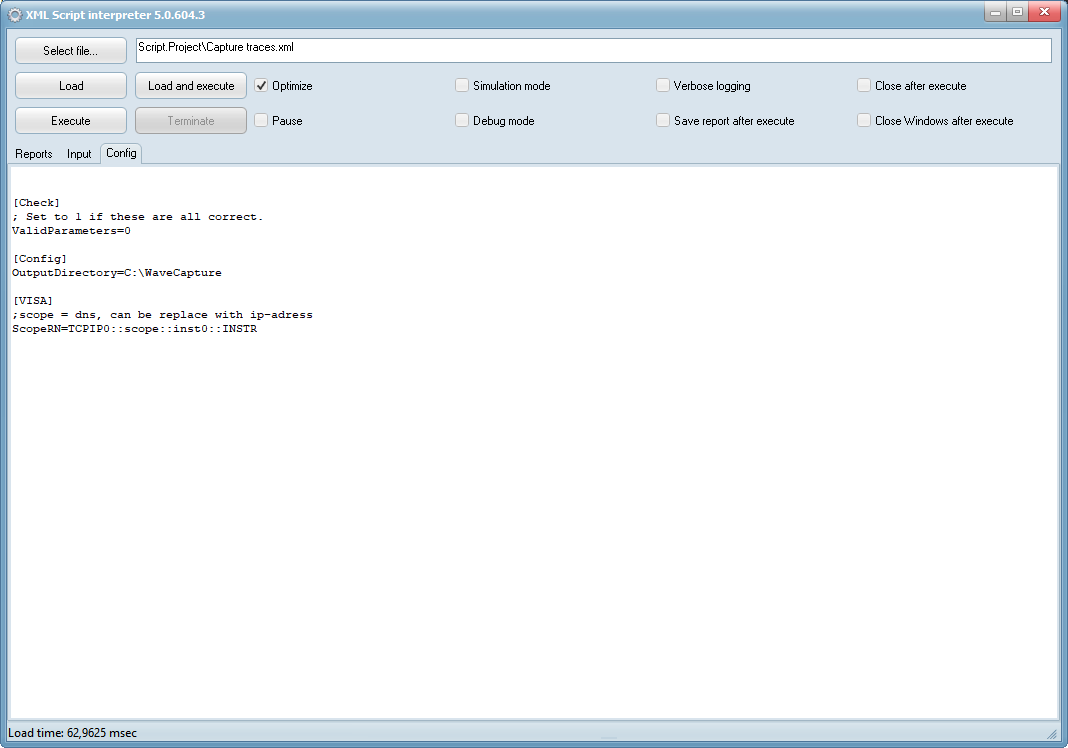
Edit config parameters
Open config tab and change parameters. Set ValidParameters=1. Otherwise the script is halted. This ensures that the parameters are valid. These parameters can be changed in the scriptfile, or loaded from an external ini-file. Check the executable wiki for the command-line options.
Execute the script
Push the execute button
Check the output directory
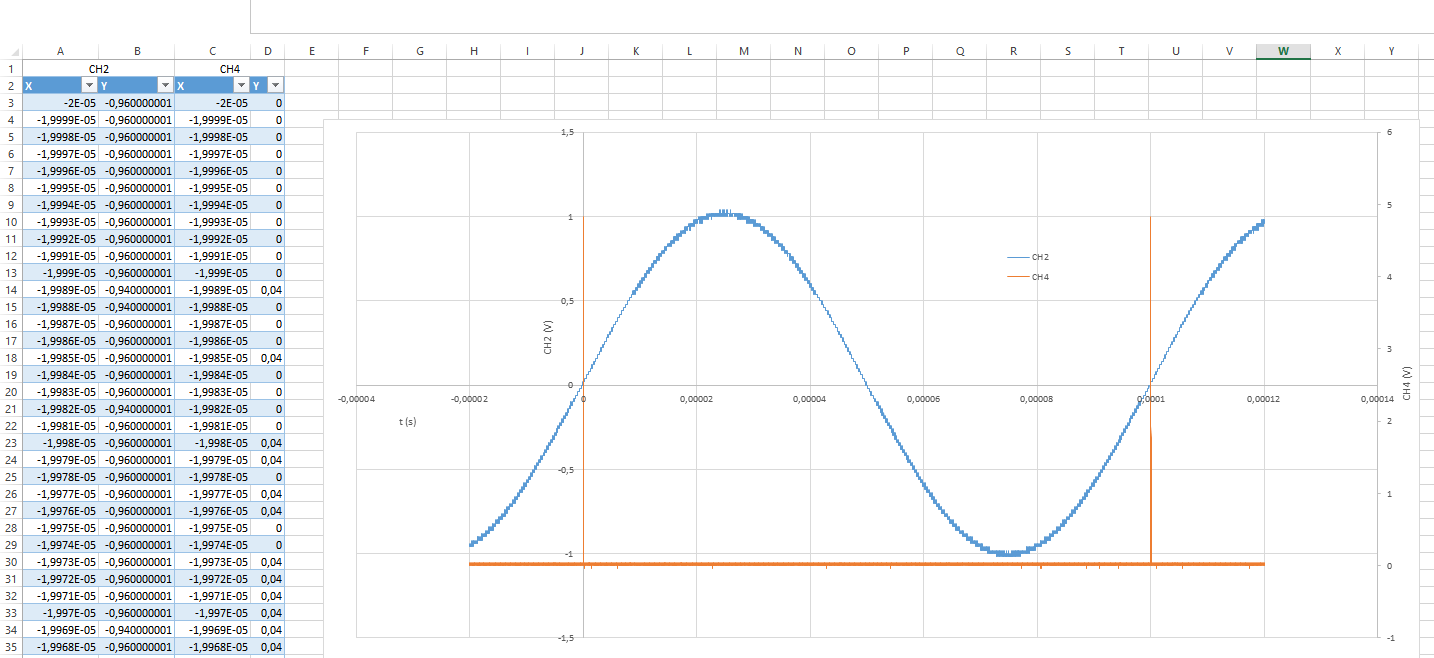
I had 2 traces active on CH2 and CH4. The WaveForm.xsd is copied and is used by Excel. "C:\Demo\CH2.xml" "C:\Demo\CH4.xml" "C:\Demo\WaveForm.xsd"
Open Excel
Make sure the developers tab is enabled
This gives more control on what to import
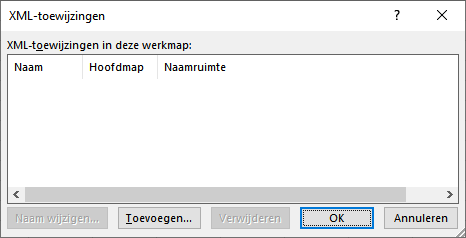
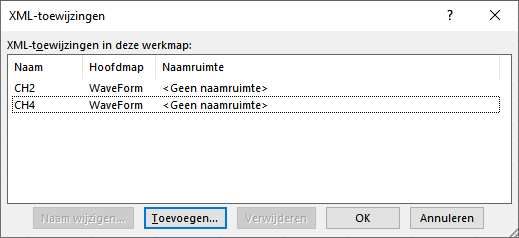
Create XML mappings
Create two mappings by importing the WaveForm.xsd. Give the mappings a meaningful name.
Drag XML mapping to create tables (2x)
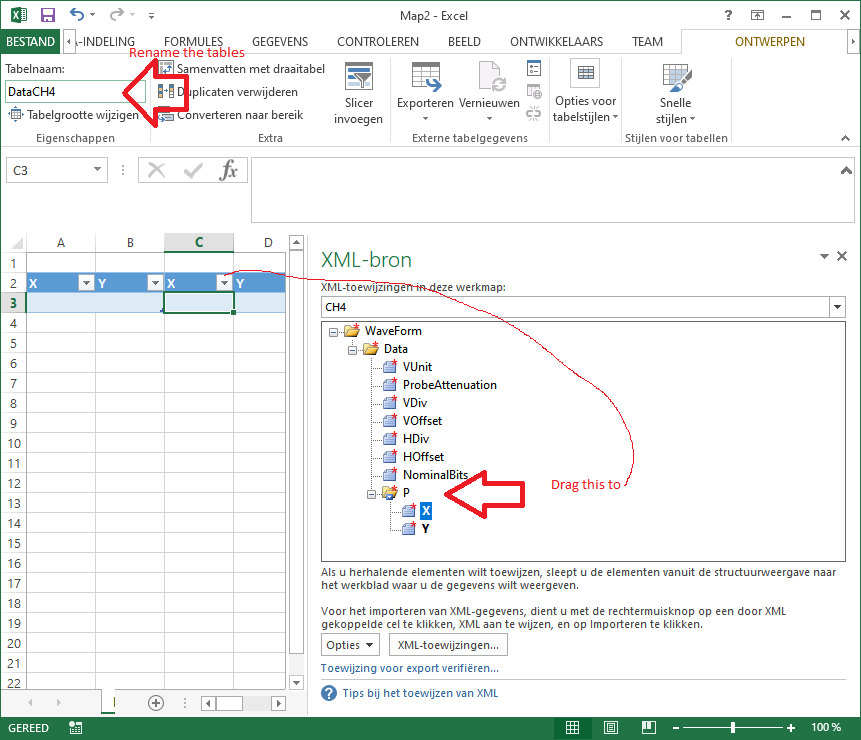
Rename the data tables
This allows using easy table referencing when adding datasets.
Import XML files into each table
Right click on each table, and choose XML import.
Add table descriptions
These descriptions can be used when adding datasets.
Create scatter diagram
Place cell cursor outside tables. And push the diagram button.
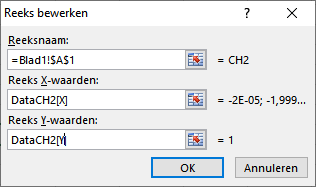
Add datasets
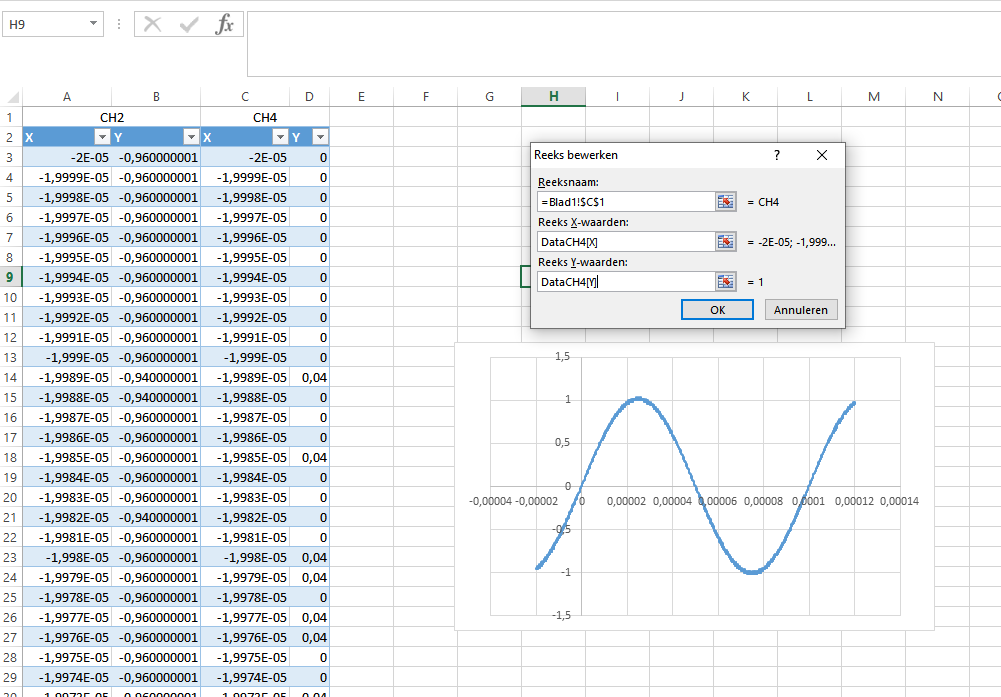
Finalize the diagram
Change CH4 to secondary axis Add titles, etc..