How to debug any php script via bughole remotely - HelloLyfing/bughole GitHub Wiki
At previous page, we talked about how to integrate bughole within your PHP website: https://github.com/HelloLyfing/bughole/wiki/Integrate-bughole-with-you-PHP-website-within-5-minutes .
This page will focus on how to debug any php script on your WebServer via bughole, and we will still take the example-php-website.com as example.
Once you know how to integrate and use bughole via example-php-website.com, you should be able to Use What You've Learned to debug whatever php website via bughole.
This page includes two parts:
- how to debug URL on example-php-website.com via bughole;
- how to debug php script invoked by CLI (also known as PHP Task) via bughole
1. How to debug URL on example-php-website.com via bughole
- open bughole frontend UI: http://example-php-website.com/static_bughole/html/bughole_ui.html
- add breakpoint. Go to BreakPoints block, click "AddNew", input below things, then click "OK"
- FilePath:
/tmp/bughole/src/example-php-website/index.php - FileNum:
12
- FilePath:
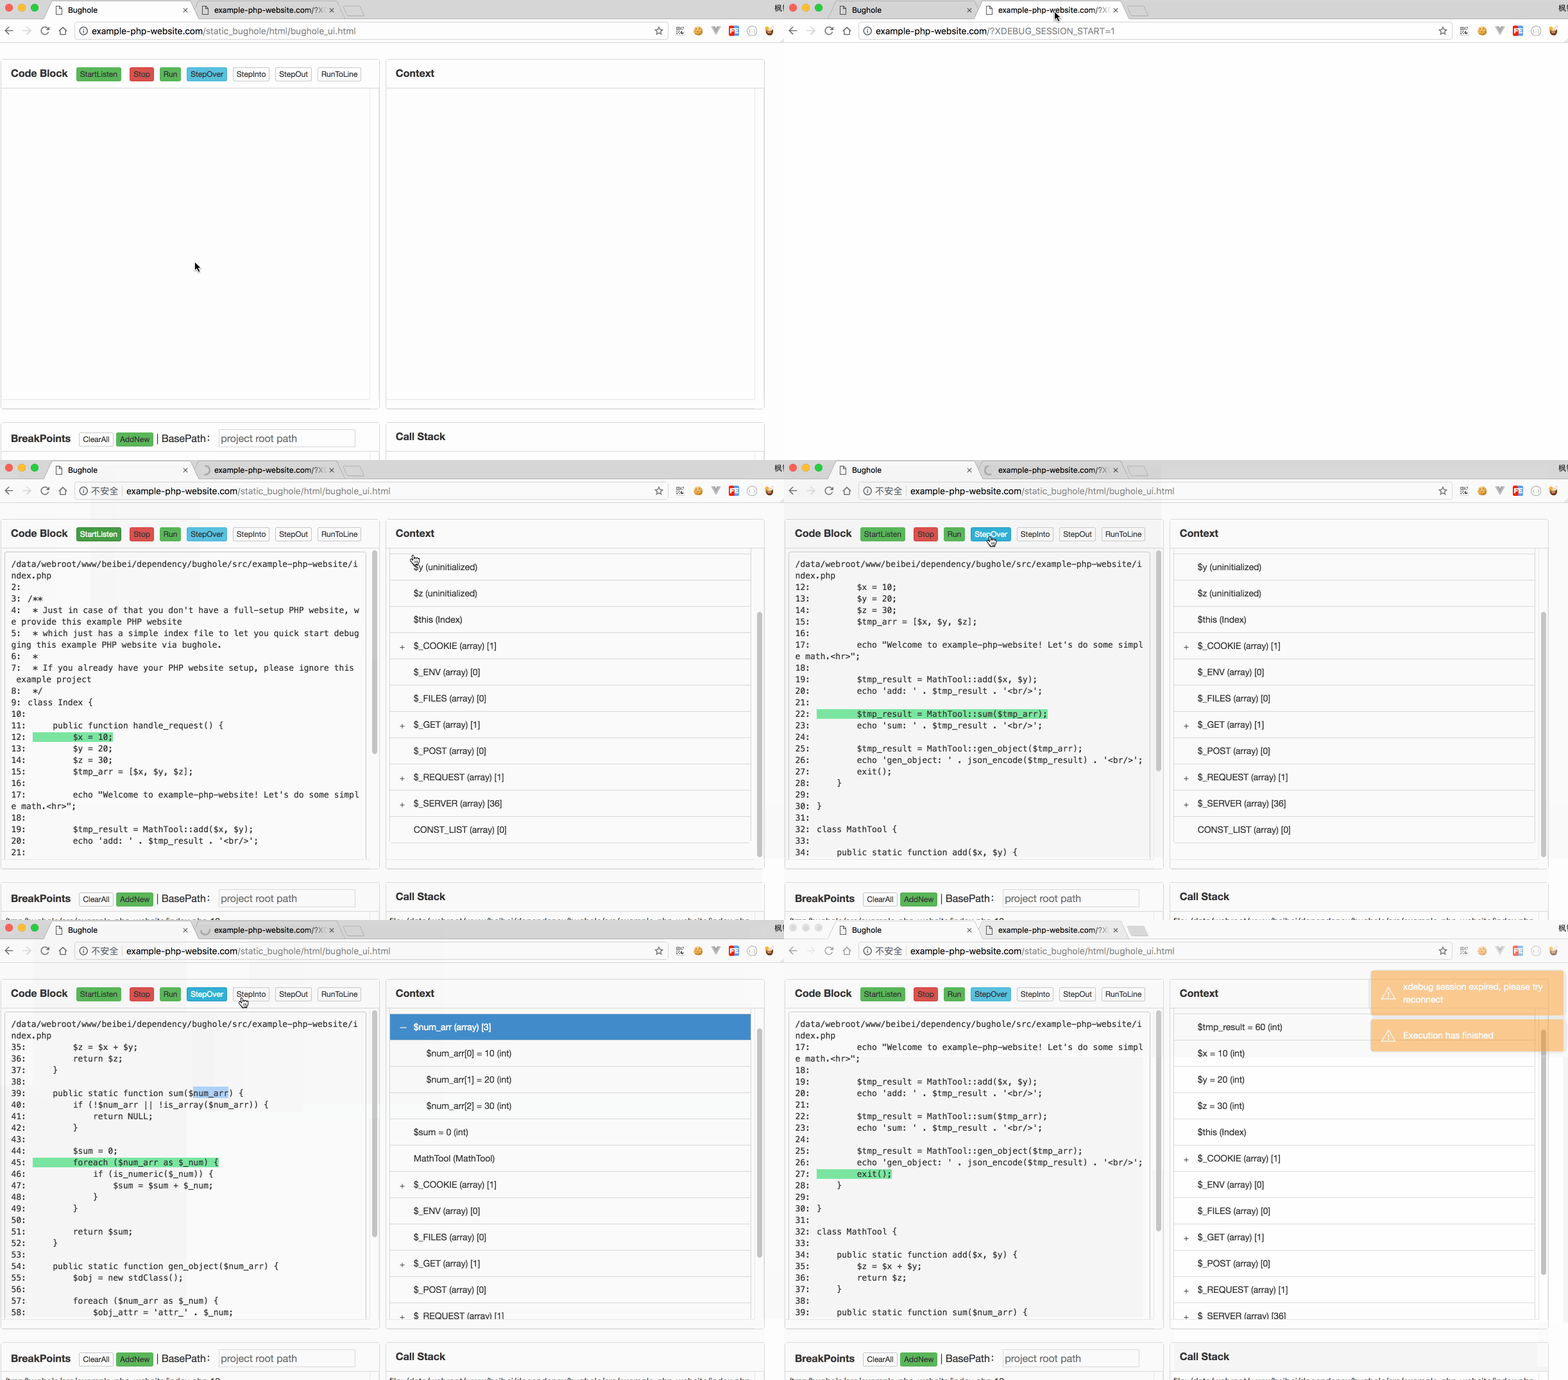
- start listen. Go to Code Block, click "StartListen" button. It will notify you to quickly visit URL to trigger Xdebug interception
- visit URL with xdebug-enabled in new tab: http://example-php-website.com/?XDEBUG_SESSION_START=1
- go back bughole frontend UI, and please enjoy your Debug Journey with bughole.
PS: xdebug-enabled HTTP request means, the request must match one of the following conditions to trigger Xdebug intercepting:
- through HTTP GET request, query parameters must contain
XDEBUG_SESSION_START=1; - or through POST request, POST parameters must contain
XDEBUG_SESSION_START=1; - or through GET or POST request, and request Cookies must contain
XDEBUG_SESSION=1;
2. How to debug php script invoked by CLI (also known as PHP Task) via bughole
- open bughole frontend UI: http://example-php-website.com/static_bughole/html/bughole_ui.html
- add breakpoint. Go to BreakPoints block, click "AddNew", input below things, then click "OK"
- FilePath:
/tmp/bughole/src/example-php-website/index.php - FileNum:
12 - Yes, still the index file we just debugged above, but this time we'll invoke it from CLI
- FilePath:
- start listen. Go to Code Block, click "StartListen" button. It will notify you to quickly visit script to trigger Xdebug interception
- invoke the script. Run below command on your
WebServer:
export XDEBUG_CONFIG="idekey=bughole" && php /tmp/bughole/src/example-php-website/index.php - go back bughole frontend UI, and enjoy your Debug Journey with bughole.
PS: Before running PHP script, we still need to set xdebug-enabled environment so that Xdebug can intercept our script. So we run export XDEBUG_CONFIG="idekey=bughole before actually running php /tmp/bughole/src/example-php-website/index.php.
Here is a simple how-to demo:

Trouble shooting
Bad Gateway ! Is the python agent running ?- The backend agent has exited. Please login your
WebServerto restart the agent:
python /tmp/bughole/src/python_agent/agent.py > /tmp/bughole-agent.log 2>&1 &
- The backend agent has exited. Please login your
Execution has finished- This exceptional msg may imply that the break points you've set were invalid. Please "ClearAll" break points and try to add new valid ones.