Home - HelikarLab/StatisticalPlatform GitHub Wiki
Table of Contents
Google Sumer of Code

Google Summer of Code 2016
List of contribution can be found here.
Google Summer of Code 2018
Overview
Data visualization is the visual representation of data in graphical form. This allows analyzing data from angles which are not clear in unorganized or tabulated data. R has many tools that can help in data visualization, analysis, and representation. Most statistical technologies require users to be familiar with the command line and/or some type of a higher level programming language, making statistics less accessible to those who are not familiar with these technologies. The goal of this project was to develop the final version of cross-platform web-based application that enables anyone to perform various statistical computations in an easy-to-use, interactive, and graphical manner.
Work this Summer
Community Bonding Phase
24th April 2018 - 13th May 2018.
In this phase I got to know more about this project from my mentor's and about their expectations from me. They wanted me to add a User Authentication System and implement 5 new functions in R for analysis:
- Density Plot
- Distribution Based Clustering
- Density Based Clustering
- Principal Component Analysis
- Support Vector Machine
By the end of this phase I was able to setup my development environment
Phase-I
14th May 2018 - 13th June 2018
At the start of this phase Mr.Achilles created a separate branch for me to push my code. I started with developing the User Authentication API using Django Rest Framework. I used django-allauth and django-rest-auth for this so that social media login could be easily integrated at a later stage if needed.(Commit 5d7b674) As of now you can signup with your email address and use this app. Since the code base was quite old it was using JSXTransformer library to convert JSX to Vanilla Javascript. So I configured Babel and Webpack for transpiling JSX to vanilla Javascript and integrated a demo React App with Django development server to see if everything was working.(Commit 54a2a2e) By the end of this phase I was also able to serve all the static file from the master branch to the main branch and install all the dependency packages using Node Package Manager.
Phase-II
14th June 2018 - 13th July 2018
The code base of this application was earlier written in React 13 so Mr.Achilles asked me to convert the whole code to React 16 and all the dependent libraries to their latest version. I started exploring React-Code-Mod to convert the code but that wasn't helpful for this project. So I started converting each component individually.(Commit f296291). I had never worked on React 13 and everything seemed very different at first, but with time everything became easy. After the conversion, still few features weren't working as there were dependent API methods which had changed. It took me time to figure those breakpoints. in this phase, I also worked on designing the UI for the Signin and Signup page. (Commit 4011808)

 The React fronted for these pages use Axios to communicate with the Django API. Also this project uses client-side Routing which was implemented with the help of React Router v4.
Phase-III
14th July 2018 - 14th August 2018
This was the most exciting phase as I had to develop five new functions. The functions were implemented in the following way.
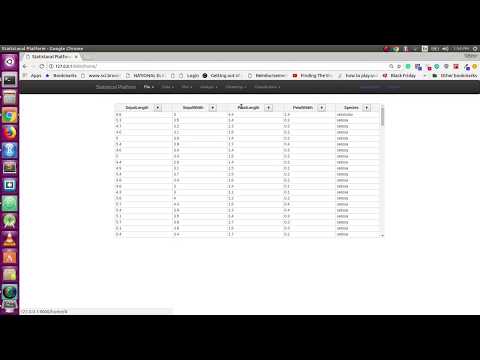
- First data is imported into the app using the read.csv function from R and displayed using Handsontable.js User also has the option to add new rows or edit data in the application itself before analysis.
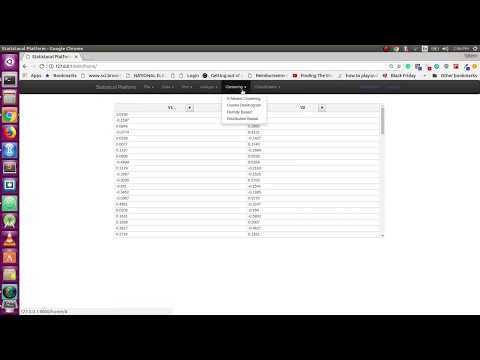
- The user can select the type of analysis to be done from the Navbar and select the input variables.
- When user selects the type of analysis the data is sent to the opencpu R server for analysis.
- R returns the plots which are displayed on the app.
- These plots can be downloaded on to the system as SVG, PNG and PDF
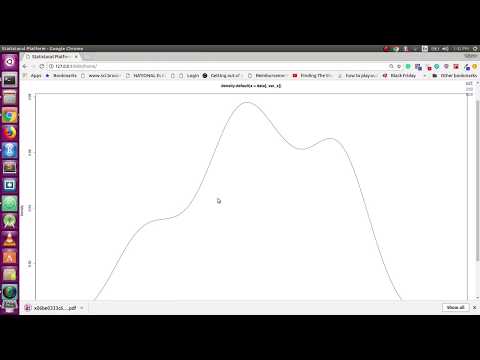
Density Plot
This uses inbuilt density function in R which returns the density values of the input variable and can be directly plotted on the webpage. (Commit 88958ed)
Density Based Clustering
Density-based clustering is a technique that allows to partition data into groups with similar characteristics (clusters) but does not require specifying the number of those groups in advance. In density-based clustering, clusters are defined as dense regions of data points separated by low-density regions. Density is measured by the number of data points within some radius. This function uses Package 'fpc' for determining the clusters and Package 'factoextra' to plot those values on the graph. (Commit d085107)
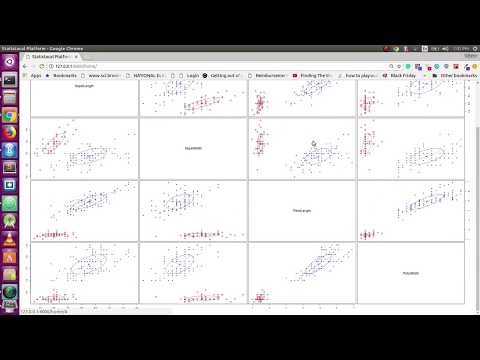
Principal Component Analysis
Principal Component Analysis is a method of extracting important variables (in form of components) from a large set of variables available in a data set. It extracts low dimensional set of features from a high dimensional data set with a motive to capture as much information as possible. Package 'ggfortify' was used to plot the graph for Principal Component Analysis. (Commit 5397683)
Distribution Based Clustering
The clustering model most closely related to statistics is based on distribution models. Distribution-based clustering produces complex models for clusters that can capture correlation and dependence between attributes. CRAN Package 'mclust' was used to aid the plot. It provides functions for parameter estimation via the Expectation-Maximization algorithm for normal mixture models with a variety of covariance structures, and functions for simulation from these models.(Commit 468be8d)
Support Vector Machine
The principle behind an SVM classifier (Support Vector Machine) algorithm is to build a hyperplane separating data for different classes. This hyperplane building procedure varies and is the main task of an SVM classifier. The main focus while drawing the hyperplane is on maximizing the distance from hyperplane to the nearest data point of either class. For implementing SVM we can use we can use 'caret' or 'e1071' package in R. I have used 'e1071' in this app.(Commit 78b61f5)
Future Work
- Integrating social media login using Google, Facebook etc.
- Integrating a mailer service for email verification. As of now, the verification link displays on the Django Terminal and you have to verify it from there.
- Improving UX for the Landing page and the Home page.
What I learned
You can get to know more about my experience on this blog post.
Acknowledgements
This year was my first time working as a student in Google's Summer of Code program. I was accepted by the organization Computational Biology @ University of Nebraska-Lincoln to work on an Interactive Web Platform for R based Data Analysis. I would like to thank my mentor's Dr. Akram Mohammed and Mr. Achilles Rasquinha from Helikar Labs for giving me this opportunity and for guiding me on this journey. Without their help and support (resources, guidance and mentorship), Statistical Platform wouldn't end up being what it is today.Mr. Achilles has always guided me in the right direction. He is super helpful and guided me throughout the project pointing out what needed to be done and how I could improve in achieving certain milestones. I enjoyed the expertise of my mentor who has guided me through the project planning and implementation approach. He is a patient listener and always understands my circumstances and motivates me to work more.