17 01 Clustering for dataset exploration - HannaAA17/Data-Scientist-With-Python-datacamp GitHub Wiki
01 Unsupervised Learning
- finds patterns in data
- e.g. clustering customers by their purchases
- Compressing the data using purchase patterns (dimension reduction)
- without a specific prediction task in mind
- Dimension = number of features
k-means clustering
- Finds clusters of samples
- Number of clusters must be specified
- Implemented in
sklearn
# Import KMeans
from sklearn.cluster import KMeans

# Create a KMeans instance with 3 clusters: model
model = KMeans(n_clusters = 3)

# Fit model to points
model.fit(points)
Cluster labels for new samples
- New samples can be assigned to existing clusters
- k-means remembers the mean of each cluster (the "centroids")
centroids = model.cluster_centers_
- Finds the nearest centroid to each new sample
# Import pyplot
import matplotlib.pyplot as plt
# Assign the columns of new_points: xs and ys
xs = new_points[:,0]
ys = new_points[:,1]
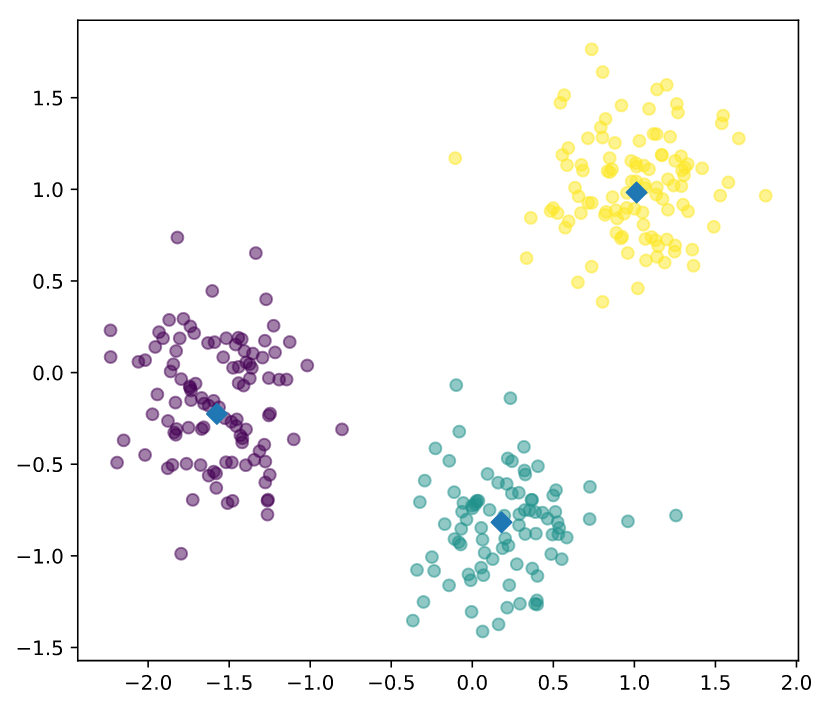
# Make a scatter plot of xs and ys, using labels to define the colors
plt.scatter(xs, ys, c=labels, alpha=0.5)
# Assign the cluster centers: centroids
centroids = model.cluster_centers_
# Assign the columns of centroids: centroids_x, centroids_y
centroids_x = centroids[:,0]
centroids_y = centroids[:,1]
# Make a scatter plot of centroids_x and centroids_y
plt.scatter(centroids_x, centroids_y, marker='D', s=50)
plt.show()
02 Evaluating a clustering
Check correspondence
# Create a DataFrame with labels and varieties as columns: df
df = pd.DataFrame({'labels': labels, 'varieties': varieties})

# Create crosstab: ct
ct = pd.crosstab(df['labels'],df['varieties'])

# Display ct
print(ct)
Measuring clustering quality
- Information such as species not available
- Using only samples and their cluster labels
- A good clustering has tight clusters
- Inertia measures clustering quality (LOWER is better)
- Distance from each sample to the centroid of its cluster
.intertia_
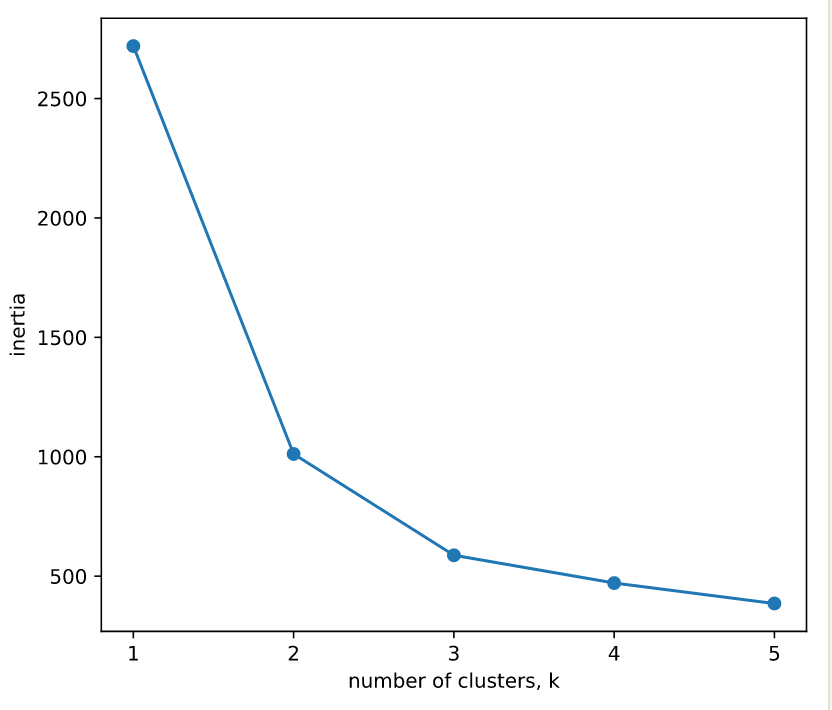
- More clusters means lower inertia
- but not too many
- Choose an 'elbow' in the inertia plot where inertia begins to decrease more slowly
ks = range(1, 6)
inertias = []

for k in ks:
    # Create a KMeans instance with k clusters: model
    model = KMeans(n_clusters = k)

    # Fit model to samples
    model.fit(samples)

    # Append the inertia to the list of inertias
    inertias.append(model.inertia_)

# Plot ks vs inertias
plt.plot(ks, inertias, '-o')
plt.xlabel('number of clusters, k')
plt.ylabel('inertia')
plt.xticks(ks)
plt.show()
03 Transforming features for better clustering
Feature variances
- In kmeans: feature variance = feature influence
StandardScaler transforms each feature to have mean 0 and variance 1
# Perform the necessary imports
from sklearn.pipeline import make_pipeline
from sklearn.preprocessing import StandardScaler
from sklearn.cluster import KMeans
import pandas as pd

# Create scaler: scaler
scaler = StandardScaler()

# Create KMeans instance: kmeans
kmeans = KMeans(n_clusters = 4)

# Create pipeline: pipeline
pipeline = make_pipeline(scaler, kmeans)

# Fit the pipeline to samples
pipeline.fit(samples)

# Calculate the cluster labels: labels
labels = pipeline.predict(samples)

# Create a DataFrame with labels and species as columns: df
df = pd.DataFrame({'labels' : labels, 'species' : species})

# Create crosstab: ct
ct = pd.crosstab(df['labels'], df['species'])

# Display ct
print(ct)
- Note that
Normalizer() is different to StandardScaler(). While StandardScaler() standardizes features (such as the features of the fish data) by removing the mean and scaling to unit variance, Normalizer() rescales each sample - here, each company's stock price - independently of the other.
- Normalizer acts row-wise and StandardScaler column-wise. Normalizer does not remove the mean and scale by deviation but scales the whole row to unit norm.