11 03 Advanced data problems - HannaAA17/Data-Scientist-With-Python-datacamp GitHub Wiki
In this chapter, you’ll dive into more advanced data cleaning problems, such as ensuring that weights are all written in kilograms instead of pounds. You’ll also gain invaluable skills that will help you verify that values have been added correctly and that missing values don’t negatively impact your analyses.
Uniformity
| Column | Unit |
|---|---|
| Temperature | 32C is also 89.6F |
| Weight | 70kg is also 11 st |
| Date | 26-11-2019 is also 26, Nov, 2019 |
Uniform currencies
# Find values of acct_cur that are equal to 'euro'
acct_eu = banking['acct_cur'] == 'euro'

# Convert acct_amount where it is in euro to dollars
banking.loc[acct_eu, 'acct_amount'] = banking.loc[acct_eu, 'acct_amount'] * 1.1

# Unify acct_cur column by changing 'euro' values to 'dollar'
banking.loc[acct_eu, 'acct_cur'] = 'dollar'

# Print unique values of acct_cur
assert banking['acct_cur'].unique() == 'dollar'
Uniform dates
pandas.to_datetime()- Can recognize most formats automatically
- Sometimes fails with erroneous or unrecognizable formats
infer_datetime_format = True: attempt to infer format of each dateerrors = 'coerce': return NA for rows where conversion failed
.dt.strftime('%d-%m-%Y')
# Print the header of account_opend
print(banking['account_opened'].head())

# Convert account_opened to datetime
banking['account_opened'] = pd.to_datetime(banking['account_opened'],
                                           # Infer datetime format
                                           infer_datetime_format = True,
                                           # Return missing value for error
                                           errors = 'coerce')

# Get year of account opened
banking['acct_year'] = banking['account_opened'].dt.strftime('%Y')

# Print acct_year
print(banking['acct_year'] )
Cross filed validation
The use of multiple fields in a dataset to sanity check data integrity
Catch inconsistency
# Store fund columns to sum against
fund_columns = ['fund_A', 'fund_B', 'fund_C', 'fund_D']

# Find rows where fund_columns row sum == inv_amount
inv_equ = banking[fund_columns].sum(axis = 1) == banking['inv_amount']

# Store consistent and inconsistent data
consistent_inv = banking[inv_equ]
inconsistent_inv = banking[~inv_equ]

# Store consistent and inconsistent data
print("Number of inconsistent investments: ", inconsistent_inv.shape[0])

# Store today's date and find ages
today = dt.date.today()
ages_manual = today.year - banking['birth_date'].dt.year

# Find rows where age column == ages_manual
age_equ = ages_manual == banking['age']

# Store consistent and inconsistent data
consistent_ages = banking[age_equ]
inconsistent_ages = banking[~age_equ]

# Store consistent and inconsistent data
print("Number of inconsistent ages: ", inconsistent_ages.shape[0])
What to do?
- Dropping data.
- Set to missing and impute.
- Apply rules from domain knowledge.
Completeness
- Missing data.
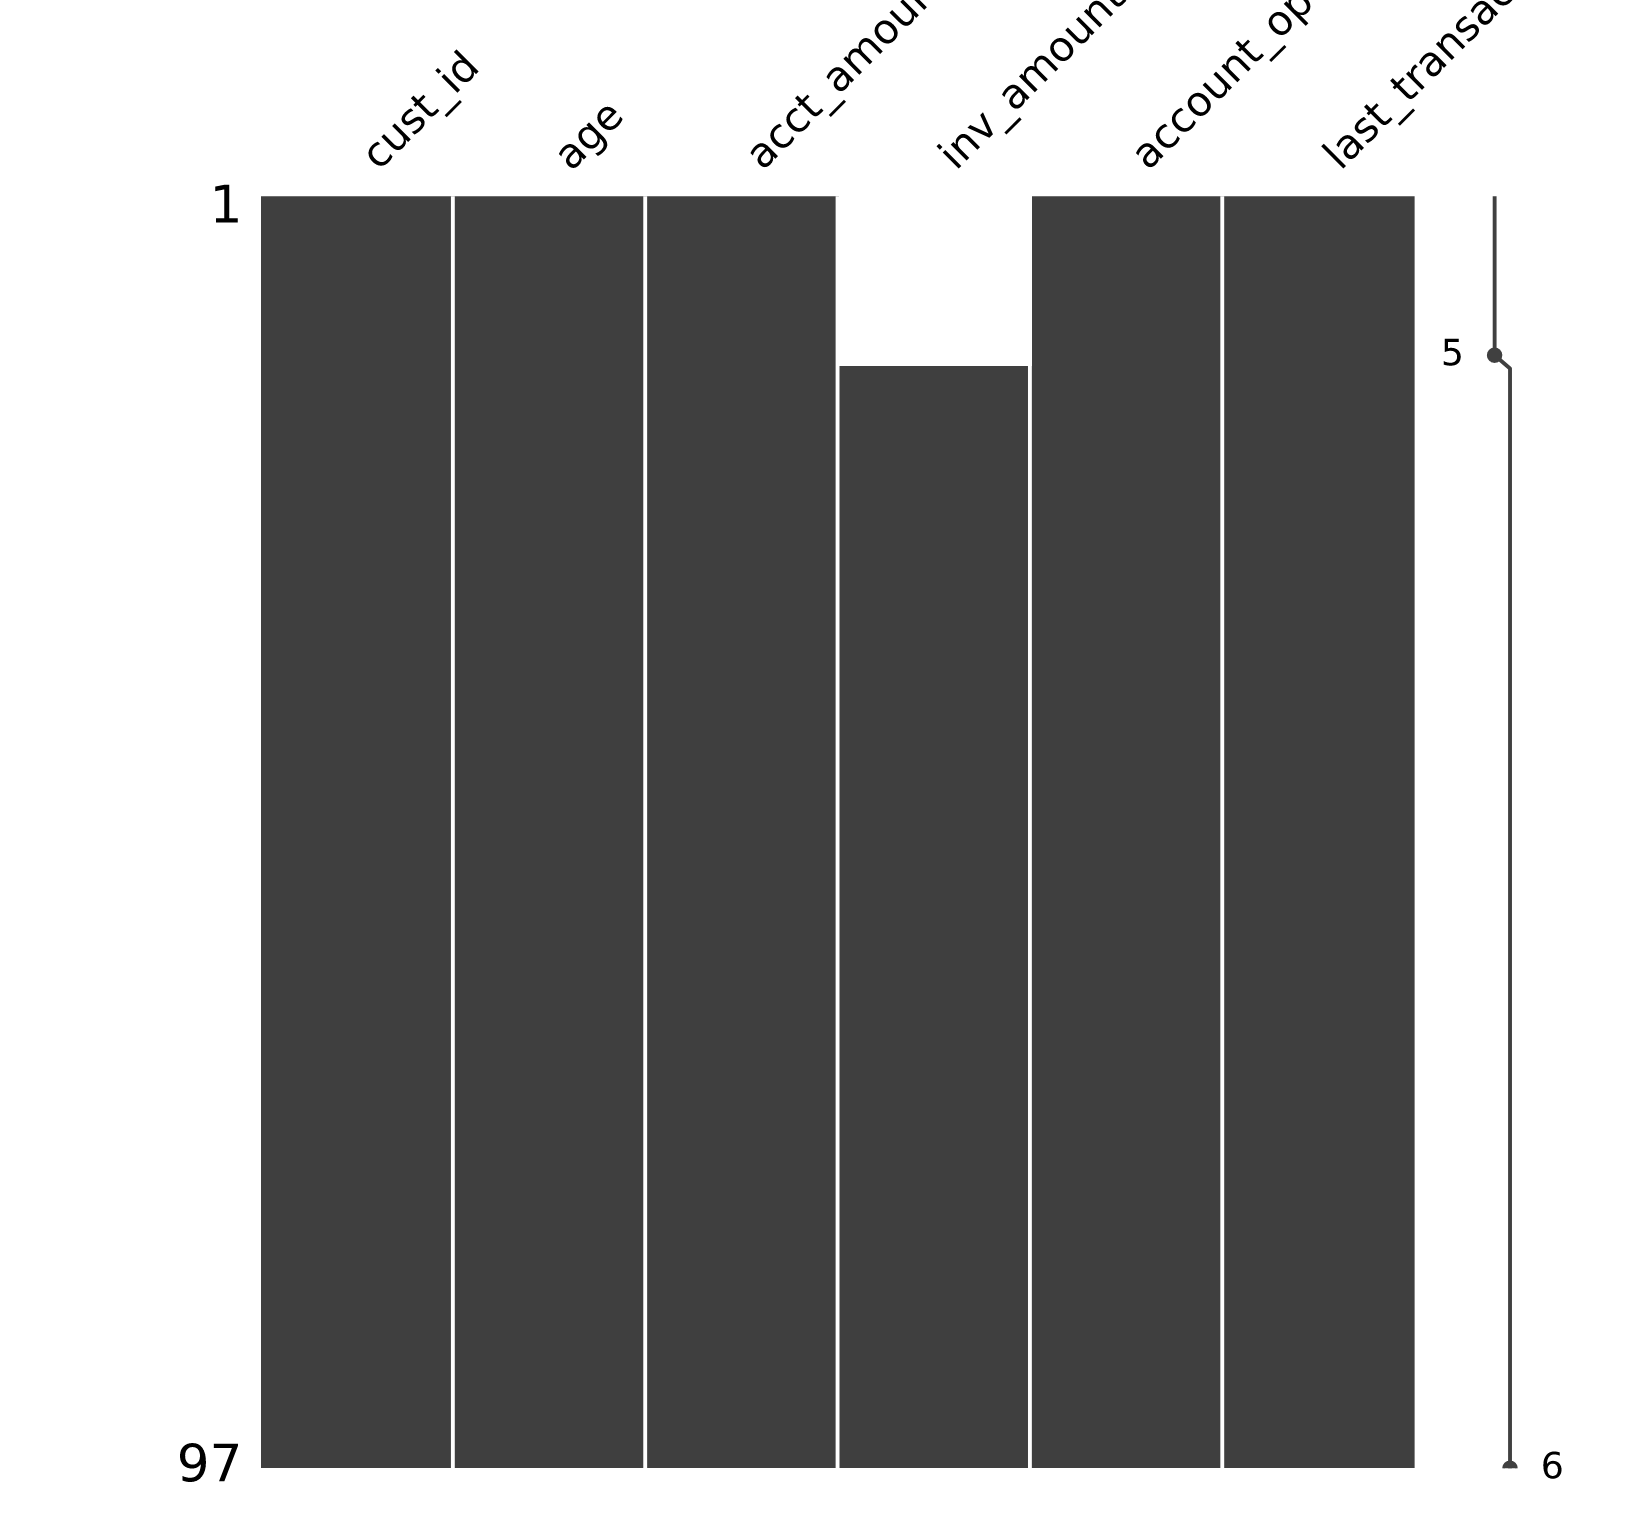
Missingno
- Useful package for visualizing and understanding missing data
Missing type
- Missing completely at Random
- No systematic relationship between missing data and other values
- Data entry errors when inputting data
- Missing at Random
- Systematic relationship between missing data and other observed values
- Missing ozone data for high temperatures
- Missing not at Random
- Systematic relationship between missing data and other unobserved values
- Missing temperature values for high temperatures
# Print number of missing values in banking
print(banking['inv_amount'].isna().sum()) #13

# Visualize missingness matrix
msno.matrix(banking)
plt.show()
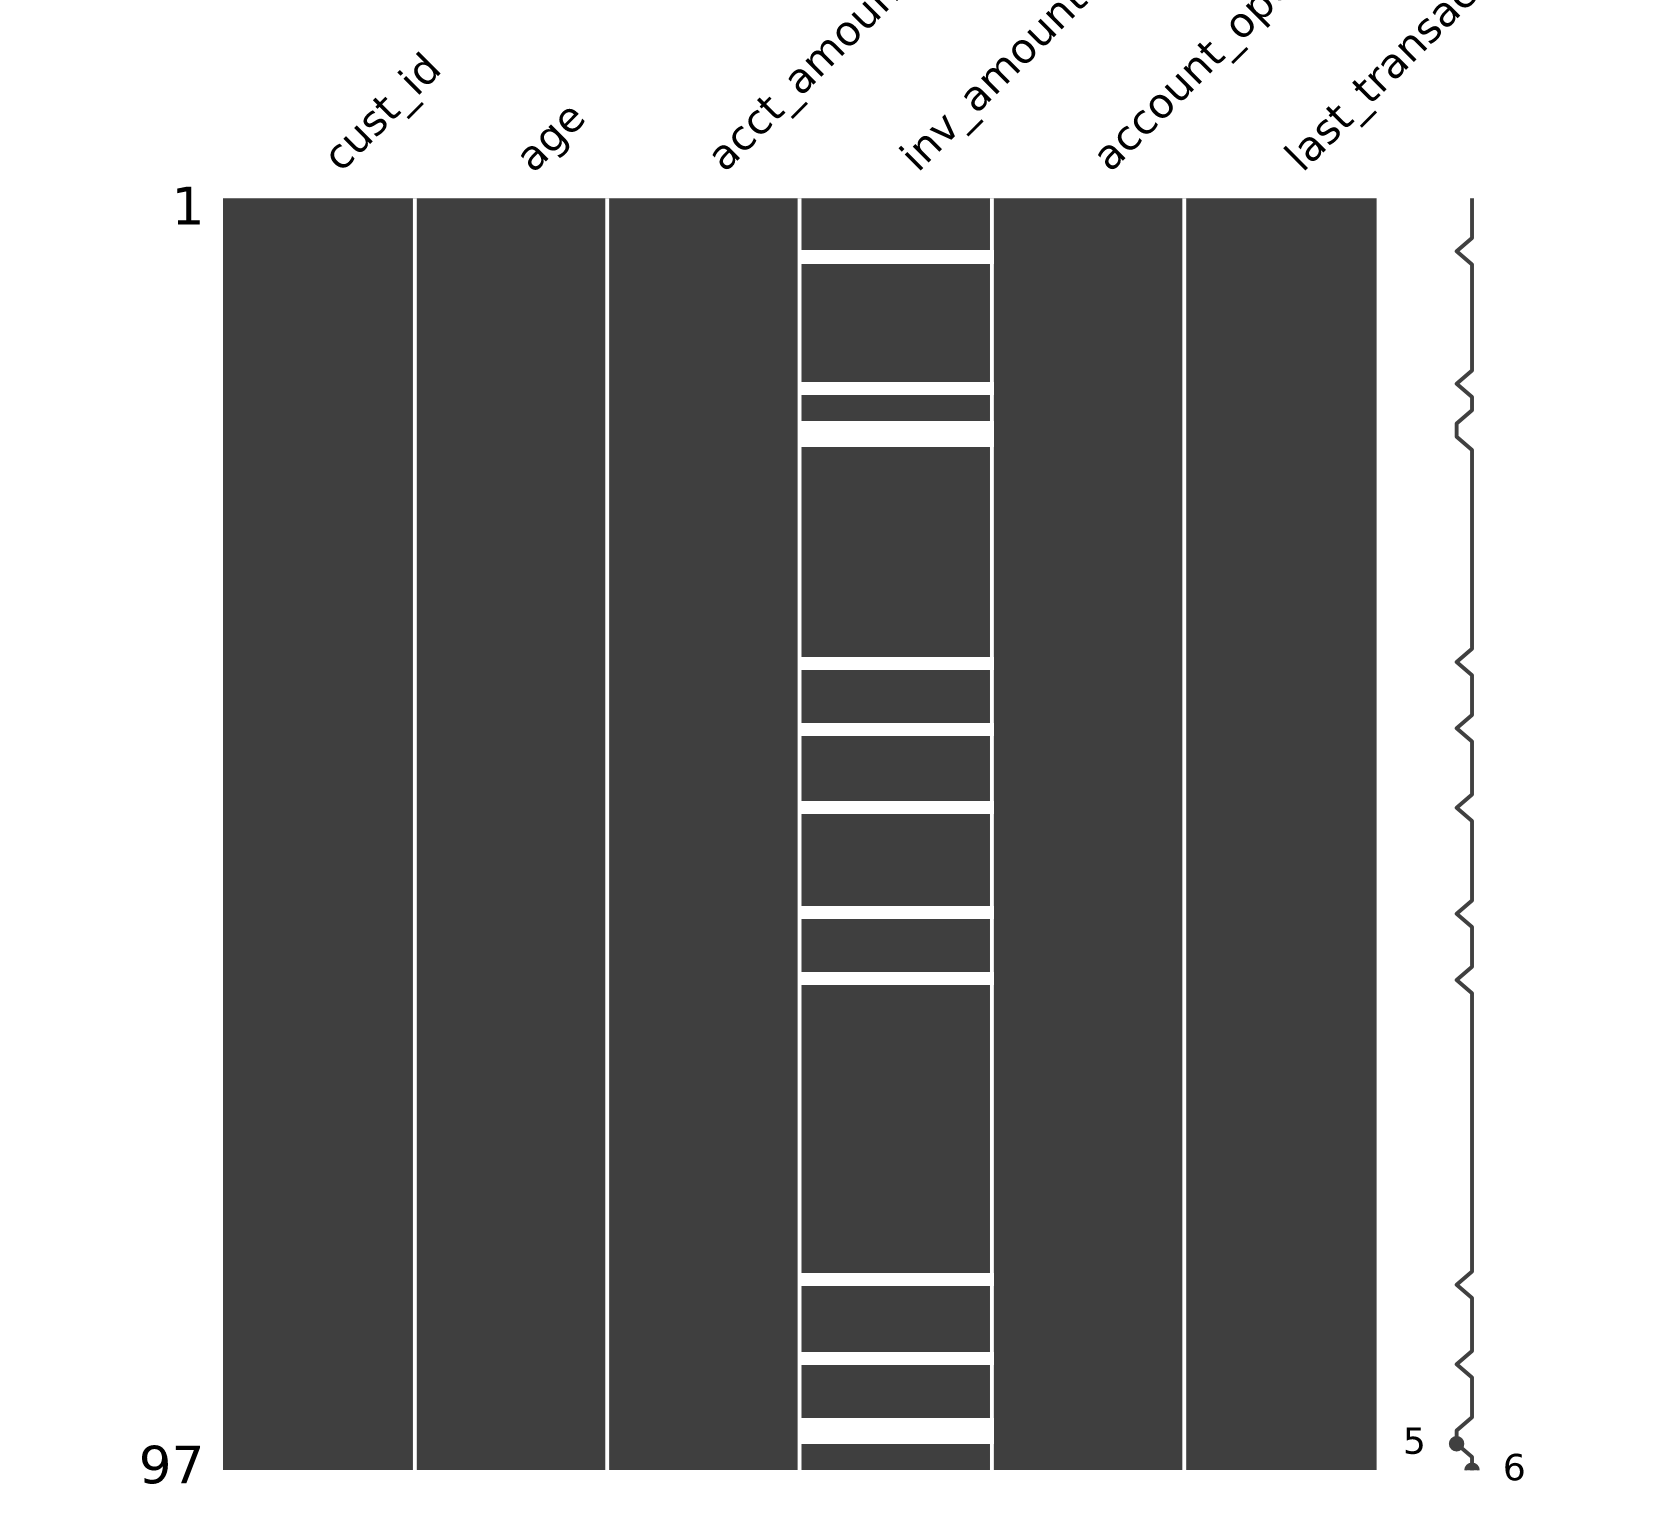
# Isolate missing and non missing values of inv_amount
missing_investors = banking[banking['inv_amount'].isna()]
investors = banking[~banking['inv_amount'].isna()]
By using .desribe() on both missing_investors and investors:
- The inv_amount is missing only for young customers, since the average age in missing_investors is 22 and the maximum age is 25.
# Sort banking by age and visualize
banking_sorted = banking.sort_values('age')
msno.matrix(banking_sorted)
plt.show()
How to deal with?
Simple approaches:
- Drop missing data :
df.dropna(subset=['CO2']) - Impute with statistical measures (mean, median, mode..) :
df.fillna({'CO2': df['CO2].mean()})
More complex approaches:
- Imputing using an algorithmic approach
- Impute with machine learning models
Drop missing value and impute missing value
# Drop missing values of cust_id
banking_fullid = banking.dropna(subset = ['cust_id'])

# Compute estimated acct_amount
acct_imp = banking_fullid['inv_amount']*5

# Impute missing acct_amount with corresponding acct_imp
banking_imputed = banking_fullid.fillna({'acct_amount':acct_imp})

# Print number of missing values
print(banking_imputed.isna().sum())