04 04 Case Study Summer Olympics - HannaAA17/Data-Scientist-With-Python-datacamp GitHub Wiki
Medals in the Summer Olympics
Loading Olympic edition DataFrame
#Import pandas
import pandas as pd

# Create file path: file_path
file_path = 'Summer Olympic medallists 1896 to 2008 - EDITIONS.tsv'

# Load DataFrame from file_path: editions
editions = pd.read_csv(file_path,sep='\t')

# Extract the relevant columns: editions, dont need 'gold', 'silver', 'bronze'
editions = editions['Edition','Grand Total','City','Country'](/HannaAA17/Data-Scientist-With-Python-datacamp/wiki/'Edition','Grand-Total','City','Country')

# Print editions DataFrame
print(editions)
output
    Edition  Grand Total         City                     Country
0      1896          151       Athens                      Greece
1      1900          512        Paris                      France
2      1904          470    St. Louis               United States
3      1908          804       London              United Kingdom
4      1912          885    Stockholm                      Sweden
5      1920         1298      Antwerp                     Belgium
6      1924          884        Paris                      France
7      1928          710    Amsterdam                 Netherlands
8      1932          615  Los Angeles               United States
9      1936          875       Berlin                     Germany
10     1948          814       London              United Kingdom
11     1952          889     Helsinki                     Finland
12     1956          885    Melbourne                   Australia
13     1960          882         Rome                       Italy
14     1964         1010        Tokyo                       Japan
15     1968         1031  Mexico City                      Mexico
16     1972         1185       Munich  West Germany (now Germany)
17     1976         1305     Montreal                      Canada
18     1980         1387       Moscow       U.S.S.R. (now Russia)
19     1984         1459  Los Angeles               United States
20     1988         1546        Seoul                 South Korea
21     1992         1705    Barcelona                       Spain
22     1996         1859      Atlanta               United States
23     2000         2015       Sydney                   Australia
24     2004         1998       Athens                      Greece
25     2008         2042      Beijing                       China
Loading IOC codes DataFrame
For the analysis that follows, you want to keep only the useful columns from ioc_codes: 'Country' and 'NOC' (the column 'NOC' contains three-letter codes representing each country).
# Import pandas
import pandas as pd

# Create the file path: file_path
file_path = 'Summer Olympic medallists 1896 to 2008 - IOC COUNTRY CODES.csv'

# Load DataFrame from file_path: ioc_codes
ioc_codes = pd.read_csv(file_path)

# Extract the relevant columns: ioc_codes
ioc_codes = ioc_codes['Country','NOC'](/HannaAA17/Data-Scientist-With-Python-datacamp/wiki/'Country','NOC')

# Print first and last 5 rows of ioc_codes
print(ioc_codes.head())
print(ioc_codes.tail())
output
          Country  NOC
0      Afghanistan  AFG
1          Albania  ALB
2          Algeria  ALG
3  American Samoa*  ASA
4          Andorra  AND
             Country  NOC
196          Vietnam  VIE
197  Virgin Islands*  ISV
198            Yemen  YEM
199           Zambia  ZAM
200         Zimbabwe  ZIM
Building medals DataFrame
You have a sequence of files summer_1896.csv, summer_1900.csv, …, summer_2008.csv, one for each Olympic edition (year).
# Import pandas
import pandas as pd

# Create empty dictionary: medals_dict
medals_dict = {}

for year in editions['Edition']:

    # Create the file path: file_path
    file_path = 'summer_{:d}.csv'.format(year)

    # Load file_path into a DataFrame: medals_dict[year]
    medals_dict[year] = pd.read_csv(file_path)

    # Extract relevant columns: medals_dict[year]
    medals_dict[year] = medals_dict[year]['Athlete','NOC','Medal'](/HannaAA17/Data-Scientist-With-Python-datacamp/wiki/'Athlete','NOC','Medal')

    # Assign year to column 'Edition' of medals_dict
    medals_dict[year]['Edition'] = year

# Concatenate medals_dict: medals
medals = pd.concat(medals_dict,ignore_index=True)

# Print first and last 5 rows of medals
print(medals.head())
print(medals.tail())
output
              Athlete  NOC   Medal  Edition
0       HAJOS, Alfred  HUN    Gold     1896
1    HERSCHMANN, Otto  AUT  Silver     1896
2   DRIVAS, Dimitrios  GRE  Bronze     1896
3  MALOKINIS, Ioannis  GRE    Gold     1896
4  CHASAPIS, Spiridon  GRE  Silver     1896
                    Athlete  NOC   Medal  Edition
29211        ENGLICH, Mirko  GER  Silver     2008
29212  MIZGAITIS, Mindaugas  LTU  Bronze     2008
29213       PATRIKEEV, Yuri  ARM  Bronze     2008
29214         LOPEZ, Mijain  CUB    Gold     2008
29215        BAROEV, Khasan  RUS  Silver     2008
Quantifying Performance
Counting medals by country/edition in a pivot table
# Construct the pivot_table: medal_counts
medal_counts = medals.pivot_table(values='Athlete',index='Edition',aggfunc='count',columns='NOC')

# Print the first & last 5 rows of medal_counts
print(medal_counts.head())
print(medal_counts.tail())
output
NOC      AFG  AHO  ALG   ANZ  ARG  ...  VIE  YUG  ZAM  ZIM   ZZX
Edition                            ...
1896     NaN  NaN  NaN   NaN  NaN  ...  NaN  NaN  NaN  NaN   6.0
1900     NaN  NaN  NaN   NaN  NaN  ...  NaN  NaN  NaN  NaN  34.0
1904     NaN  NaN  NaN   NaN  NaN  ...  NaN  NaN  NaN  NaN   8.0
1908     NaN  NaN  NaN  19.0  NaN  ...  NaN  NaN  NaN  NaN   NaN
1912     NaN  NaN  NaN  10.0  NaN  ...  NaN  NaN  NaN  NaN   NaN

[5 rows x 138 columns]
NOC      AFG  AHO  ALG  ANZ   ARG  ...  VIE   YUG  ZAM  ZIM  ZZX
Edition                            ...
1992     NaN  NaN  2.0  NaN   2.0  ...  NaN   NaN  NaN  NaN  NaN
1996     NaN  NaN  3.0  NaN  20.0  ...  NaN  26.0  1.0  NaN  NaN
2000     NaN  NaN  5.0  NaN  20.0  ...  1.0  26.0  NaN  NaN  NaN
2004     NaN  NaN  NaN  NaN  47.0  ...  NaN   NaN  NaN  3.0  NaN
2008     1.0  NaN  2.0  NaN  51.0  ...  1.0   NaN  NaN  4.0  NaN

[5 rows x 138 columns]
Computing fraction of medals per Olympic edition
# Set Index of editions: totals
totals = editions.set_index('Edition')

# Reassign totals['Grand Total']: totals is a Pandas Series
totals = totals['Grand Total']

# Divide medal_counts by totals: fractions
fractions = medal_counts.divide(totals,axis='rows')

# Print first & last 5 rows of fractions
print(fractions.head())
print(fractions.tail())
output
NOC      AFG  AHO  ALG       ANZ  ARG  ...  VIE  YUG  ZAM  ZIM       ZZX
Edition                                ...
1896     NaN  NaN  NaN       NaN  NaN  ...  NaN  NaN  NaN  NaN  0.039735
1900     NaN  NaN  NaN       NaN  NaN  ...  NaN  NaN  NaN  NaN  0.066406
1904     NaN  NaN  NaN       NaN  NaN  ...  NaN  NaN  NaN  NaN  0.017021
1908     NaN  NaN  NaN  0.023632  NaN  ...  NaN  NaN  NaN  NaN       NaN
1912     NaN  NaN  NaN  0.011299  NaN  ...  NaN  NaN  NaN  NaN       NaN

[5 rows x 138 columns]
NOC          AFG  AHO       ALG  ANZ       ARG  ...       VIE       YUG       ZAM       ZIM  ZZX
Edition                                         ...
1992         NaN  NaN  0.001173  NaN  0.001173  ...       NaN       NaN       NaN       NaN  NaN
1996         NaN  NaN  0.001614  NaN  0.010758  ...       NaN  0.013986  0.000538       NaN  NaN
2000         NaN  NaN  0.002481  NaN  0.009926  ...  0.000496  0.012903       NaN       NaN  NaN
2004         NaN  NaN       NaN  NaN  0.023524  ...       NaN       NaN       NaN  0.001502  NaN
2008     0.00049  NaN  0.000979  NaN  0.024976  ...  0.000490       NaN       NaN  0.001959  NaN

[5 rows x 138 columns]
Computing percentage change in fraction of medals won
The expanding mean provides a way to see this down each column. It is the value of the mean with all the data available up to that point in time.
# Apply the expanding mean: mean_fractions
mean_fractions = fractions.expanding().mean()

# Compute the percentage change: fractions_change
fractions_change = mean_fractions.pct_change()*100

# Reset the index of fractions_change: fractions_change ??why reset
fractions_change = fractions_change.reset_index()

# Print first & last 5 rows of fractions_change
print(fractions_change.head())
print(fractions_change.tail())
output
NOC  Edition  AFG  AHO  ALG        ANZ  ...  VIE  YUG  ZAM  ZIM        ZZX
0       1896  NaN  NaN  NaN        NaN  ...  NaN  NaN  NaN  NaN        NaN
1       1900  NaN  NaN  NaN        NaN  ...  NaN  NaN  NaN  NaN  33.561198
2       1904  NaN  NaN  NaN        NaN  ...  NaN  NaN  NaN  NaN -22.642384
3       1908  NaN  NaN  NaN        NaN  ...  NaN  NaN  NaN  NaN   0.000000
4       1912  NaN  NaN  NaN -26.092774  ...  NaN  NaN  NaN  NaN   0.000000

[5 rows x 139 columns]
NOC  Edition  AFG  AHO        ALG  ANZ  ...       VIE       YUG        ZAM        ZIM  ZZX
21      1992  NaN  0.0  -7.214076  0.0  ...       NaN  0.000000   0.000000   0.000000  0.0
22      1996  NaN  0.0   8.959211  0.0  ...       NaN -2.667732 -10.758472   0.000000  0.0
23      2000  NaN  0.0  19.762488  0.0  ...       NaN -2.696445   0.000000   0.000000  0.0
24      2004  NaN  0.0   0.000000  0.0  ...  0.000000  0.000000   0.000000 -43.491929  0.0
25      2008  NaN  0.0  -8.197807  0.0  ... -0.661117  0.000000   0.000000 -23.316533  0.0

[5 rows x 139 columns]
Reshaping and plotting
Building hosts DataFrame
# Import pandas
import pandas as pd

# Left join editions and ioc_codes: hosts
hosts = pd.merge(editions,ioc_codes,on='Country',how='left')

# Extract relevant columns and set index: hosts
hosts = hosts['Edition','NOC'](/HannaAA17/Data-Scientist-With-Python-datacamp/wiki/'Edition','NOC').set_index('Edition')

# Fix missing 'NOC' values of hosts
print(hosts.loc[hosts.NOC.isnull()])
hosts.loc[1972, 'NOC'] = 'FRG'
hosts.loc[1980, 'NOC'] = 'URS'
hosts.loc[1988, 'NOC'] = 'KOR'

# Reset Index of hosts: hosts
hosts = hosts.reset_index()

# Print hosts
print(hosts)
output
         NOC
Edition
1972     NaN
1980     NaN
1988     NaN
    Edition  NOC
0      1896  GRE
1      1900  FRA
2      1904  USA
3      1908  GBR
4      1912  SWE
5      1920  BEL
6      1924  FRA
7      1928  NED
8      1932  USA
9      1936  GER
10     1948  GBR
11     1952  FIN
12     1956  AUS
13     1960  ITA
14     1964  JPN
15     1968  MEX
16     1972  FRG
17     1976  CAN
18     1980  URS
19     1984  USA
20     1988  KOR
21     1992  ESP
22     1996  USA
23     2000  AUS
24     2004  GRE
25     2008  CHN
Reshaping for analysis
reshape fraction_change
# Import pandas
import pandas as pd

# Reshape fractions_change: reshaped
reshaped = pd.melt(fractions_change, id_vars='Edition',value_name='Change')

# Print reshaped.shape and fractions_change.shape
print(reshaped.shape, fractions_change.shape)

# Extract rows from reshaped where 'NOC' == 'CHN': chn
chn = reshaped[reshaped['NOC']=='CHN']

# Print last 5 rows of chn with .tail()
print(chn.tail())
output
(3588, 3) (26, 139)
     Edition  NOC     Change
567     1992  CHN   4.240630
568     1996  CHN   7.860247
569     2000  CHN  -3.851278
570     2004  CHN   0.128863
571     2008  CHN  13.251332
Merging to compute influence
# Import pandas
import pandas as pd

# Merge reshaped and hosts: merged
merged = pd.merge(reshaped,hosts,how="inner")

# Print first 5 rows of merged
print(merged.head())

# Set Index of merged and sort it: influence
influence = merged.set_index('Edition').sort_index()

# Print first 5 rows of influence
print(influence.head())
output
   Edition  NOC     Change
0     1956  AUS  54.615063
1     2000  AUS  12.554986
2     1920  BEL  54.757887
3     1976  CAN  -2.143977
4     2008  CHN  13.251332
         NOC      Change
Edition
1896     GRE         NaN
1900     FRA  198.002486
1904     USA  199.651245
1908     GBR  134.489218
1912     SWE   71.896226
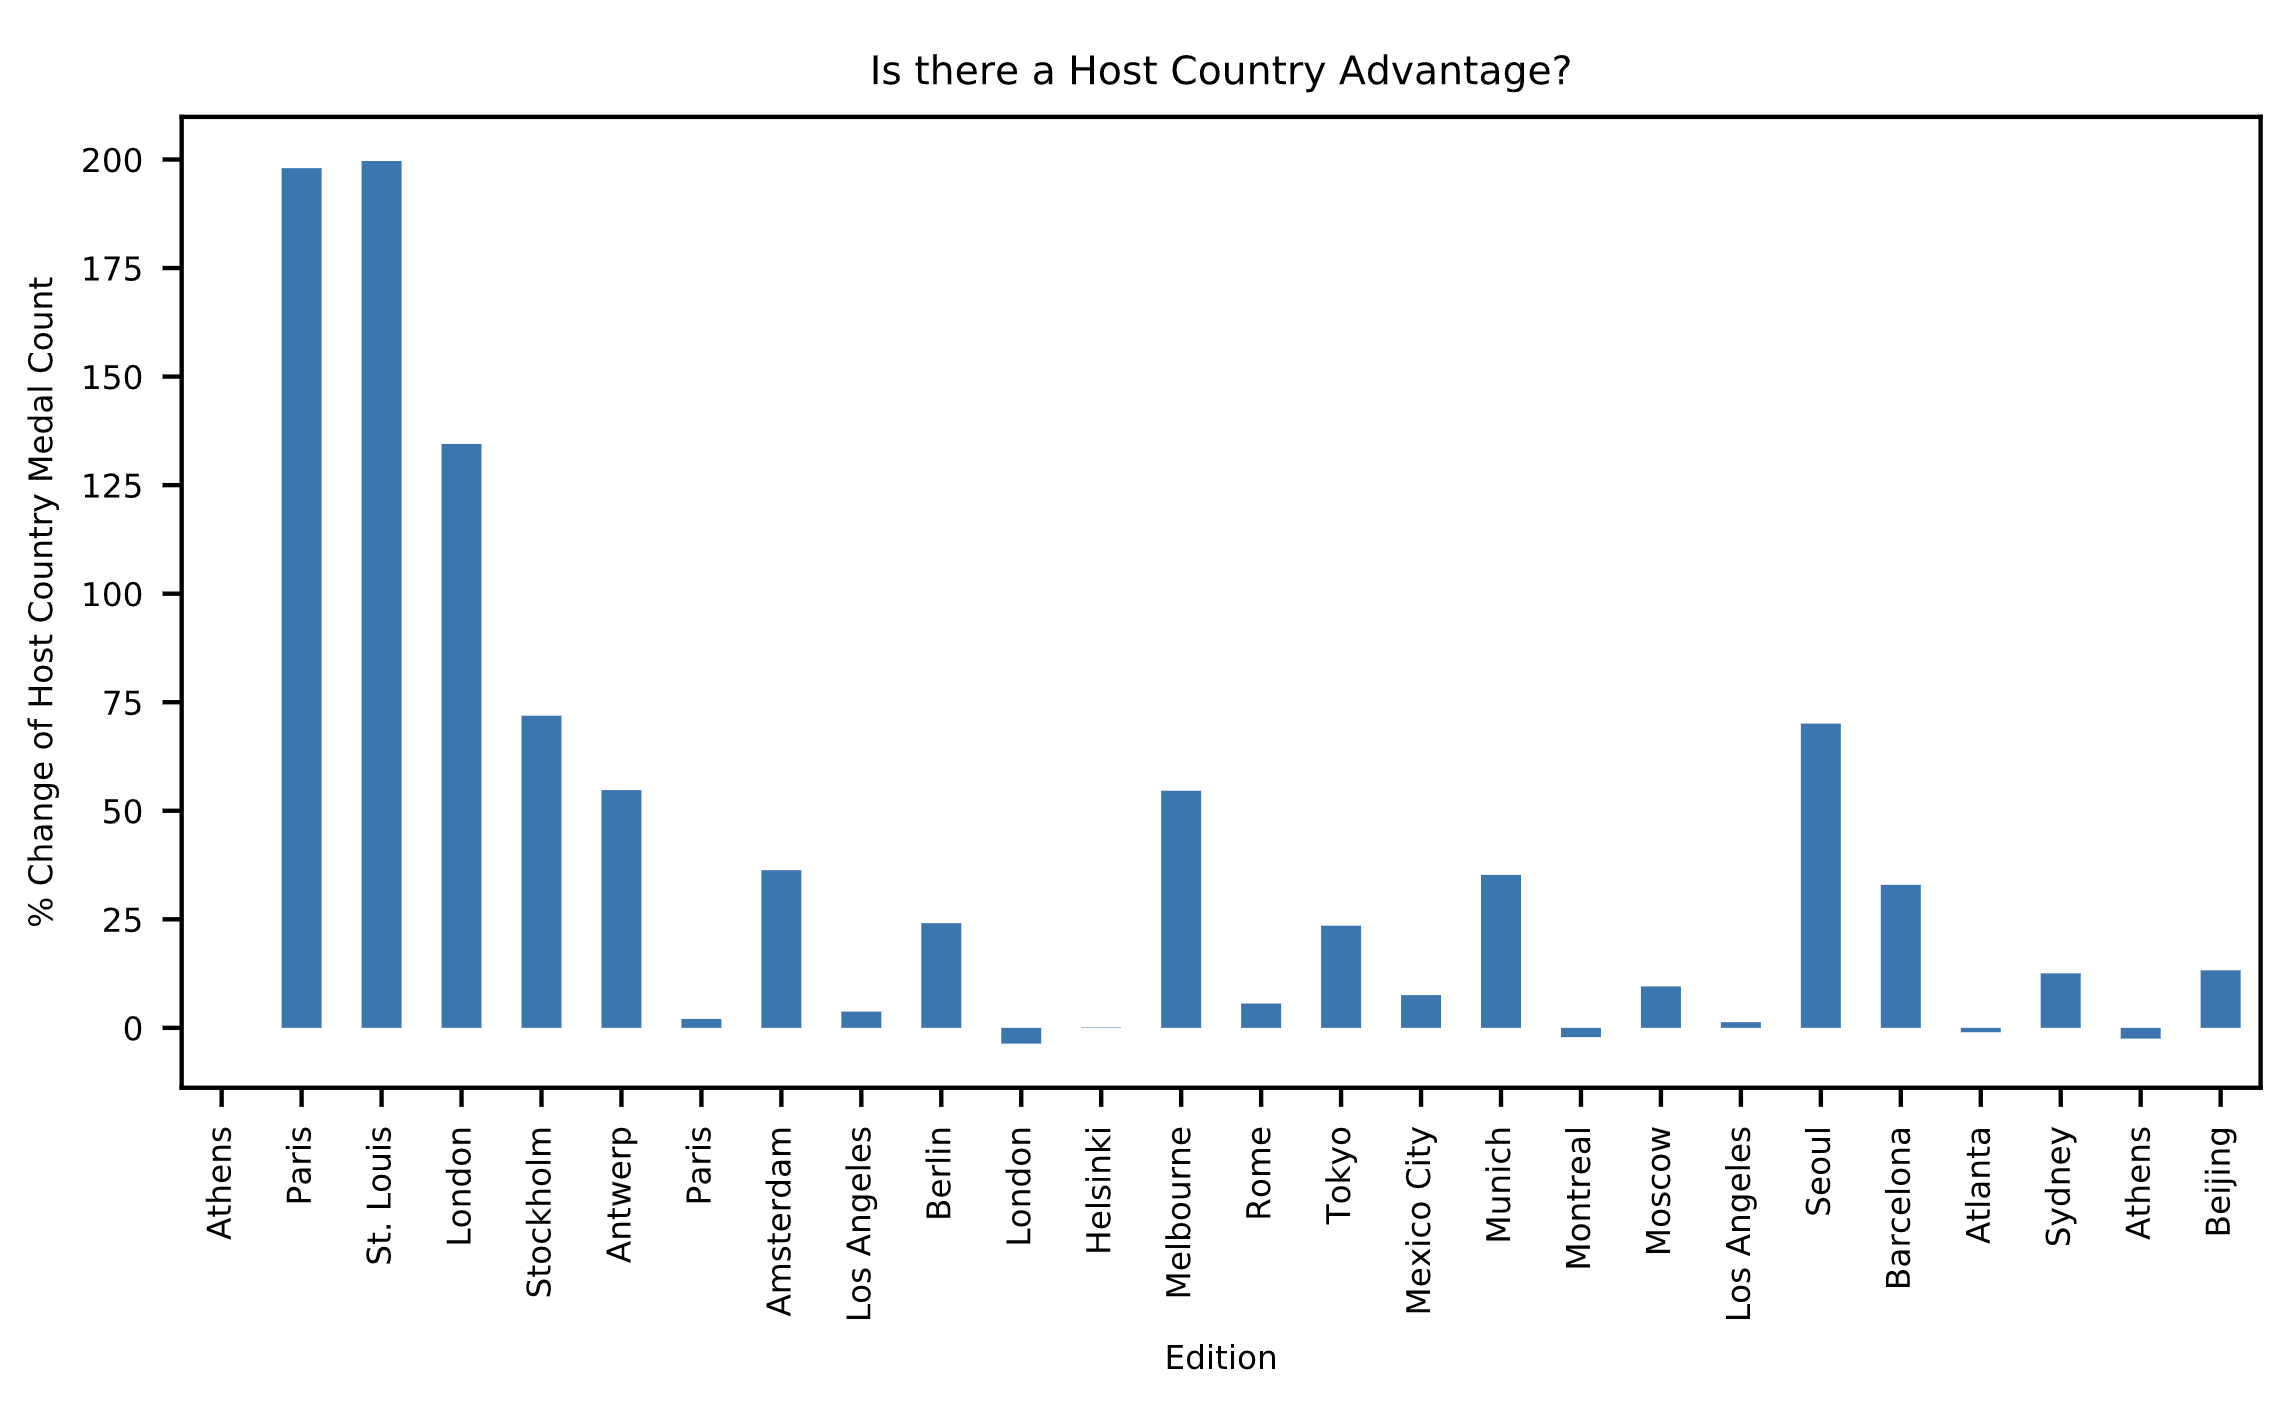
Plotting influence of host country
# Import pyplot
import matplotlib.pyplot as plt

# Extract influence['Change']: change
change = influence['Change']

# Make bar plot of change: ax
ax = change.plot(kind='bar')

# Customize the plot to improve readability
ax.set_ylabel("% Change of Host Country Medal Count")
ax.set_title("Is there a Host Country Advantage?")
ax.set_xticklabels(editions['City'])

# Display the plot
plt.show()