03 04 Creating and Visualizing DataFrames - HannaAA17/Data-Scientist-With-Python-datacamp GitHub Wiki
Visualizing data
- Histogram
df["columns"].hist() - Bar plots
(pandas series).plot(kind="bar",title="") - Line Plots
- Scatter plots
dog_pack.plot(x="height_cm", y="weight_kg", kind="scatter") - Layering Plot
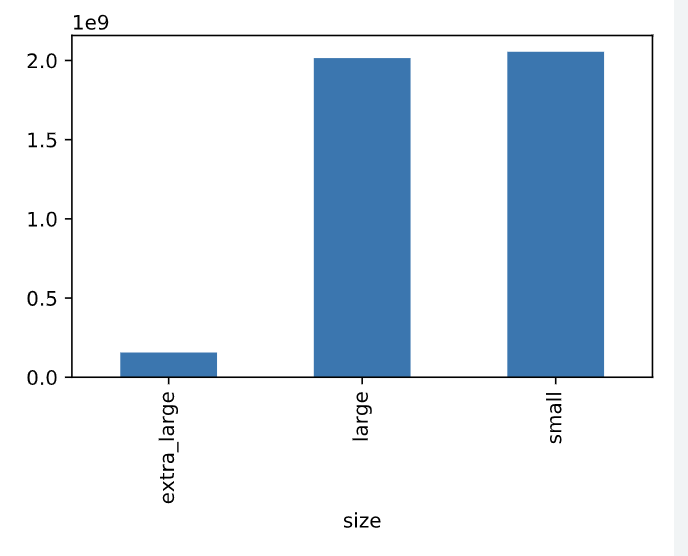
Bar Plot
# Import matplotlib.pyplot with alias plt
import matplotlib.pyplot as plt

# Look at the first few rows of data
print(avocados.head())

# Get the total number of avocados sold of each size
nb_sold_by_size = avocados.groupby("size")["nb_sold"].sum()

# Create a bar plot of the number of avocados sold by size
nb_sold_by_size.plot(kind="bar")

# Show the plot
plt.show()
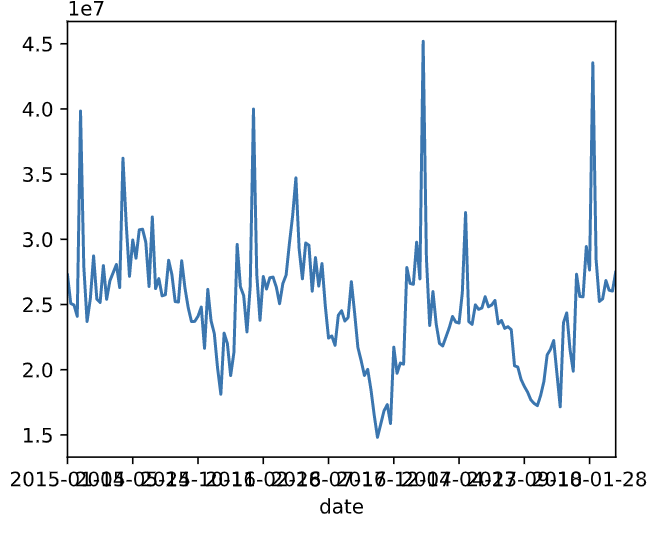
Line Plot
# Import matplotlib.pyplot with alias plt
import matplotlib.pyplot as plt

# Get the total number of avocados sold on each date
nb_sold_by_date = avocados.groupby("date")["nb_sold"].sum()

# Create a line plot of the number of avocados sold by date
nb_sold_by_date.plot(kind="line")

# Show the plot
plt.show()
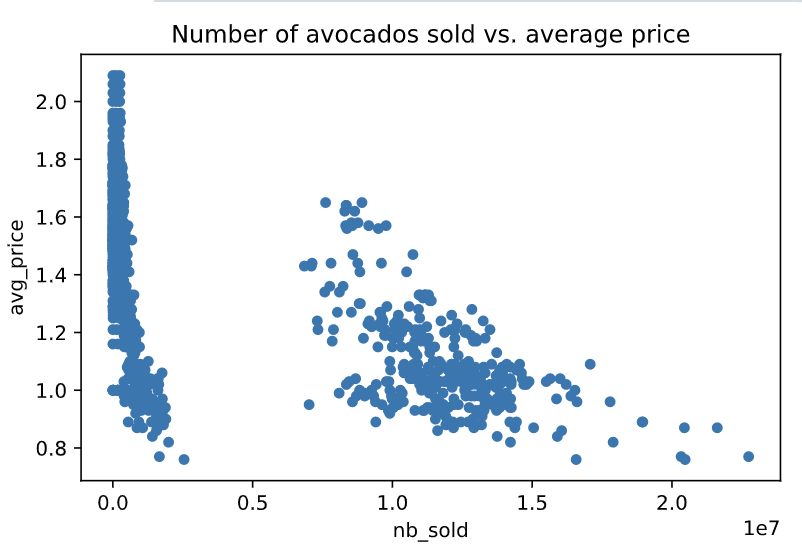
Scatter Plot
# Scatter plot of nb_sold vs avg_price with title
avocados.plot(x="nb_sold",y="avg_price",kind="scatter",title="Number of avocados sold vs. average price")

# Show the plot
plt.show()
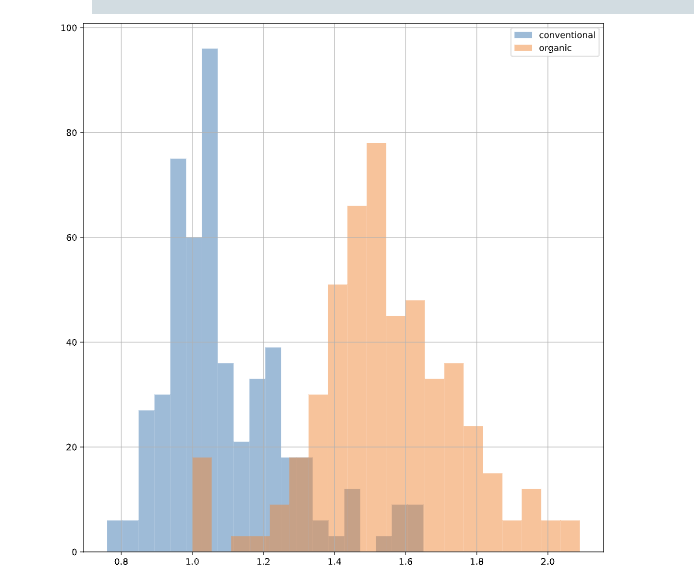
layering plot
# Modify bins to 20 , transparency = 0.5
avocados[avocados["type"] == "conventional"]["avg_price"].hist(bins=20,alpha=0.5)

# Modify bins to 20
avocados[avocados["type"] == "organic"]["avg_price"].hist(bins=20,alpha=0.5)

# Add a legend
plt.legend(["conventional", "organic"])

# Show the plot
plt.show()
Missing data
.isna(): to detect weather each data is missing.isna().any(): if there's at least one missing value.isna().sum()- remove missing values:
.dropna() - replacing missing values:
.fillna(0)
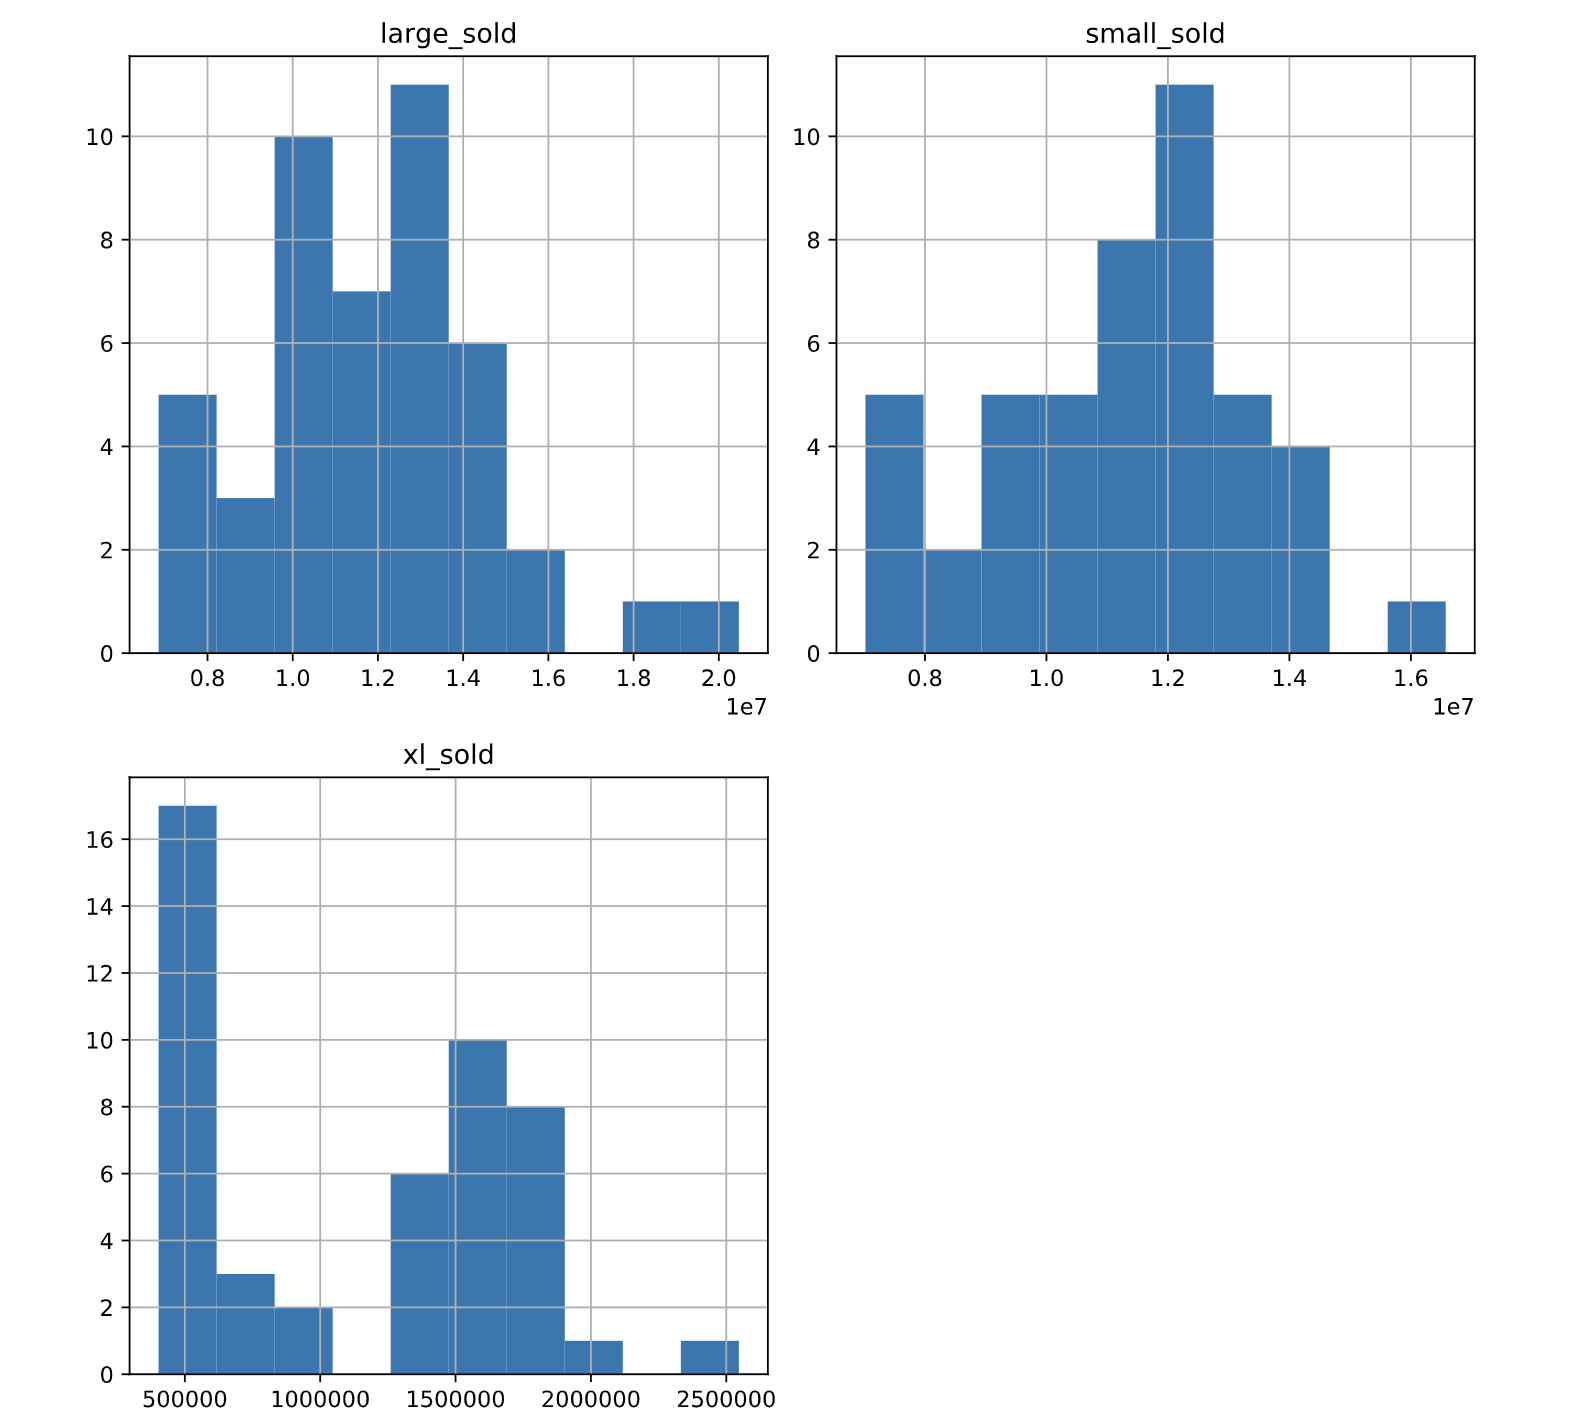
Replacing missing values
To see how replacing missing values can affect the distribution
# From previous step
cols_with_missing = ["small_sold", "large_sold", "xl_sold"]
avocados_2016[cols_with_missing].hist()
plt.show()
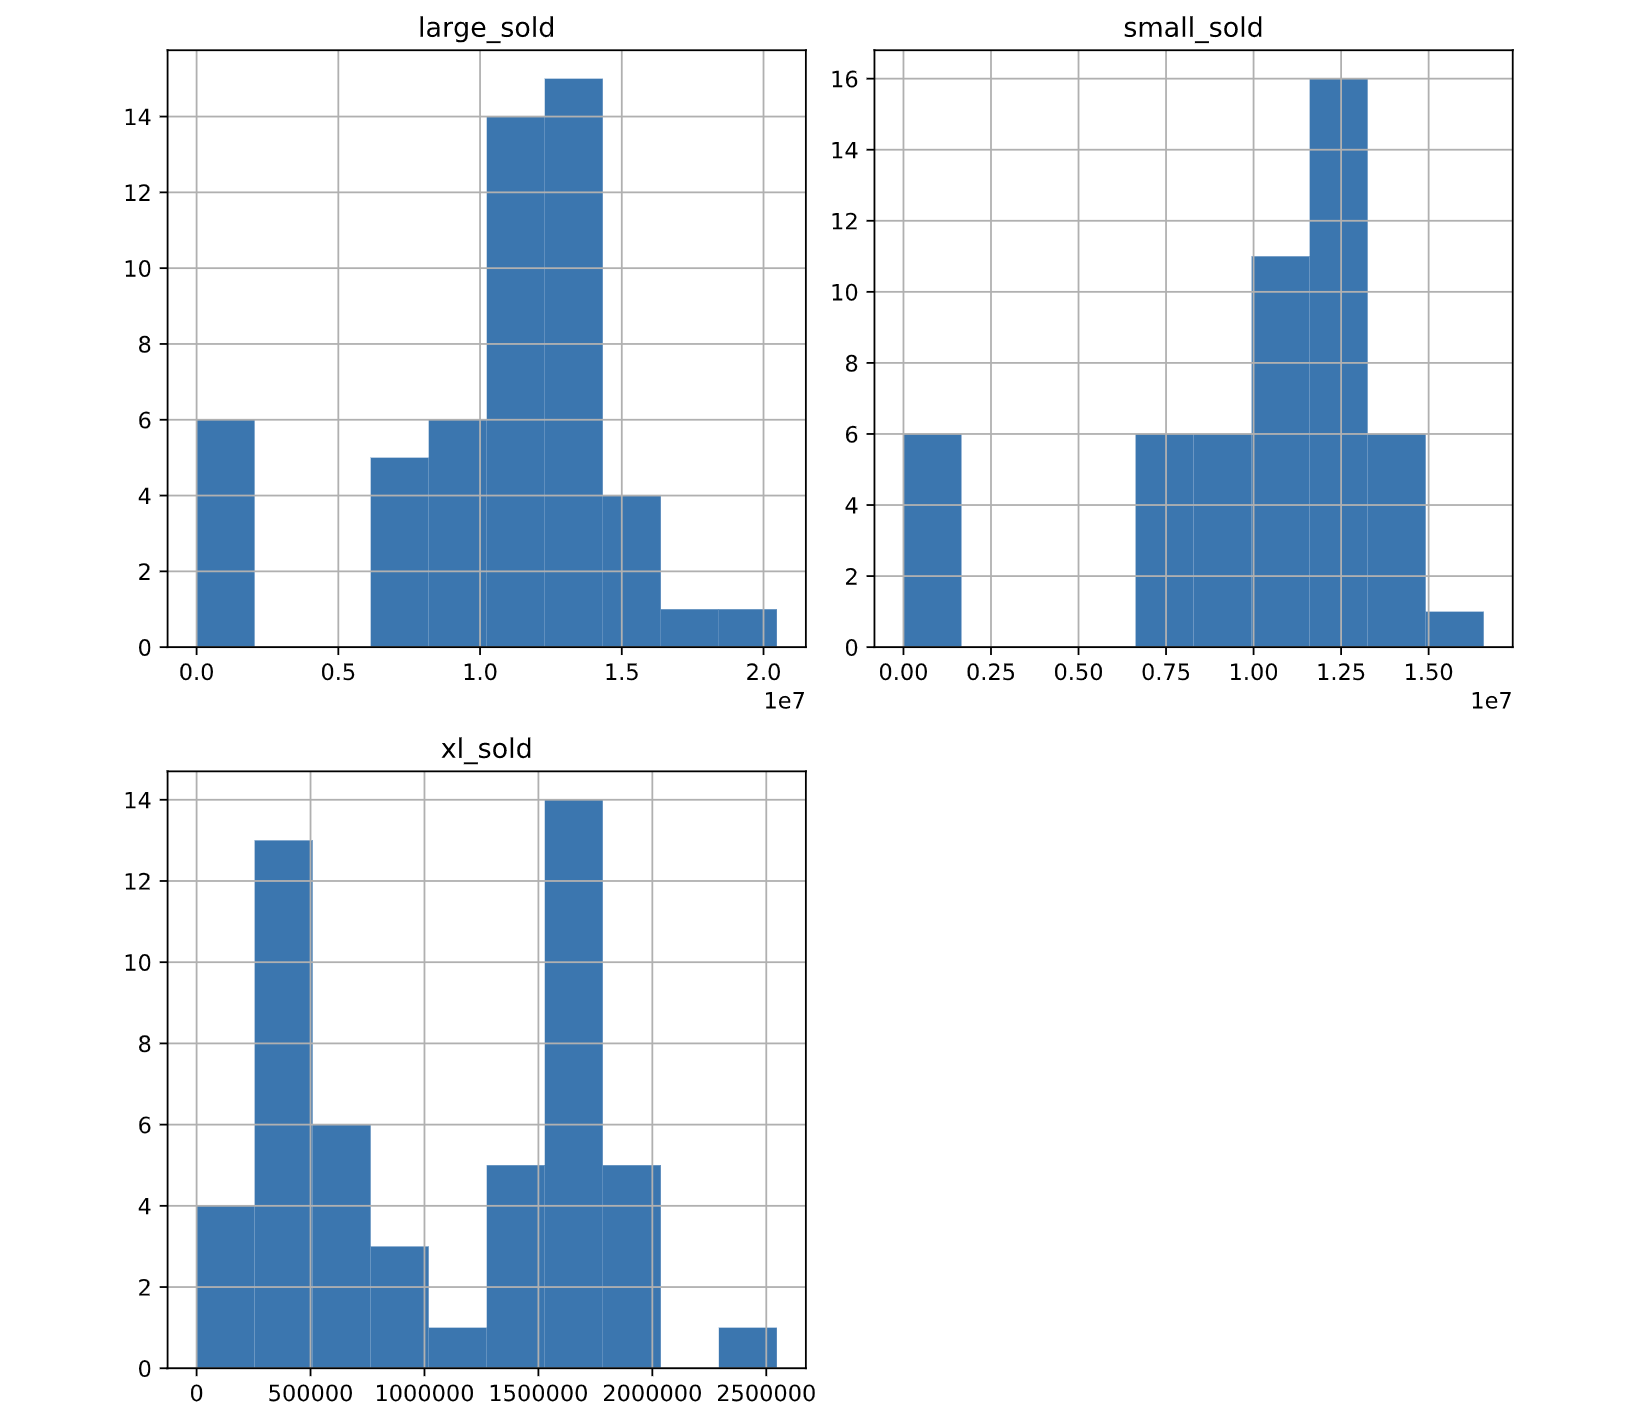
# Fill in missing values with 0
avocados_filled = avocados_2016.fillna(0)
# Create histograms of the filled columns
avocados_filled[cols_with_missing].hist()
# Show the plot
plt.show()
Creating DataFrames
- Dictionaries
- from a list of dictionaries (by row)
- from a dictionary of list (by column)
list of dictionaries
# Create a list of dictionaries with new data
avocados_list = [
    {"date": "2019-11-03", "small_sold": 10376832, "large_sold": 7835071},
    {"date": "2019-11-10", "small_sold": 10717154, "large_sold": 	8561348},
]

# Convert list into DataFrame
avocados_2019 = pd.DataFrame(avocados_list)

# Print the new DataFrame
print(avocados_2019)
dictionary of lists
# Create a dictionary of lists with new data
avocados_dict = {
  "date": ["2019-11-17","2019-12-01"],
  "small_sold": [10859987,9291631],
  "large_sold": [7674135,6238096]
}

# Convert dictionary into DataFrame
avocados_2019 = pd.DataFrame(avocados_dict)

# Print the new DataFrame
print(avocados_2019)
Reading and writing CSVs
DataFrame to CSV
new_dogs.to_csv("new_dogs_with_bim.csv")