UG_Special Topics_Creating User Metrics - GoldenCheetah/GoldenCheetah GitHub Wiki
Creating User Metrics
From version 3.4 it has been possible for the user to write their own metrics using datafilters, as of version 3.5 it is now possible to use Python scripts to perform computations as well. Starting with v3.6 custom metrics can be shared in CloudDB like custom charts, so you can give a look there to see if someone else has already developed the metric you need, get examples for customization and share your metrics with fellow users.
For an in-depth explanation of using datafilter, formulas and expressions to develop programs see the reference guide.
NOTE: From version 3.6 the language has been improved to allow you to work with vectors. So old code that uses the sample {} function should really use samples instead see the section poor performance using the sample function below
How metrics work
When an activity is imported or changed the metrics associated with the activity are recomputed. This is automatically triggered within GC and is performed in parallel in background threads, whilst the user can continue working within GC uninterrupted.
As a special case, if metadata fields are edited then metrics are also recomputed - this is in case metrics make special reference to metadata fields like RPE, ROF, CP or W' that can be edited on the details chart in analysis view.
When metrics are recomputed all the builtin metrics are computed first, this is to ensure they are available to use within the user metric. For example you may want to create a metric for TSS per hour, this would be much easier if you could reference the TSS and Duration metrics rather than compute them from scratch yourself.
For performance reasons we cannot guarantee the order in which user metrics are computed, so it is not possible to re-use them in computations.
User metric settings
Metrics can be created and maintained in GoldenCheetah > Preferences on a Mac, and Tools > Options on all other platforms. Under the Metrics pane you will see Custom Metrics.
When creating a new metric there are a few settings that need to be selected:
symbolA basic name that should uniquely identify your metricnameThe metric name that will be shown to users and used in formulastypeThis defines what the metric represents, it is used to decide how the metric should be aggregated. Total fields are aggregated by adding them together, Peak fields are aggregated by selecting the highest and Averages are aggregated by taking into account total duration (seecountfunction below)descriptionIs used to describe the metric to users, typically as a tooltiptimeIndicates that the value represents a duration in seconds that should be displayed to the user in a time format e.g. 01:22:00.aggregate zeroIf zero is a meaningful value then this tells the aggregator to incorporate zero values, this only affects Average type metrics.metric unitsThe name for metric units.imperial unitsThe name for metric units.conversion factorUsed to convert calculated values (which must always be metric) to imperial.conversion sumUser to convert calculated values (which must always be metric) to imperial.programThe code used to calculate the metric
The User metric program
A metric has a number of functions, which are optional, that are called when the user metric is being computed. The main code in GC will call the following functions, all of which apart from value are optional.
relevantreturn non-zero if this metric is relevant for the activityinitinitialise any variables that will be used during the calculationsamplecalled for every data sample in the workout or interval we recommend you do not use this functionbeforecalled for every data sample before the start of an intervalaftercalled for every data sample after the end of an intervalvaluecalled to get the final value computed for the intervalcountcalled to get the averaging base of the interval
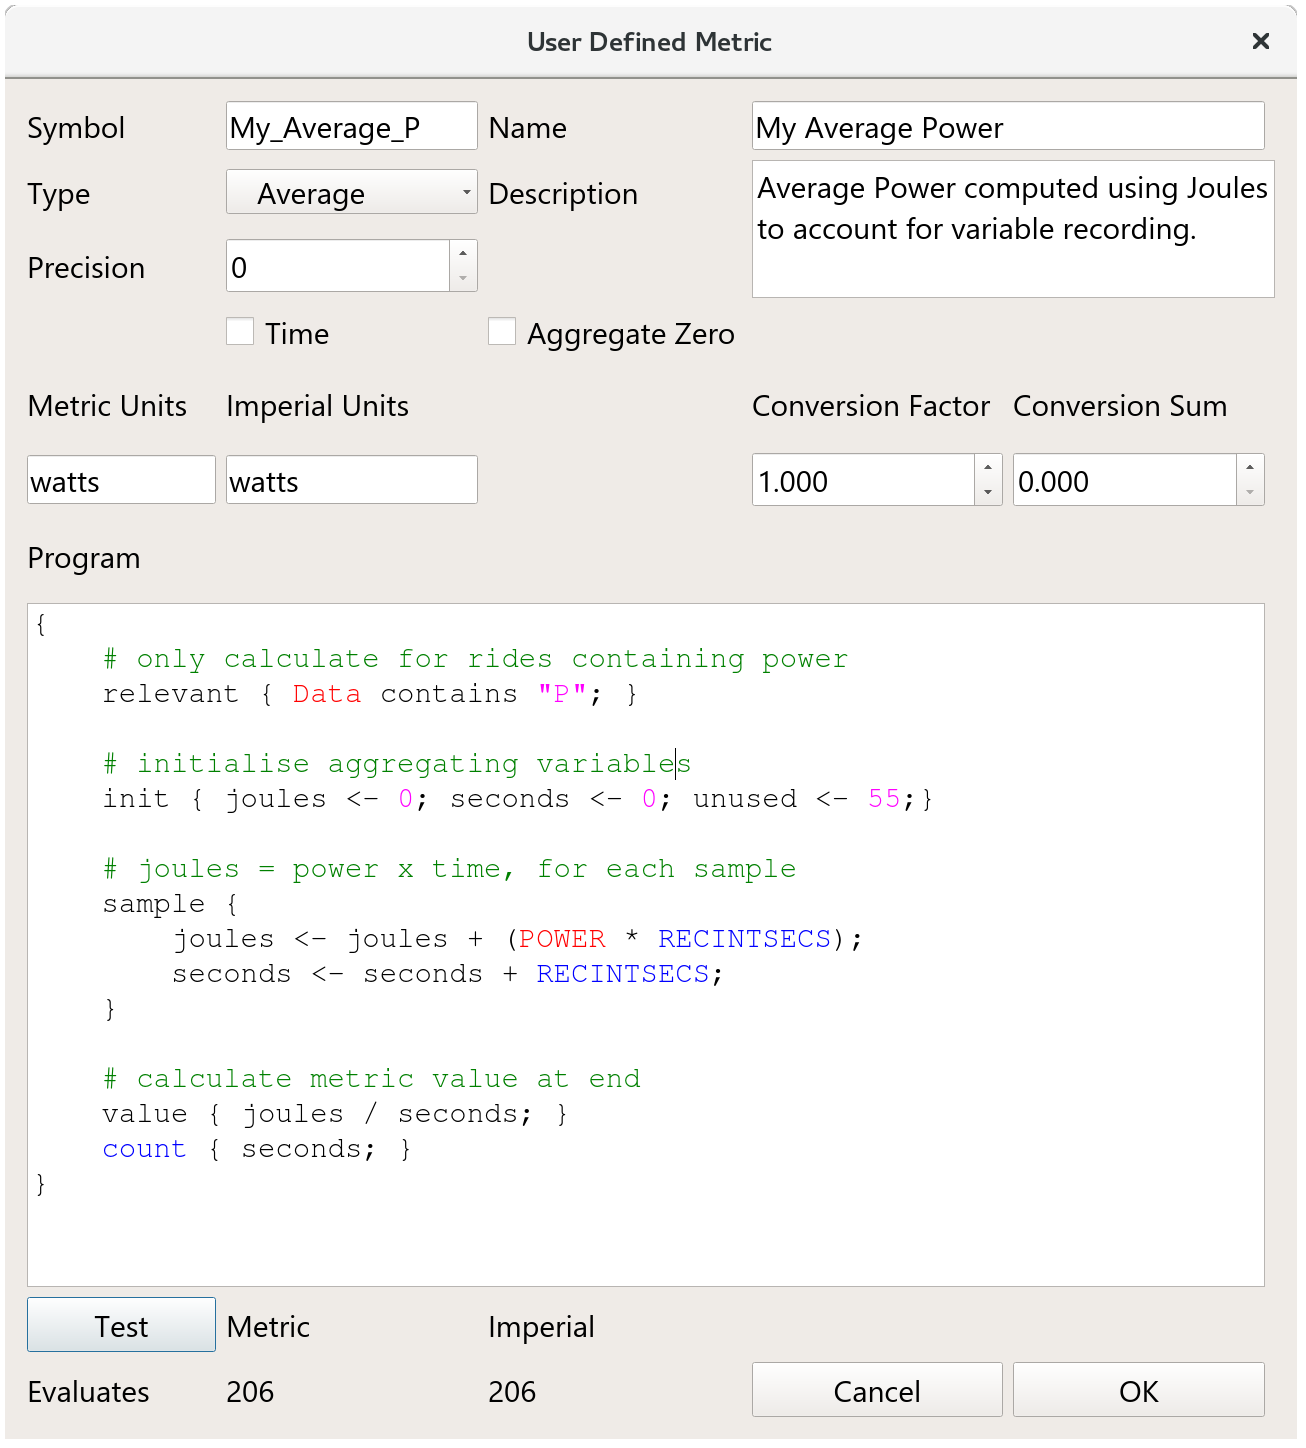
The functions can be declared within the program block, and are all optional. Below is an example to compute average power:
{
    # only calculate for rides containing power
    relevant { Data contains "P"; }

    # initialise aggregating variables
    init { joules <- 0; seconds <- 0; }

    # joules = power x time, for each sample
    sample {
        joules <- joules + (POWER * RECINTSECS);
        seconds <- seconds + RECINTSECS;
    }

    # calculate metric value at end
    value { joules / seconds; }
    count { seconds; }
}
There are a few things to note from the example code:
relevantis declared to halt computation if power is not present in the activityinitinitialises two variables to zero, these are updated in thesamplefunctionsamplereferences thePOWERandRECINTSECSdata sample values, not using other metrics.valueuses the aggregated values to compute the final value of the metriccountis set, this is because the metric is an average and a count is needed when aggregating average based metrics.
relevant function
The relevant function is used to tell GC if the metric is even relevant for the activity. For example a power based metric will not be relevant if there is no power recorded. A running metric won't be relevant for a swim workout.
If the relevant function returns zero then no other computation takes place and the metric is set to zero. This has the additional benefit of speeding up computation so it is highly recommended that you use this function where your metric may not be needed.
Example for a power based metric for rides only:
{
   relevant { Data contains "P" && isRun=0 && isSwim=0; }
}
Note that the function does not have a return statement. The last statement in a block of code { ... } is used as the result of a code block. In the above example, the Data field is a string that contains a character for every data series present in the workout, if it doesn't contain the letter "P" then power is not present.
init function
The init function can set initial values and do housekeeping. Strictly speaking initialising variables to zero is not necessary, since the very first time they are referenced they will be created and set to zero.
It is good practice, especially if you are using R or python scripts to initialise variables before you start, or if you are going to reference and use XDATA values stored in the activity.
sample function
The sample function is called on every data sample in the workout (or that is in the interval, since metrics are calculated for entire workouts and intervals).
We strongly recommend you do not use this function. Instead use samples() and vectors. For an explanation see below.
It can reference the sample values directly, these are always expressed in upper case to distinguish them from metrics and metadata. The list of sample values are shown below:
- ALTITUDE BALANCE CADENCE CADENCED DISTANCE HEADWIND HEARTRATE HEARTRATED
- LAT LEFTEFFECTIVENESS LEFTPCO LEFTPPB LEFTPPE LEFTPPPB LEFTPPPE LEFTSMOOTHNESS
- LON NP POWER POWERD RIGHTEFFECTIVENESS RIGHTPCO RIGHTPPB RIGHTPPE
- RIGHTPPPB RIGHTPPPE RIGHTSMOOTHNESS RUNCADENCE RUNCONTACT RUNVERT
- SECS SLOPE SMO2 SPEED SPEEDD TEMPERATURE THB TORQUE TORQUED
Note that the sample function will only iterate over the main data, if you want to use XData in the computation then you should fetch and work with that separately using the DataFilter expression XDATA("EXTRA","STEPLENGTH", repeat|sparse|interpolate|resample), where the third parameter specifies the treatment of missing data: repeat just repeat the previous value, sparse returns zero and interpolate will generate a value based on the previous and posterior values while resample is a synonymous for sparse currently.
before, after function
When computing a metric for an entire workout these functions are not called. But when computing for an interval they are called for the samples before or after the interval in question. This means you can build user metrics that quantify state at the start of an interval (e.g. cumulative stress or work before an intervals starts) or the post interval performance (e.g. average power).
value function
The value function is called right after the samples have been iterated but just before calling count. It is expected that this function will compute the final value. This is the value that is stored and displayed to the user.
When working with existing metrics this might be the only function you implement.
It must always return the value in metric units, if imperial units are needed these will be calculated using the metric settings conversion factor and conversion sum.
count function
The count function is only required if you set the metric type to Average since the total count needs to be taken into account when aggregating metrics together. For example, a ride of 1hr with an average power of 300w when aggregated with another of 2hrs with an average power of 200w would not be 250w (300+200)/2, instead it would be (3001+2002)/3. So we need to provide value for count to ensure the aggregation is correct.
If a count function is not provided for an average metric, Duration is used as default averaging base.
IMPORTANT: Whilst ordinarily a user defined function will override the builtin functions, for the count function we explicitly ignore the user defined function at runtime-- so you can still use the builtin count function for working with vectors within user metric code.
Poor performance using the sample function
The sample function is called for every sample it the activity. Given a typical ride has a couple of hours of data, and you likely have hundreds of activities this will take a long time !
From version 3.6 onwards it is possible to work with vectors- in which all the activity data can be worked with at once. As ever it is better to give an example. Here is an old style user metric:
# set initial values
init { work <- 0; time <- 0 }

# accumulate across the activity
sample {
   work <- work + (POWER * recIntSecs);
   time <- time + recIntSecs;
}

# return value and count
value { work; }
count { time; }
This should be rewritten to use the samples data filter function instead:
value { sum(samples(POWER) * recIntSecs); }
count { length(samples(POWER)) * recIntSecs; }
Instead, you can see in the faster version above, the entire power series is multiplied by the recording interval in a single step. This will speed up metric calculations significantly.
The vectorized version when using XData instead of regular sample data looks like:
{
    # only calculate for activities with EXTRA/STEPLENGTH XData
    relevant { XDATA("EXTRA","STEPLENGTH",sparse); }

    # calculate metric value at end
    value { mean(xdata("EXTRA", "STEPLENGTH")); }
    count { length(xdata("EXTRA", "STEPLENGTH")); }
}
For more details see the documentation for working with vectors.
Scripting with Python
From version 3.5 onwards it is possible to embed code using Python to calculate a metric. This is done by inserting code between %%python and %% .
A couple of things to note:
- the code is passed to the interpreter unchanged, so for Python scripts you should take care with indentation since the python interpreter is sensitive to this.
- the code block is evaluated as an expression, so can be included into one.
The script itself will need to call GC.result(x) to return the value computed. At present only numeric values are supported.
Here is a simple example for Average Power in Python to demonstrate:
{
   value {

%%python
# calculate average power
import numpy as np
data = np.asarray(GC.series(GC.SERIES_WATTS))
GC.result(data.mean())
%% ;

   }
}
Notes
- the script is formatted with no white space and the expression is terminated with a
; - Although the example only has one embedded python script you can embed multiple scripts if needed.
- Python API to access GC data is documented in Working with Python
BACK: Special Topics: Overview
BACK: Table of contents