UG_Side Bar_Trends view - GoldenCheetah/GoldenCheetah GitHub Wiki
Side Bar: Trends view
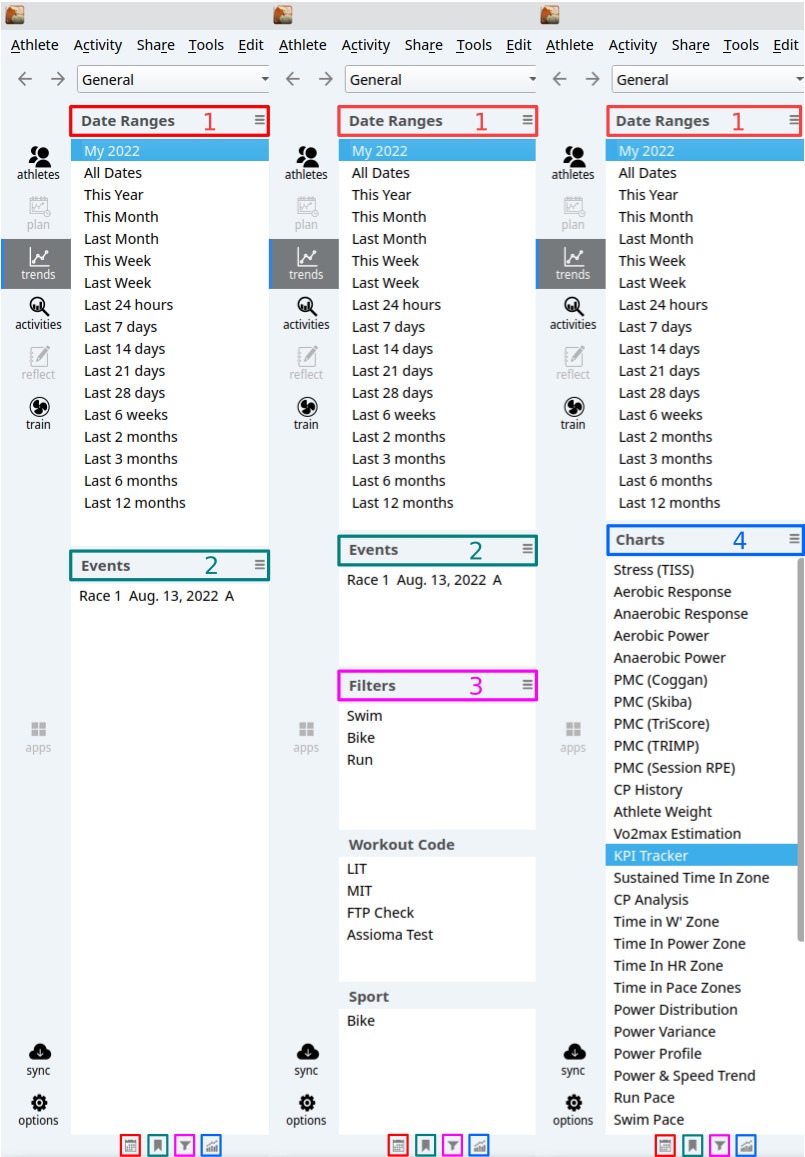
The Side Bar for the Trends view offers four different panes - as illustrated above.
Note: Summary pane was deprecated in v3.5
Date Ranges
Date ranges define for which period in time data is shown/accumulated in the main view of Trends. GoldenCheetah comes with a number of pre-defined Date Ranges - which start with All Dates and end with Last 12 months. The predefined date ranges cannot be deleted or changed.
You can add you own data ranges - also called Seasons in multiple ways.
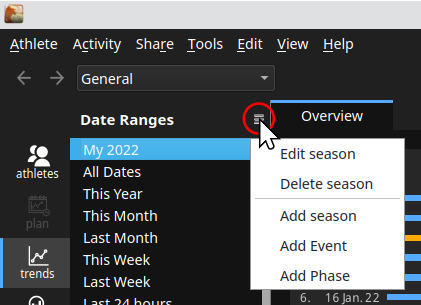
- Pane Header Menu (all options)
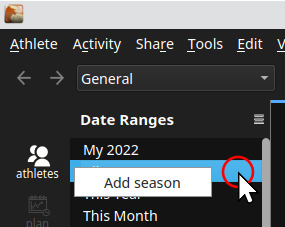
- Context Menu - predefined seasons (only Add is possible)
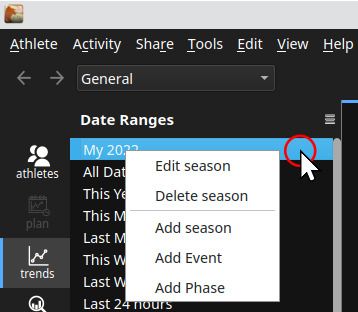
- Context Menu - user defined seasons (all options)
In all cases, Add Season opens a popup to define your new season:
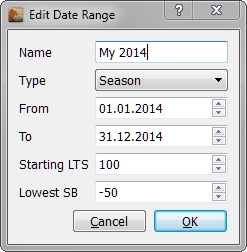
Name- your season nameType- currently 3 types are possible (Season, Cycle, Ad-hoc) - as of now they are for information purpose only, there is no functionality associatedFrom- thefrom dateof the season/date rangeTo- theto dateof the season/date rangeStarting LTS- sets both the Long Term Stress (LTS) and Short Term Stress (STS) starting value for the PMC charts (independent of the PMC metrics used).
Note: Please observe, that the Starting LTS value set in a season, is also considered when selecting a different Date Range - so make sure that seasons, which shall not influence the overall PMC calculations, have the Starting LTS set to 0 (so they are not considered in PMC calculation)
Important Hint: You may need to close / restart Golden Cheetah so that the Starting LTS set in a Season is considered in the PMC calculation of your charts.
Lowest SB- currently for information purposes only, no functionality associated
Note: Please observe that some charts can have their own date range defined in the chart specific settings. In such cases the Date Range in the Side Bar does not have any effect on the chart data.
Other Functions on Date Ranges
Edit Season- allows to change season settings (same fields toAdd Season)Delete Season- deletes the selected season (please observe - no additional dialog box - the season is immediately deleted)Add Event- creates anEventfor the selected season (see sectionEventsfor more details)
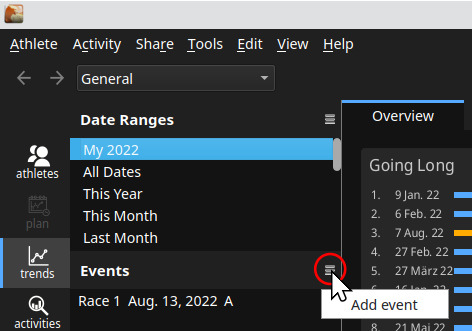
Events
Events are single dates which can be races,etc. Events are created and maintained for a user defined Date Range/Season. When selecting a user created season, only the events created for that season are shown in the Long Term Metrics (LTM) charts. When selecting a pre-defined Date Range/Season all user defined events which fall into that range are shown on the charts.
Pane Header Menu- allows only to create events - theSeasonfor such an event is the actual selected season in theDate Rangepane, and the event date must be between start and end dates for that season. The popup does not appear/function is not possible, if the currently selectedDate Rangeis a system pre-defined range. (Events can only be created for user-defined seasons.)
Context Menu of an existing event- allows to Delete and Edit the selected event, but also to add a new event.
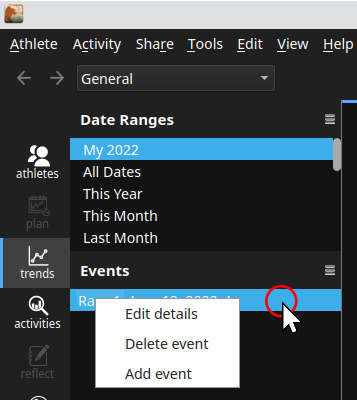
In all cases, Add Event opens a popup to define your new event:
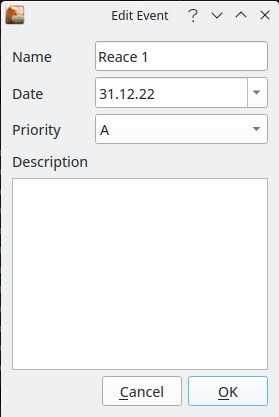
Name- your event nameDate- the date of the eventPriority- Priority of the eventDescription- Description for the event
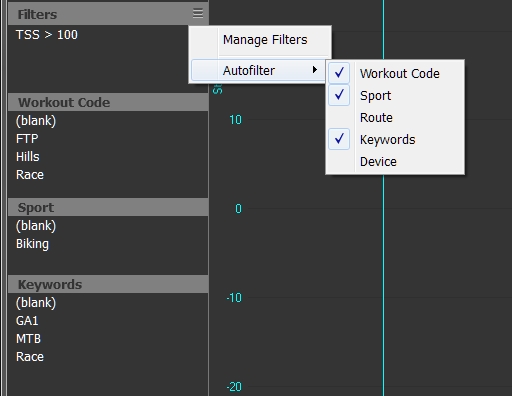
Filters
Filtering via the Side Bar is one of multiple ways, how you can select the activities, which are then analysed in the Trends View. The special feature of filtering in the Side Bar, compared to other filtering options is, the Auto Filter provided here:
-
Section
Filters- shows the list of your predefined filter queries - you can select one or multiple filters (using Windows, the multi-select is done via "Shift" or "CTRL" and "mouse-click. Other OS might work differently, but offer the same feature). Multiple filters here are applied with an logical "AND", so that only the data of activities which fulfill ALL filter rules is considered in a chart. CTRL+Click on a selected filter allows to deselect it. -
Sections
Workout Code,Sport,... are theAutofilters. The values shown for eachAutofilteris the list of values used in that particularAutofilterfield of your activities. You can select one or many of these values which then limit the activities to those where one of the selected values is assigned (logical "OR").
Note: All fields which are of type "ShortText" or "Text" in the Preferences->Data Fields->Field list and are assigned to a "Screen Tab", are available as Autofilters.
Filters - Menu
-
Autofilter- the list shows all possibleAutofilterfields - which you can either activate or de-activate to be shown/used in theSide Bar -
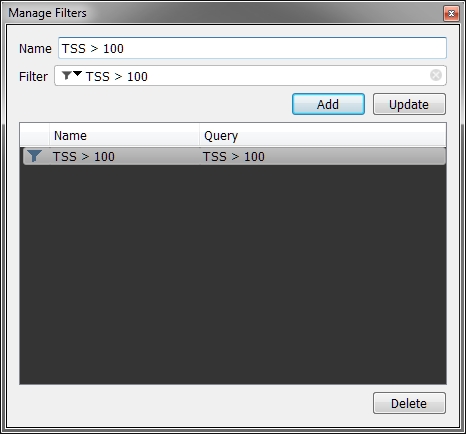
Manage Filters- open a dialog box which allows to create your own filter queries (the filter queries created here are available for all GoldenCheetah Filter functions)
Further information on filtering can be found under: Filtering/Searching
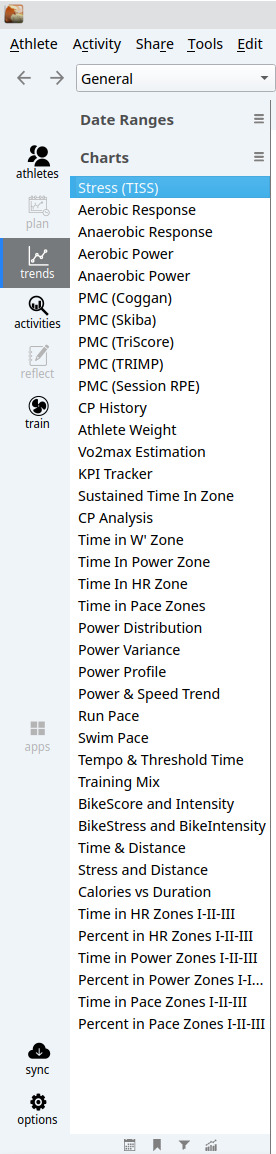
Charts
The Charts section is new with 3.1. It provides a different way to access Metrics Trends charts which are shown in the Main View without having the need to add every single chart to the Charts Bar.
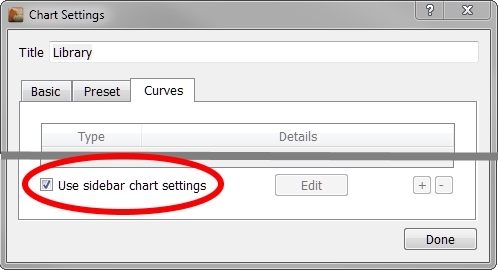
The Side Bar - Charts functionality needs a special chart (Default - "Library") on the current perspective. In tabbed mode, if you select any other chart on the Main View, selection of a chart in the Side Bar - Charts will change to the first "Library" chart provided there is at least one, and will do nothing otherwise. In v3.6 this applies at the perspective level: the current perspective needs to contain a "Library" chart to use the charts on the side bar.
Here is the configuration of the Library Chart:
Note: In v3.5 a hamburger menu was added to the Charts pane to allow in place creation, edition and deletion of Metrics Trends charts, export to and export from xml files, and reset to default charts library from GoldenCheetah web site.
BACK: Side Bar: General