UG_ChartTypes_Train - GoldenCheetah/GoldenCheetah GitHub Wiki
Chart Types: Train view
The Train view offers Chart Types that relate to the current training session. These charts present various metrics, the current position on a map, the current workout or a video of the simulated course. The Train view charts are by default tiled from left to right, overflowing on subsequent rows, in the main view. As explained in the charts bar general handling, the charts in the main view can be moved and resized, and their settings edited. It is also possible to have each chart in a separate tab. However, except for the Video Player with overlaid meters, you typically want to see several charts at a time.
Telemetry
Each telemetry chart is configurable to present one of several (more than 50) available metrics. Several such charts will typically be used, for instance to present the speed, distance, slope, power and elapsed time. For some series (Power, Cadence and Heart Rate) up to 30 sec smoothing can be applied.
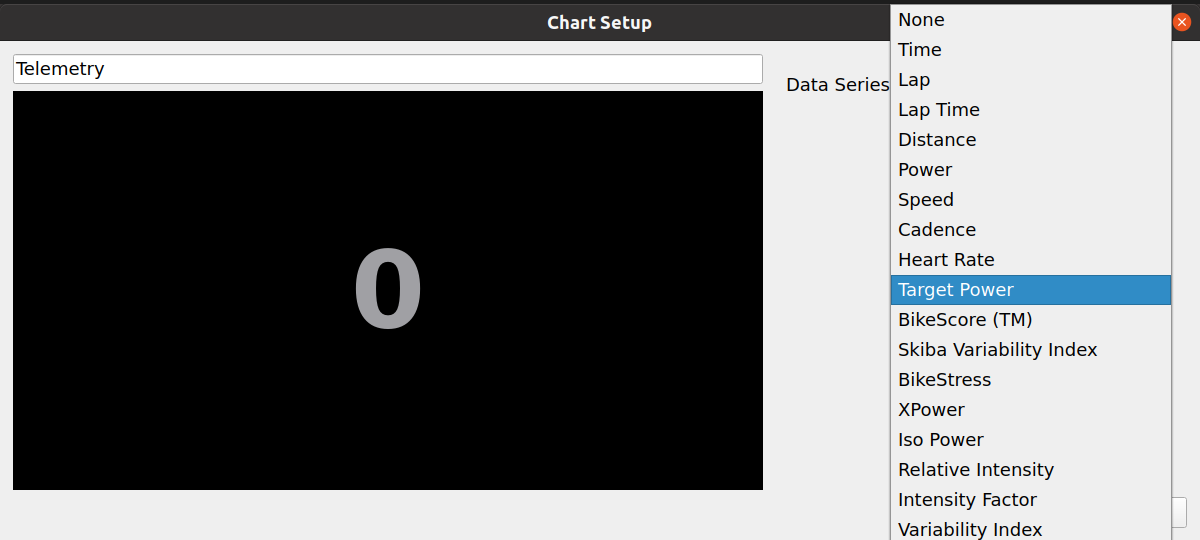
Available realtime data series in v3.6 are: Time, Lap, Lap Time, Lap Time Remaining, Section Time Remaining, BikeStress, BikeScore (TM), kJoules, W' bal, XPower, Iso Power, Intensity Factor, Relative Intensity, Skiba Variability Index, Variability Index, Distance, Route Distance, Distance Remaining, Alternate Power, Power, Speed, Virtual Speed, Cadence, Heart Rate, Target Power, Average Power, Average Speed, Average Heartrate, Average Cadence, Lap Power, Lap Speed, Lap Heartrate, Lap Cadence, Left/Right Balance, Total Hb Mass, Hb O2 Saturation, Deoxy Hb, Oxy Hb, Left Torque Effectiveness, Right Torque Effectiveness, Left Pedal Smoothness, Right Pedal Smoothness, Slope, Lap Distance, Lap Distance Remaining, Latitude, Longitude, Altitude, Respiratory Frequency, Ventilation, VO2, VCO2, Respiratory Exchange Ratio, Tidal Volume, Fraction O2 Expire
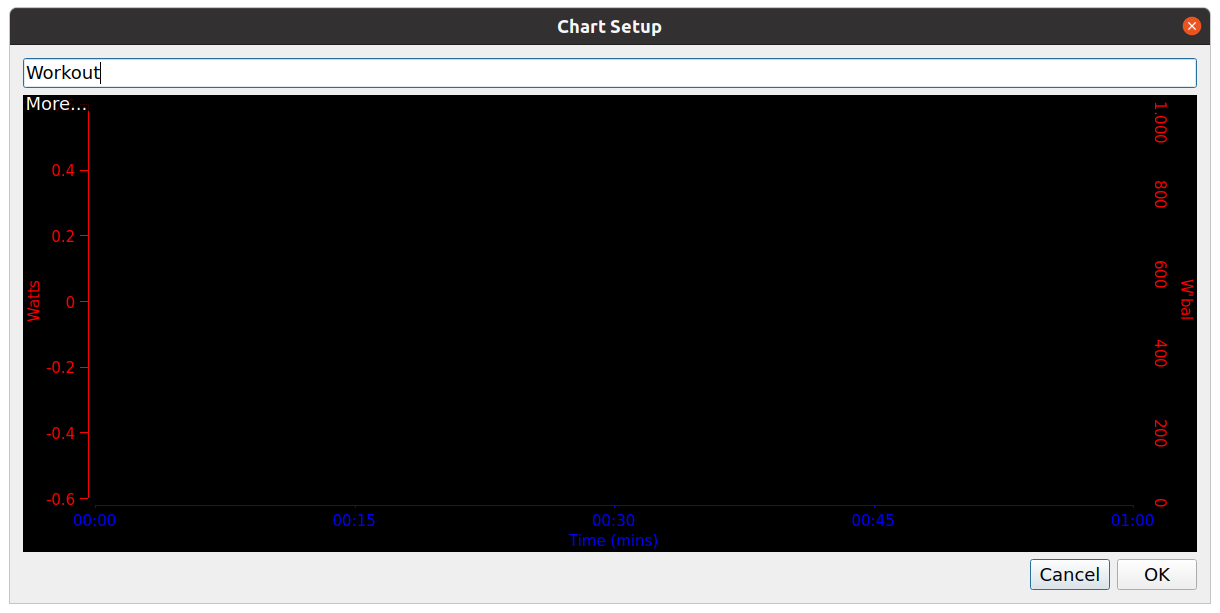
Workout
The Workout chart displays the content of the currently selected workout. For a simulated course, this will correspond to the ride profile (altitude versus distance). For a power based workout, it will display the target power as a function of time.
Once the workout is started additional curves are displayed showing Power, W'bal, Cadence, Heart Rate and Speed smoothed using a 5 seconds moving average window.
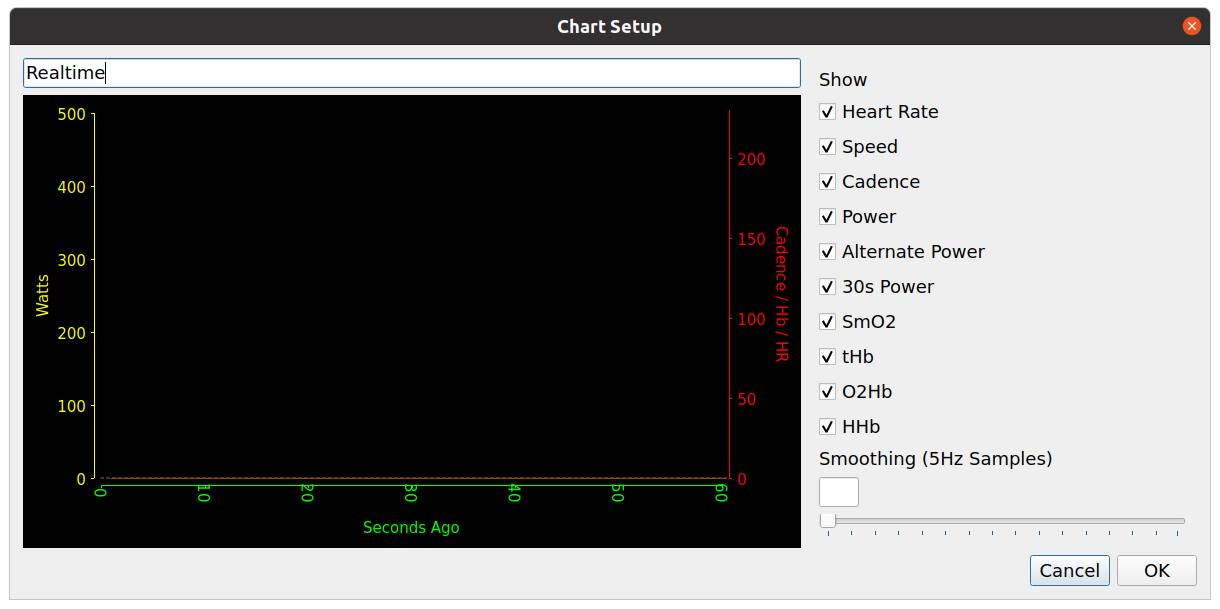
Realtime
A Realtime chart displays a graph over time of the selected metrics, as you ride through your current training session. Each metric is displayed in a different color on the graph. The colors can be defined in the Tools->Options->Appearance->Colors menu.
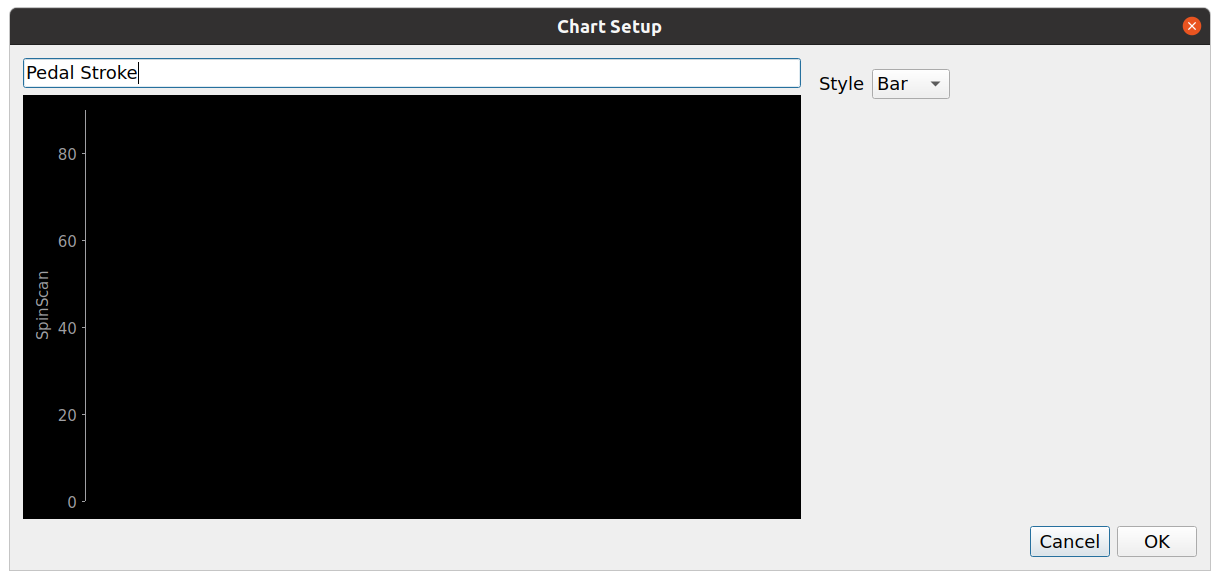
Pedal Stroke
The Pedal Stroke chart displays the torque on each pedal as a function of the angle, over the past few rotations. It is available for Computrainer devices and is sometimes called spin scan.
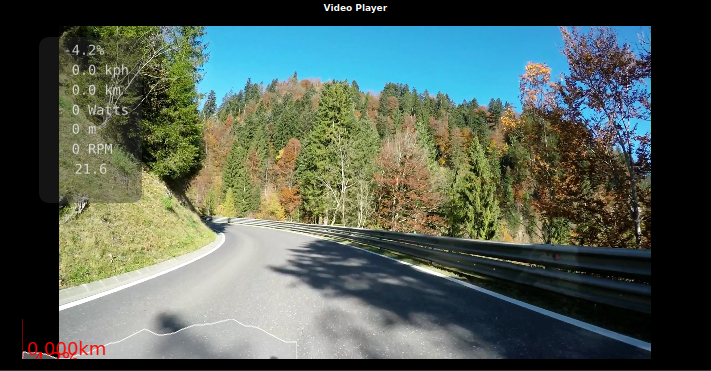
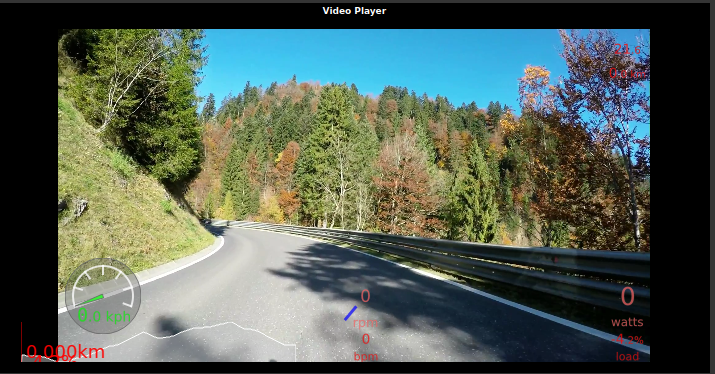
Video Player
The video player displays the currently selected media file. If a VideoSync file is also selected, the video progression is synchronized with the distance travelled in the training session.
On Windows and Linux, but not macOS, builds it is possible to overlay different meters on top of the video: text or graphical meters for speed, elevation, cadence, heart rate, load or slope, distance, elapsed time, lap time, or trainer status. Graphical overlays are available to display the workout or a live map too.
The interest of using overlay meters, rather than regular charts, is to reserve the full screen for the video player, while still having key data available as overlay.
By default, four layouts are defined: Graphical Meters, Graphical Meters with Map, Text Meters and No Meters. The desired layout can be selected in the Video Player chart settings.
The layout of the overlay meters is defined in file video-layout.xml within the config directory of the athlete folder. There are currently no tools to graphically edit this file. The format is mostly self-documented and editing this XML file is not too difficult, but if you need to ask, it is not likely for you.
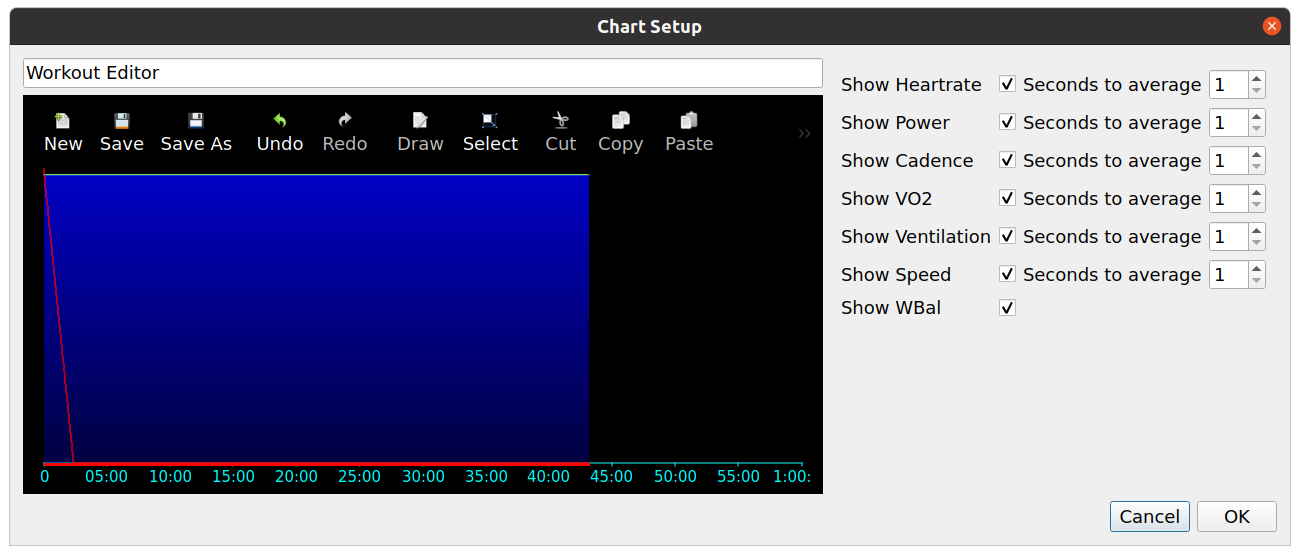
Workout Editor
The workout editor chart allows the user to interactively define a new ergometer mode workout or to change an existing one, in graphical mode by click and drag, and using text mode qwkcode. To display and edit the text representation click the Properties button, for a detailed description see: qwkcode syntax.
The workout can be scaled using the mouse wheel (while holding Ctrl key in v3.6), and used for the current training session, but can also be saved to a file in one of the supported formats to be reused later. There is a video tutorial available in the main site.
This chart adapts its display according to the space available, for example some characteristics s.t. Power Zone colored limits, Axes, and the ability to select points are available only when there is enough space. So, if you don't see a feature like that in your configuration, you may need to make the chart bigger.
Once the workout is started additional curves are displayed showing Power, W'bal, Cadence, Heart Rate and Speed smoothed using a 1 second moving average window. Series can be excluded and the moving average window for each series can be changed for the session in chart options, but they are not preserved when GoldenCheetah is closed until version 3.7.
For a walkthrough see the main site tutorial section: http://www.goldencheetah.org/#section-tutorials
Note: Workout editor is specific for erg mode workouts and it doesn’t support slope mode simulation rides, use Workout instead.
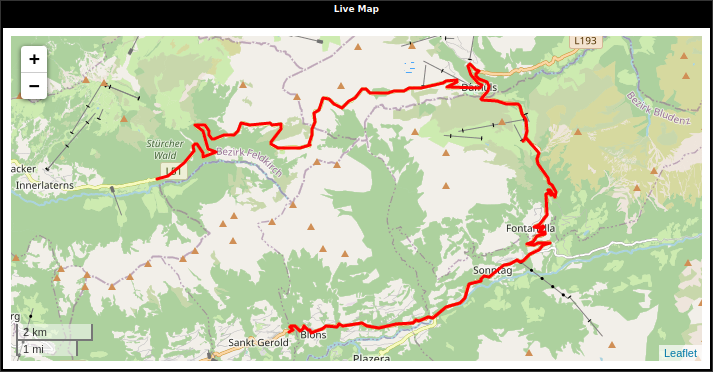
Live Map
New in v3.6, when the currently selected workout contains the full 3D coordinates of the ride, not only the elevation as a function of the distance.
Currently supported formats including coordinates are GPX, JSON and TTS. “No data available” indicates the selected workout doesn’t include GPS data, there is no workout selected.
The live map chart queries the Open Street Map server for the enclosing road map image. The ride is shown in red, over the map, and the progress along the ride is displayed in real time.
Map provider URLs and usage policies can change over time, and they can offer different functionality for different regions, so you may need to change the chart configuration if maps are not working as you expect.
Default OSM URL is preconfigured in the chart as: http://{s}.tile.openstreetmap.org/{z}/{x}/{y}.png
A list can be found in https://wiki.openstreetmap.org/wiki/Tile_servers, please use the format of the example above for registration free tile servers.
It is also possible to use Tile servers requiring registration embedding your personal apikey there, see the provider documentation for details. For example to use Thunderforest OpenCycleMap the URL looks like: https://tile.thunderforest.com/cycle/{z}/{x}/{y}.png?apikey=<your-apikey-here>
Elevation Chart
New in 3.7, if selected workout has GPS data, this chart show a short term view of the slope, and the variation of the slope (delta slope) for the next few seconds.
It shows:
- Graphical view of the altitude profile for the next meters
- Current slope, in a vertical line, indicating current position
- View of slope variation in next seconds through a bubble that changes its color and vertical position (as a floating bubble), according to its value (higher position means bigger change in positive slope)
Configuration data:
- Profile Distance (m): meters ahead that are shown in the altitude graph (from 50 to 2000 meters).
- Seconds for delta slope: the bubble shows the incremet/decrement in slope for next seconds; it is computed as the difference in altitude between current position and position reached in those seconds, considering current speed. From 5 to 600 seconds
- Elevation window size (%) relative to current altitude: Vertical heigh of the chart is that percentage of horizontal distance shown; with this parameter, the graph can be adapted to the slope profile. A 5% may not be anough for a workout with big slopes, but can show small differences in slope. From 5% to 20%

BACK: Chart Types