FAQ MOST COMMON QUESTIONS OF ALL - GoldenCheetah/GoldenCheetah GitHub Wiki
MOST COMMON QUESTIONS OF ALL
How can I get help about GoldenCheetah usage?
Available Help resources are explained in Help Menu
How to search the wiki and source code?
Simple search on the GoldenCheetah GitHub repository is as easy as: write the search terms in search box at the top, hit Enter and select the section you are interested in:
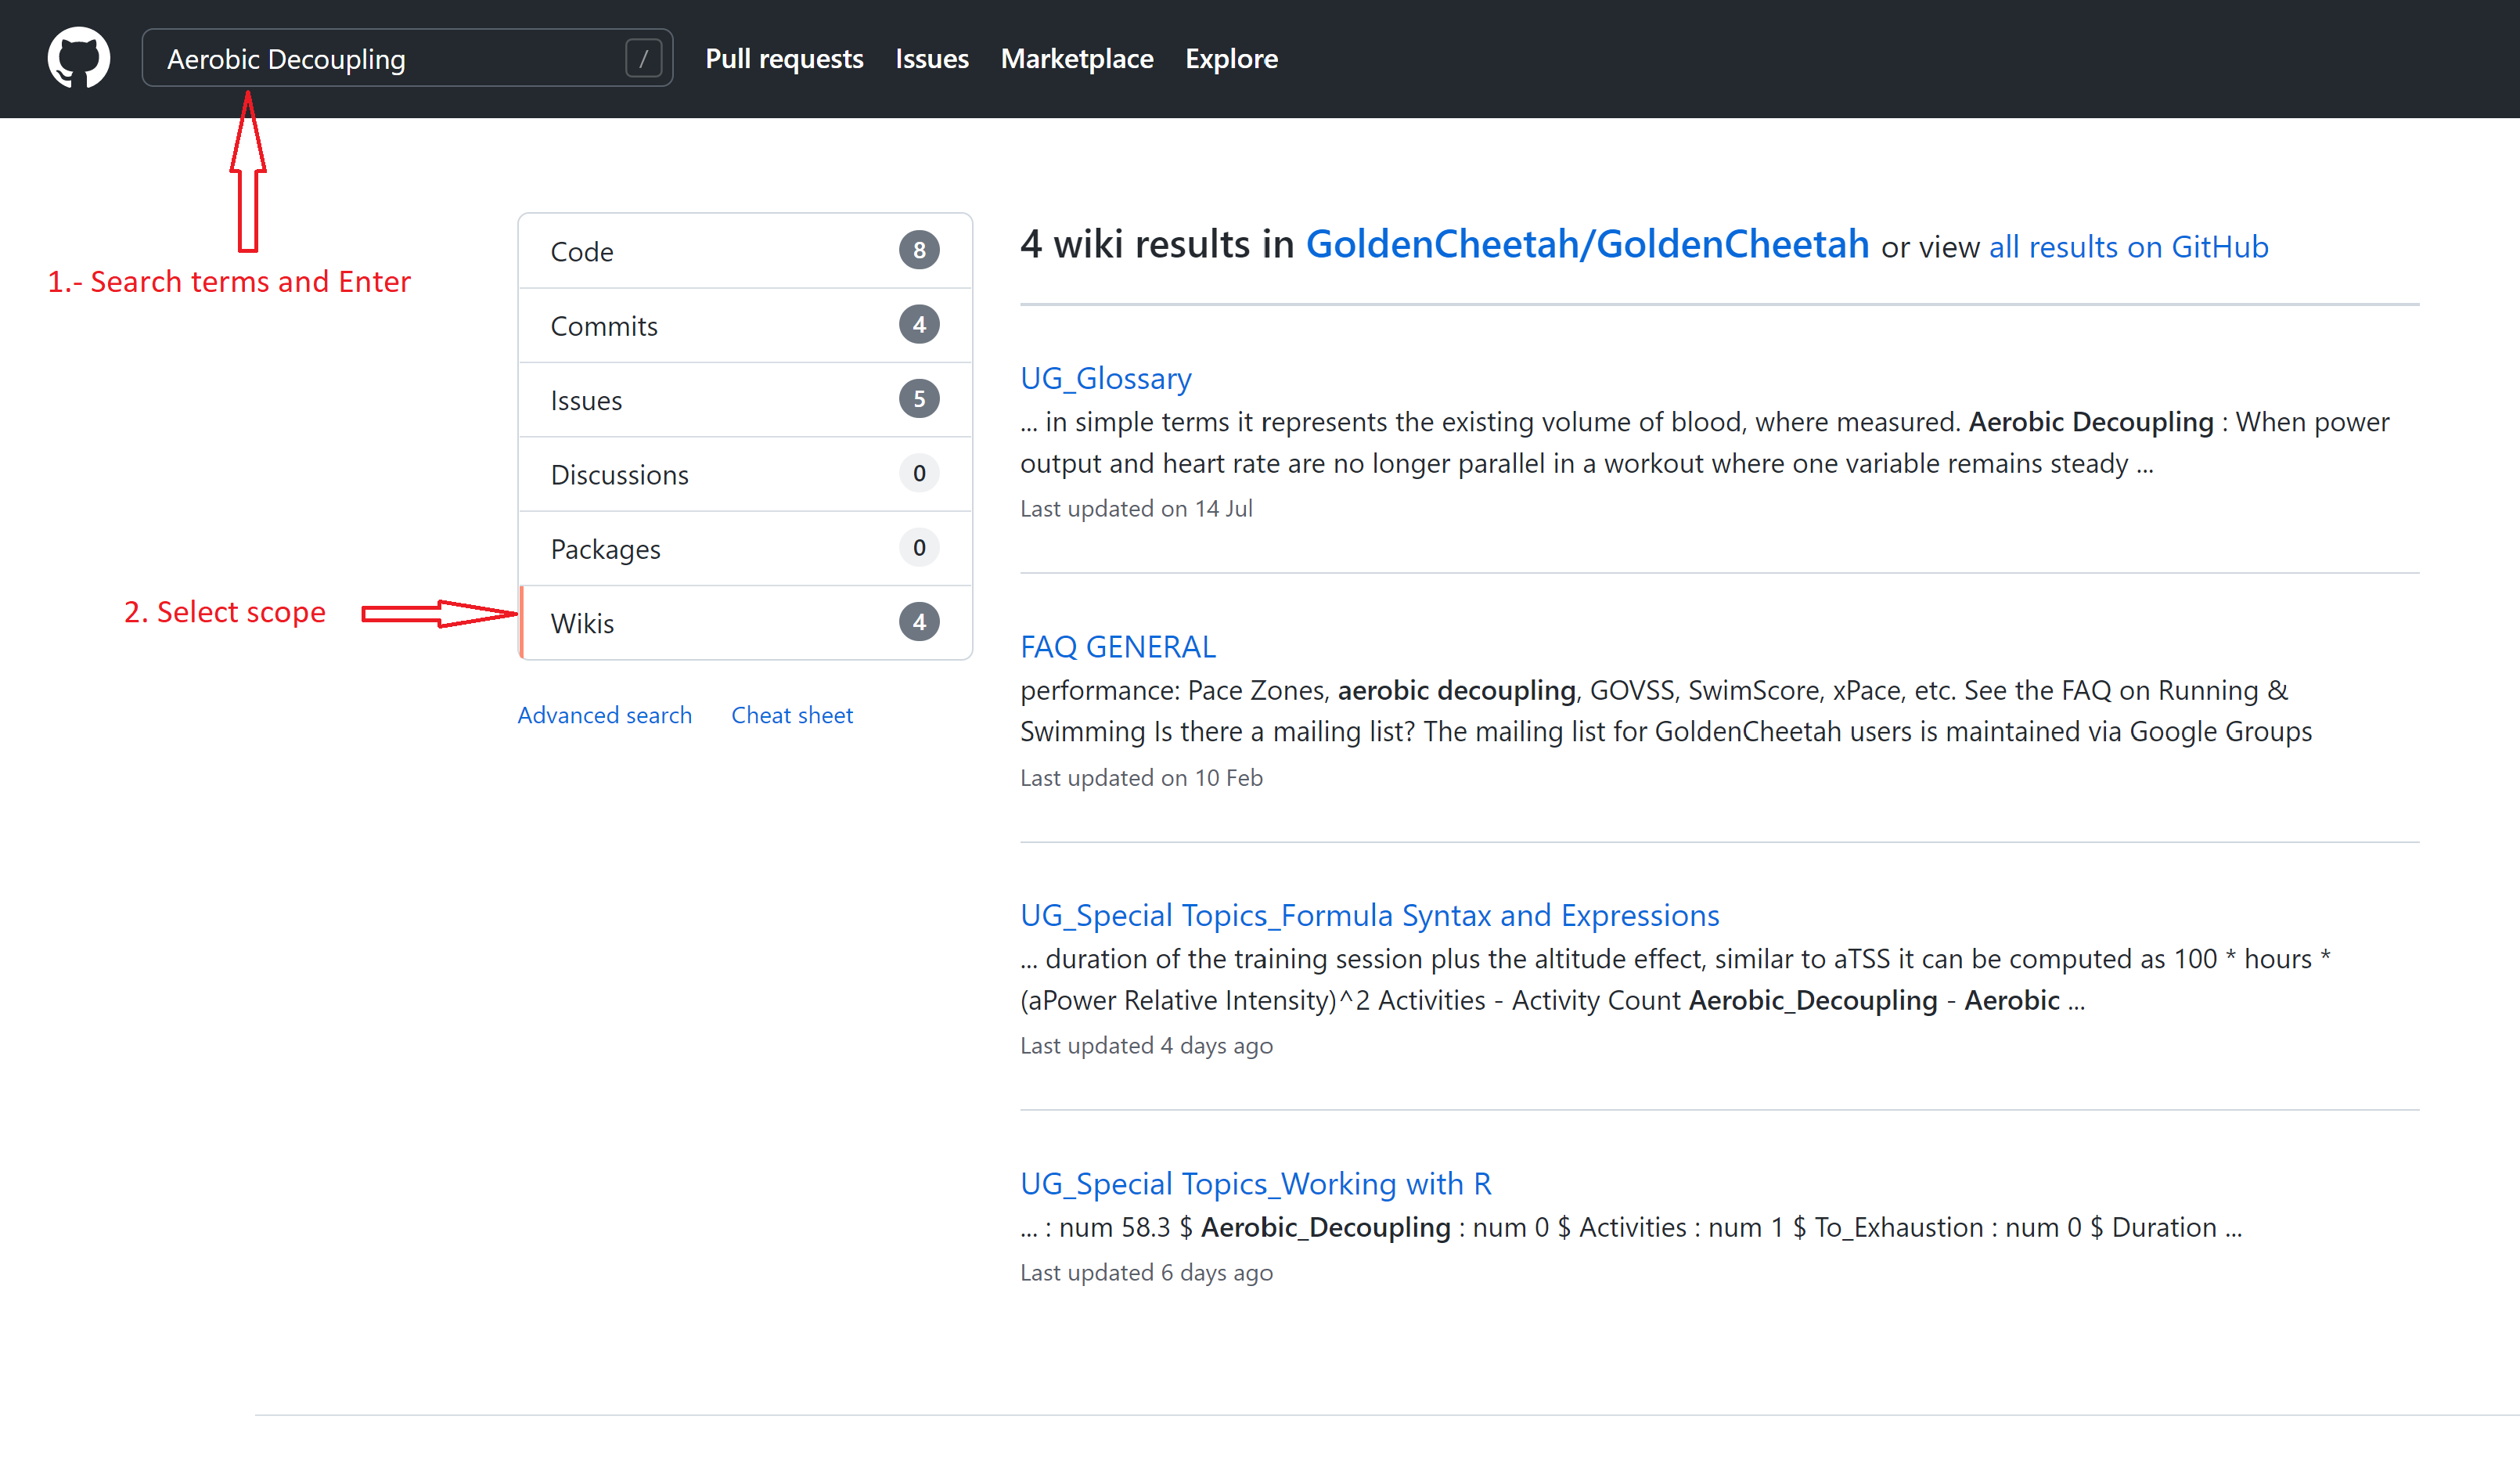
- Wikis (selected above) is useful when you are looking for documentation and FAQs
- Issues is useful when you think you found an unreported issue or you want to check a new feature or pending issue status
- Code is useful if you like to search the source code to see how some feature was implemented, etc.
- Commits is more technical and refers to changes in code
- Discussions are threads like Users forum, but in GitHub
- Packages are not being used in GC.
If you want to use advanced search facilities you can check the GitHub documentation (https://docs.github.com/en/search-github).
Last but not least: please do a little search before asking in the forums, discussions, issues, etc.
Why are my charts blank or data is missing?
The layouts and chart configuration is constantly evolving as we add new features and functions to the program. This means that configuration settings saved in the latest version will not work with earlier versions.
If you install a release candidate or the latest version and then switch back to an earlier version you will need to restore the configuration otherwise settings will be lost.
If you do not restore then you will find charts are blank or data is missing in both the trends charts and the library sidebar.
To resolve this issue in trends view you can reset the layout from the menu item View > Reset Layout and the sidebar chart library can be reset to default from the chart sidebar menu > Reset to default. In all cases layouts and charts will be updated to the newest application defaults.
Speed / Pace are "incorrect" when using Garmin's Smart Recording
Some headunits, notably Garmin, use a smart recording feature that does not record second by second samples. Instead they record at a variable rate. This is not supported by GoldenCheetah and needs to be fixed on import. It tends to break most metrics, but notably average speed/pace etc are the ones most commonly cited.
To get the variable samples corrected to fixed samples on import then you should enable Garmin Smart Recording in Preferences/Options. This will interpolate to a fixed sample rate.
If, after enabling Garmin Smart Recording and importing the file(s) again, the time-based data series derived by Golden Cheetah (time moving, average speed, time in zone, etc) are still off, it will be necessary to increase the Smart Recording Threshold, from the default value, which is 25 seconds.
How do I add or remove a chart?
To add a new chart to the view you can select from the hamburger menu on the right hand side of the chart bar.
Depending upon which view you are on the charts available will differ. For example realtime plots only appear on the Train view, whilst charts that work with individual rides will only appear on the analysis view.
To remove a chart, when you mouse over a chart (in tabbed or tiled mode) the word More...
will appear in the top left of the chart. This is a menu drop down, if you click on it
you will see a Close option. This is the option to remove (close) the chart.
Can I enter my weight and track/plot it?
See Weight Settings
How do I fix tiny text on high-DPI displays?
From v3.2 we publish binaries using QT5, from v3.3 we only publish binaries using QT5. You must use a QT5 based build on a high resolution display since it has builtin support for such devices. General advice regarding this can be found here: (http://doc.qt.io/qt-5/highdpi.html).
Font scaling can be set in Options/Preferences > Appearance and will show you the font as it will be rendered across GoldenCheetah. Also, new with Goldencheetah v3.6 there is a default font fallback scheme (to pick the most appropriate font on the basis of the fonts you have installed in your system. It will also automatically set a scaling factor for hidpi displays. This can be re-applied once installed by clicking on the Reset settings to default button that is at the bottom of the appearances configuration page.
Windows
When you start GoldenCheetah from the command line you need to pass a parameter to it to force text and graphics to be scaled to the higher resolution you have available. This means running:
$ GoldenCheetah -platform windows:dpiawareness=0
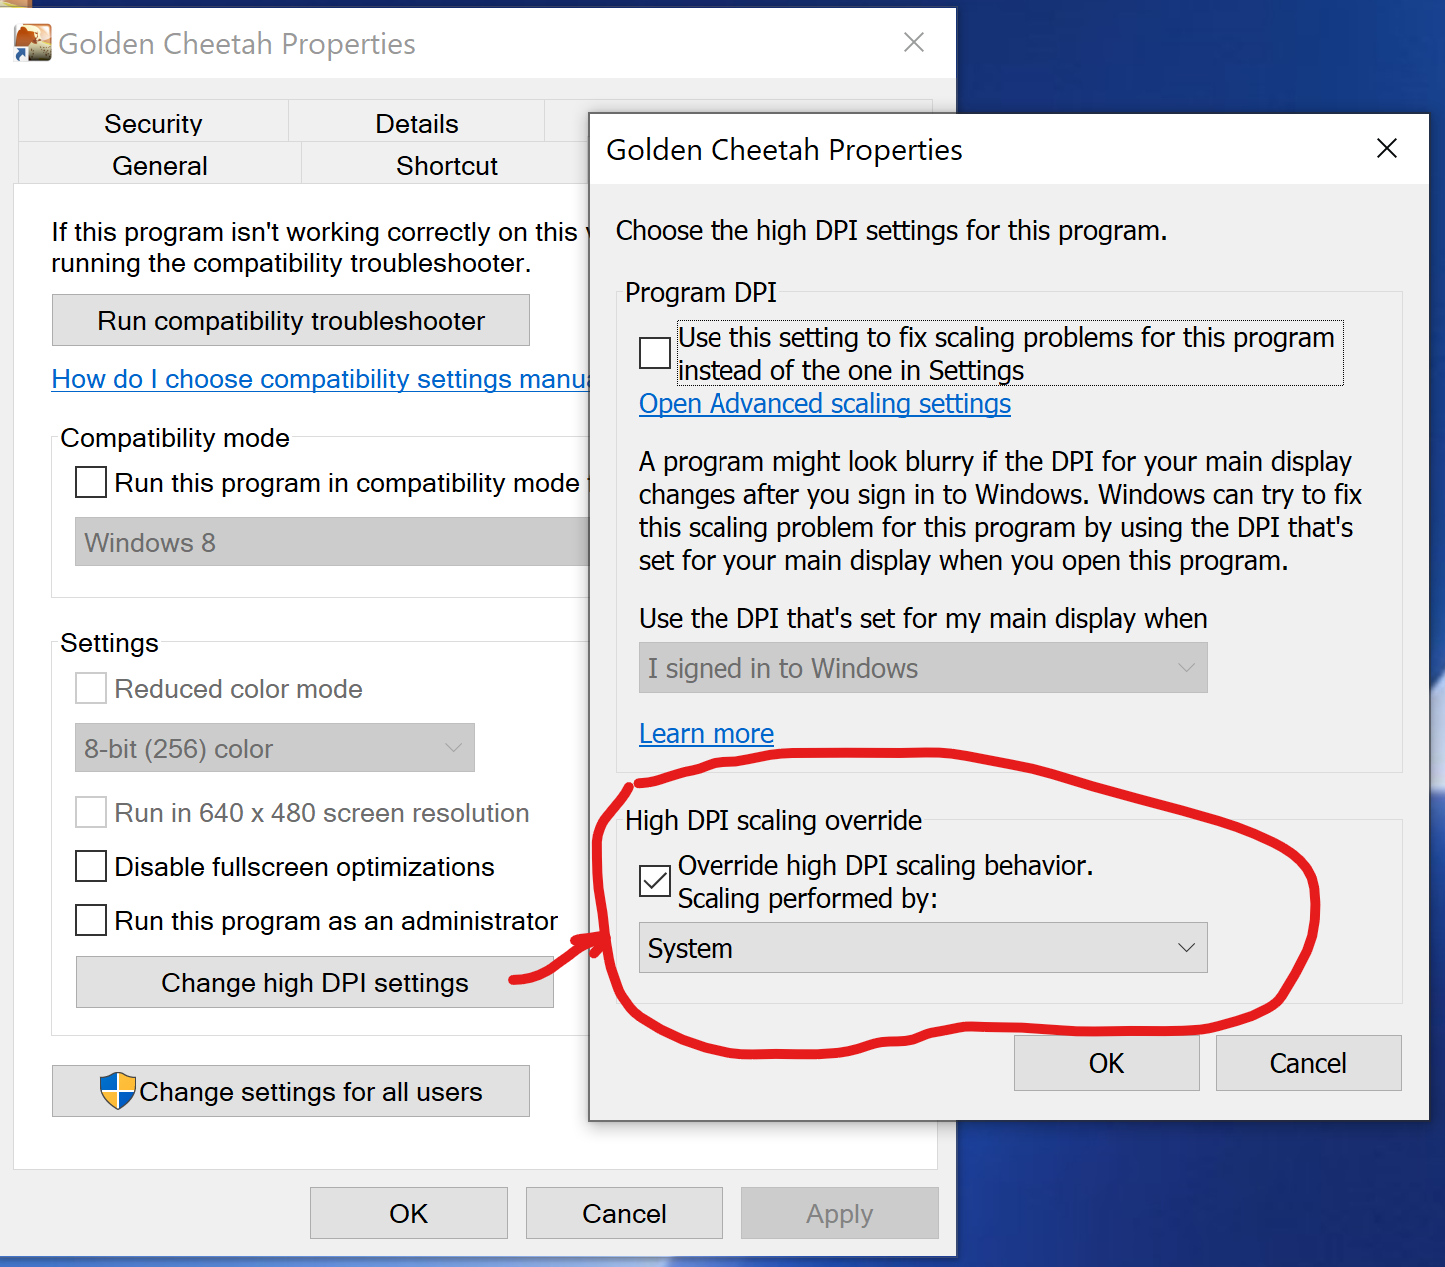
On Windows 10 some issues remain on Summary chart, Metric Trends charts in Table Mode and the mini-calendar in Activities view, to solve them, from the context menu on the GoldenCheetah shortcut, select properties and change high DPI settings to Override high DPI scalling / Scaling perfomed by System as shown below:
Linux
Since Qt 5.6, Qt 5 applications can be instructed to honor screen DPI by setting the QT_AUTO_SCREEN_SCALE_FACTOR environment variable, for example by creating a file /etc/profile.d/qt-hidpi.sh
export QT_AUTO_SCREEN_SCALE_FACTOR=1
And set the executable bit on it. If automatic detection of DPI does not produce the desired effect, scaling can be set manually per-screen (QT_SCREEN_SCALE_FACTORS) or globally (QT_SCALE_FACTOR). For more details see the Qt blog post.
Note if you manually set the screen factor, it's important to set QT_AUTO_SCREEN_SCALE_FACTOR=0 otherwise some applications which explicitly force high DPI enabling get scaled twice.
QT_SCALE_FACTOR will scale fonts QT_SCREEN_SCALE_FACTORS will not scale fonts
If you also set the font DPI manually in xrdb to support other toolkits - QT_SCALE_FACTORS will give you a huge fonts. Text will now be scaled to match the resolution of the display.
How do I plot x sec power best?
In v3.1 it is now possible to plot custom durations for any data series on a metric
trends chart in the Trends view. You will need to add a curve for the data series
and select Best instead of Metric or Estimate on the curve settings.
For v3.0 or earlier it is still not possible to plot custom durations for power bests. We are looking to add this in version 3.1, but for now you can only plot 1s, 5s, 10s, 15s, 20s, 30s, 1min, 2min, 5min, 10min, 20min, 30min and 60min bests.
I can't find Aerolab / Performance Manager?
By default we do not add these charts to the layout. Aerolab can be added to the Analysis
view via the + menu found to the right hand side of the GoldenCheetah scope bar.
The Performance manager has been deprecated in preference for using a trends chart and we have added 3 PMC style charts to the chart library to help transition.
We will be adding an interactive PMC in v3.2 to support planning and this will allow
you to set goals and drag the curves/load to set and adjust your plan, before looking at
specific workouts -- but this won't be available till 2015.
Where are all the chart settings?
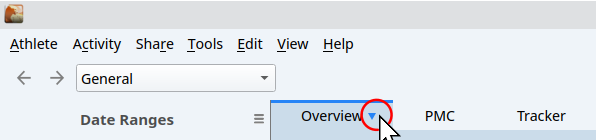
If you have chosen to navigate charts using tabs then the chart settings will be found on the tab bar menu, which can be opened directly from the tab itself:
 Otherwise chart settings can be found under the drop down menu that appears in the top left hand
corner of a chart when you mouse over it, titled
Otherwise chart settings can be found under the drop down menu that appears in the top left hand
corner of a chart when you mouse over it, titled More.... They will appear as a popup dialog box.
Additionally, when you move the cursor towards the title of a chart in a view that is tabbed (not tiled) then a small selection of the most important settings for the chart will appear for convenience.
Where is the preferences / options panel?
On a Mac the configurations page can be found under GoldenCheetah -> Preferences on the
main menu. Whilst on all other platforms it is found via Tools -> Options.
We do this to match the general guidelines for the operating system.
In v3.6 general options can be accessed using the options icon in the views sidebar and Athlete settings are separated as explained below.
Where are Athlete settings in v3.6?
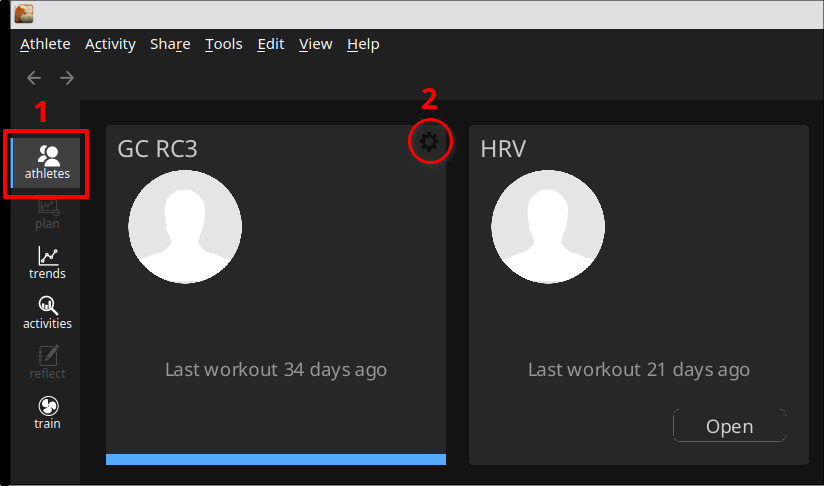
In v3.6 Athlete settings are separated from general settings and can be accessed via Menu Bar ->Athlete-> Settings..., or the settings ("gear") icon for the athlete in Athletes View:
General options can be accessed as usual, or using the options icon in the views sidebar.
How do I change the colour of the rides on the calendar/list?
Activities are coloured according to keywords embedded in their details (metadata) you can
configure the field that is used and the values that are matched and the colours they are
shown in from the preferences pane via the Data Fields toolbar option then select Notes
Processing. The keywords and related words are scanned for to determine if the associated
colour should be used for this ride.
They are processed in the order they are defined with the first match being returned. Take
care when using values such as TT and race since these can also be part of an English
word (e.g. ATTEMPT contains TT and graceful contains race.
Why the texts are in mixed languages and how it can be fixed?
GoldenCheetah translations are largely contributed by users and some of them can be incomplete, Portuguese and Japanese are the least updated as of this writing, if you want to contribute to update please see the Guidelines for translators
Additionally, if you change languages, not all text will be changed to the new language after restart, this is by design: all texts the user can customize are translated when the object is created, if you change the language afterwards they will remain unchanged to preserve user customizations.
Depending on what level of customization you want to preserve there are several alternatives:
- Full reset: create a new athlete and re-import your activities to have all texts in the new language
- Charts reset: Use View > Reset View and Reset to Default in Charts on Trends sidebar to recreate them. To preserve customized charts: export them before reset and re-import afterwards.
- Manual update: Metadata and Zone names can be manually updated in Options/Preferences, Metric Trends charts in chart options.
How can I open a predefined athlete or be prompted to select one at startup?
Default GoldenCheetah behavior at startup is to open the last opened athlete, if you have created multiple athletes and want to open a specific one at startup you can use the athlete's name as a command line parameter, if you want the Choose an Athlete dialog to open at startup to select an existing athlete, delete or create a new one, just add -- as a command line parameter. If you don't know what a "command line" parameter is and how to use it, please search the documentation for your operating system.
New to v3.6: when Start with last opened Athlete configuration option is cleared the Choose an Athlete dialog will be prompted at startup.
How can I track subjective data even on rest days?
From v3.6 GoldenCheetah has configurable daily measures which can be used for this purpose, for example if you want to track a daily Mood score plus a descriptive text you can add a mesures group s.t.:
Then, after restart, you can track your daily subjective data -even for rest days- in the daily view of the new Calendar chart available from v3.7-sp1: