Gallery - GerHobbelt/d3 GitHub Wiki
Wiki ▸ Gallery
Welcome to the D3 gallery! Feel free to add links to your work! More examples are available on bl.ocks.org/mbostock. If you want to share an example and don't have your own hosting, consider using Gist and bl.ocks.org.
<td>Box Plots<br><a href="http://bl.ocks.org/mbostock/4061502"><img src="http://d3js.org/ex/box.png" width="202"></a></td>
<td>Bubble Chart<br><a href="http://bl.ocks.org/mbostock/4063269"><img src="http://d3js.org/ex/bubble.png" width="202"></a></td>
<td>Bullet Charts<br><a href="http://bl.ocks.org/mbostock/4061961"><img src="http://d3js.org/ex/bullet.png" width="202"></a></td>
<td>Calendar View<br><a href="http://bl.ocks.org/mbostock/4063318"><img src="http://d3js.org/ex/calendar.png" width="202"></a></td>
Non-contiguous Cartogram
|
Chord Diagram
|
Dendrogram
|
Force-Directed Graph
|
Circle Packing
|
Population Pyramid
|
Stacked Bars
|
Streamgraph
|
Sunburst
|
Node-Link Tree
|
Treemap
|
Voronoi Diagram
|
Hierarchical Edge Bundling
|
Voronoi Diagram
|
Symbol Map
|
Parallel Coordinates
|
Scatterplot Matrix
|
Zoomable Pack Layout
|
Hierarchical Bars
|
Epicyclical Gears
|
Collision Detection
|
Collapsible Force Layout
|
Force-Directed States
|
Azimuthal Projections
|
Choropleth
|
Collapsible Tree Layout
|
Zoomable Treemap
|
Zoomable Partition Layout
|
Zoomable Area Chart
|
Drag and Drop Collapsible Tree Layout
|
Rotating Cluster Layout
|
Sankey Diagram
|
Fisheye Distortion
|
Hive Plot
|
Co-occurrence Matrix
|
Motion Chart
|
Chord Diagram
|
Animated Béziers
|
Zoomable Sunburst
|
Collatz Graph
|
Parallel Sets
|
Word Cloud
|
Obama's Budget Proposal
|
Facebook IPO
|
Political Influence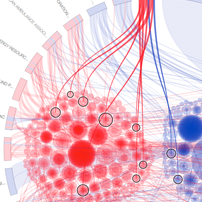
|
Federal Budget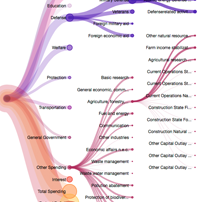
|
US Trade Deficit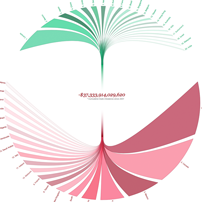
|
Sequences sunburst
|
Koalas to the Max
|
Particles
|
Indented Tree
|
Rounded Rect
|
Tadpoles
|
Showreel
|
Euro Debt
|
Labeled Force Layout
|
Circle-Square Illusion
|
Voronoi Picking
|
Zoomable Map
|
Raindrops
|
Color
|
Parallel Coordinates
|
Hacker News Popularity
|
Life Expectancy
|
Slopegraphs
|
NCAA Predictions
|
Cubism.js
|
Crossfilter.js
|
Wind History
|
Cubic Hamiltonian Graphs
|
Force-Directed Voronoi
|
Trulia Trends
|
Trulia Trends
|
Open Budget
|
Bederson Publications
|
Force Layout Editor
|
Open Knowledge Festival
|
Hierarchical Classification Tree
|
Gene Expression |
spacetime
|
d3 Analog Clock Dashboard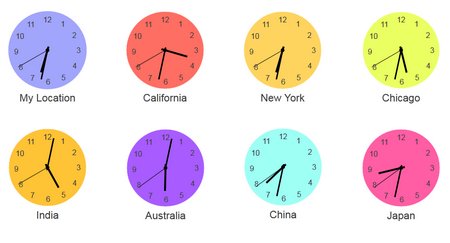
|
Concept network browser
|
Circular heat chart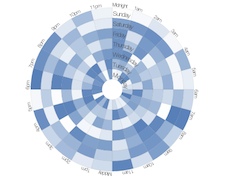
|
Convert any page into bubbles
|
Directed Graph Editor
|
Weeknd3 |
Explosions |
CodeFlowers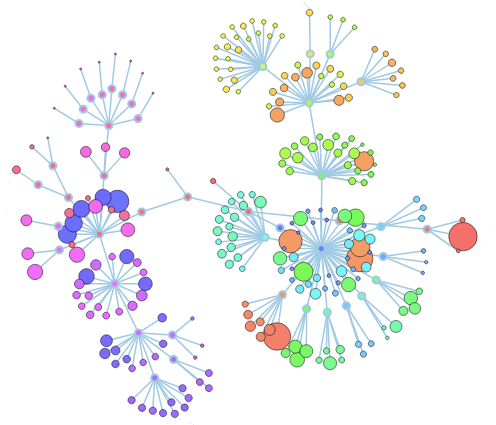
|
Animated wind chart
|
What makes us happy?
|
Simple SOM Animation
|
A mower demo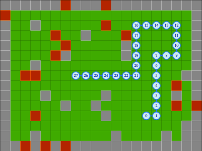
|
Map and context with brushing
|
Binary tree with transitions
|
d3+ColorBrewer
|
D3 JezzBall
|
Tetris
|
Gantt Chart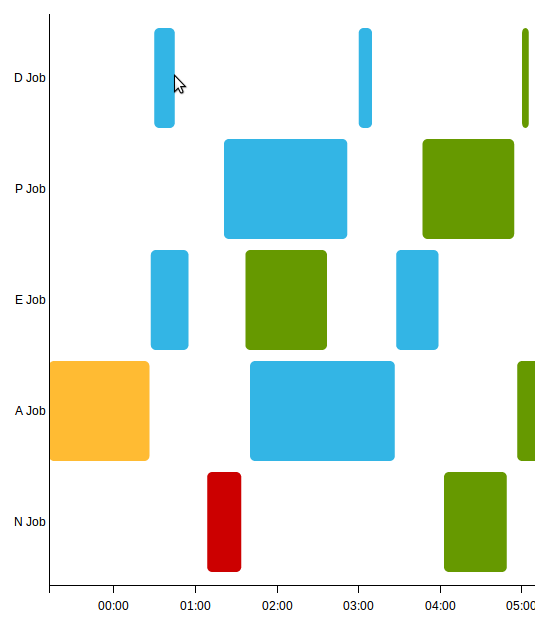
|
Day/Hour Heatmap
|
Sunburst and parse.com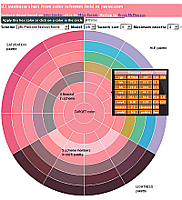
|
Worldwide remittance flows
|
Language Network
|
Wimbledon 2012
|
Force directed tag/site explorer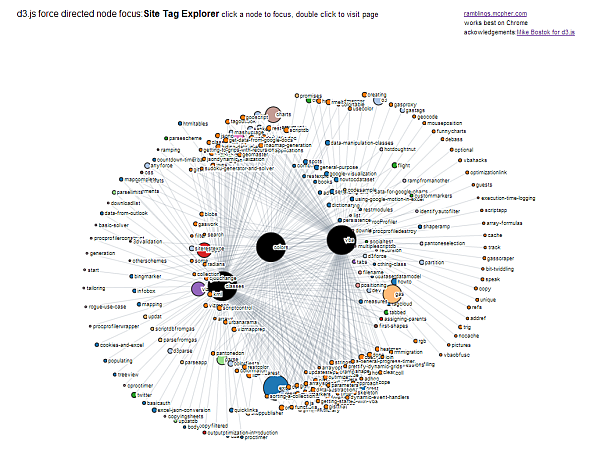
|
Bus transit data
|
Airline data from Fusion Tables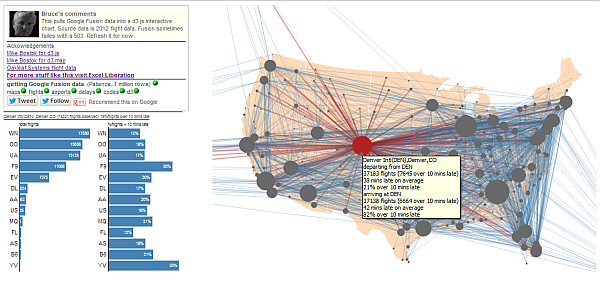
|
Geographical hexbins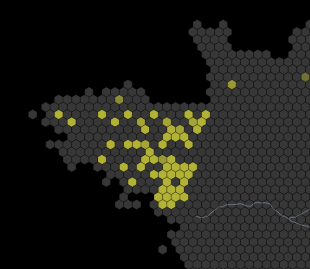
|
xkcd-style Comic Narrative Charts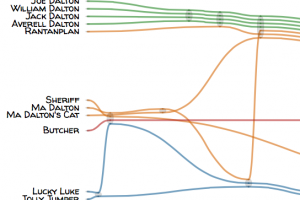
|
GitHub Visualizer
|
WorldBank Contract Awards
|
Site or blog concept browser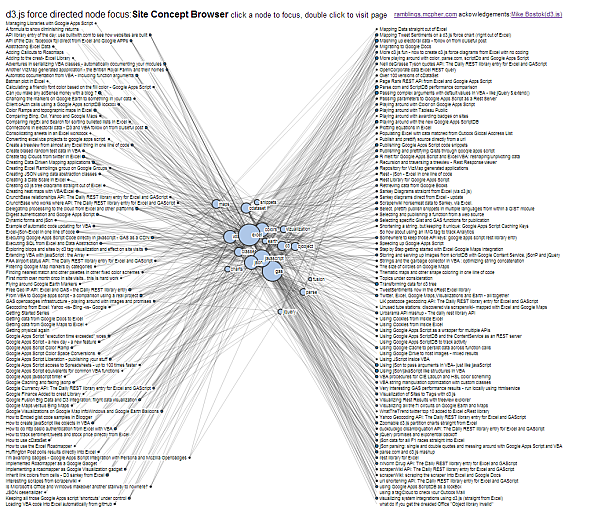
|
Global power structure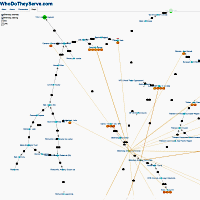
|
Choropleth on canvas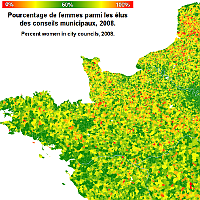
|
Google calendar like visualization
|
Interactive Sales Data Pie Chart
|
Wikistalker - Wikipedia Visualization
|
D3 Cesium - Health and Wealth of Nations
|
Starpaths
|
BT Hotspots mapped 
|
CoreNLP Sentence Parse Tree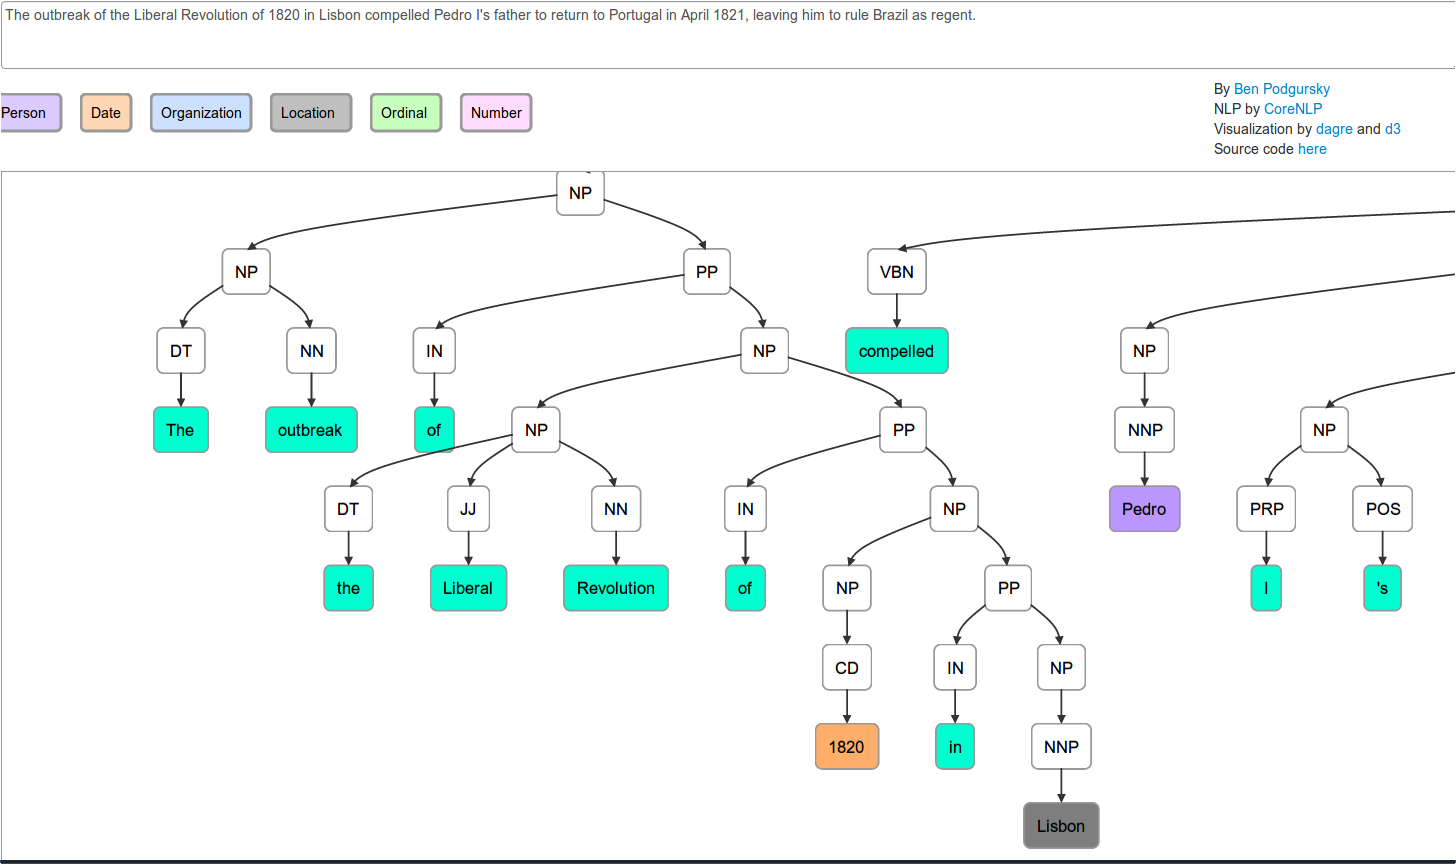
|
Publications in journals over time
|
Another state budget visualization with open api
|
Interactive Bible contradictions & bar charts [source]
|
Force Edge Bundling For Graphs [Source & Docs] [Source & Docs] |
Gauge
|
Bullet Charts
|
Arc Axis
|
Bar chart with tooltips
|
Tokyo Wind Map
|
Dependency Wheel
|
60 years of french first names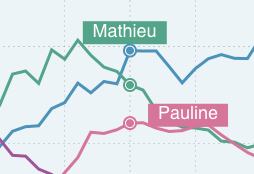
|
Hip Replacement by State
|
Compare time series with irregular interval
|
Table with Embedded Line Chart
|
Dual-scale Bar Chart
|
Animated Pie and Line Chart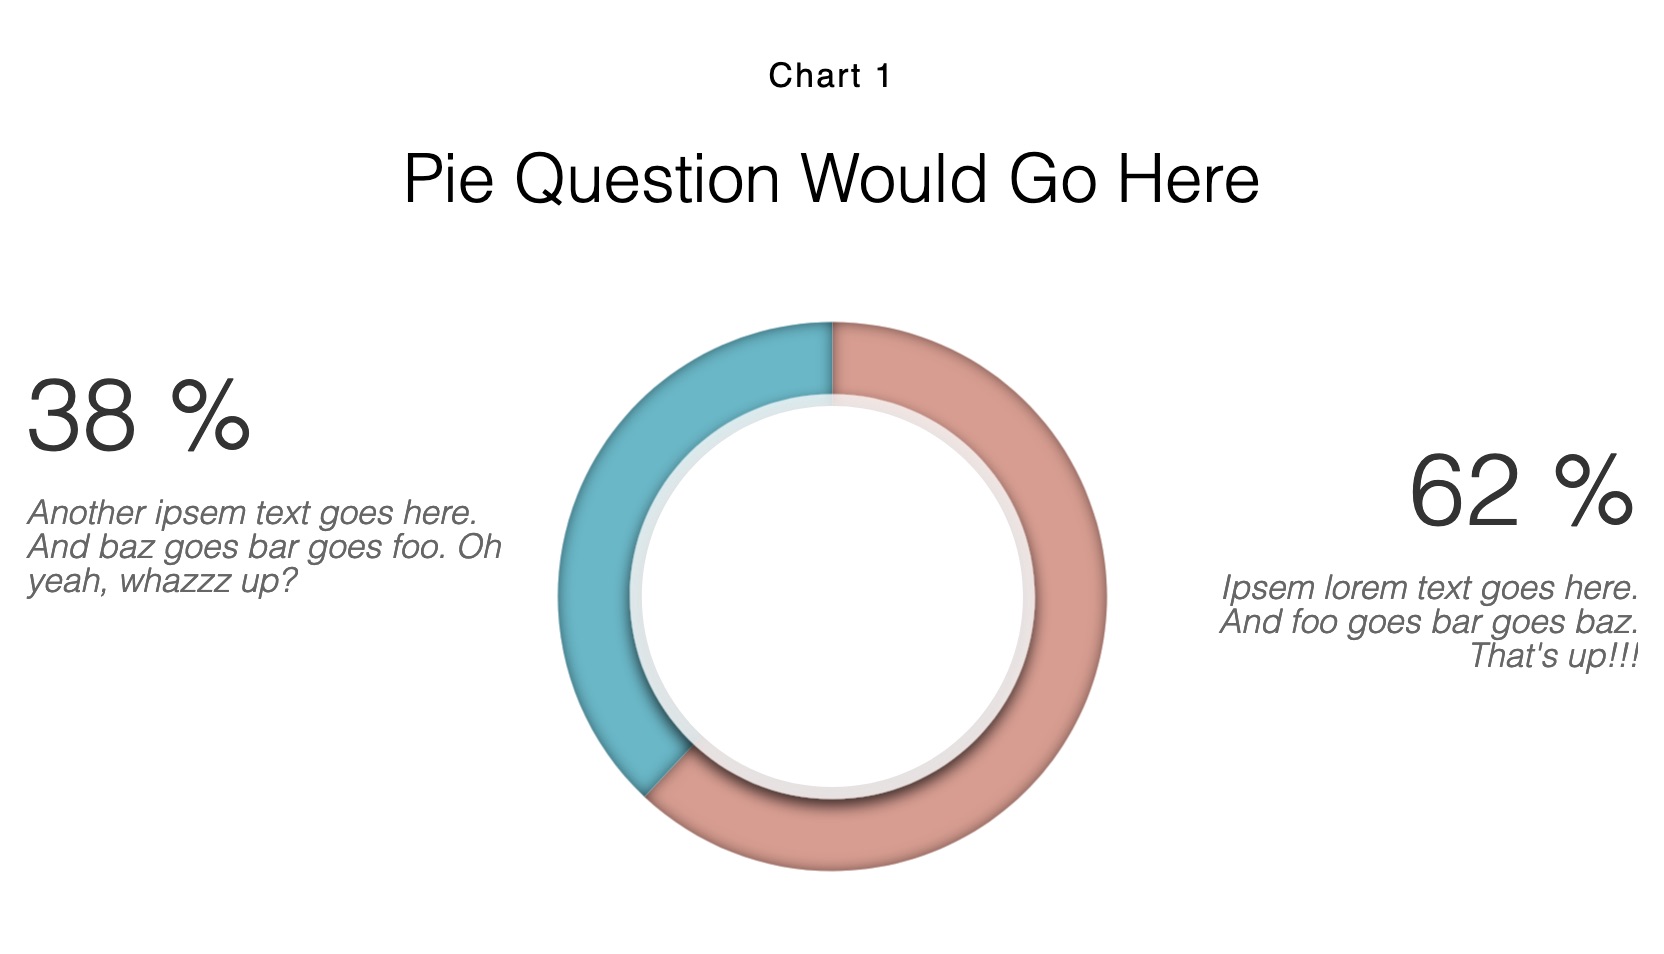
|
Multivariate Data Exploration with Scatterplots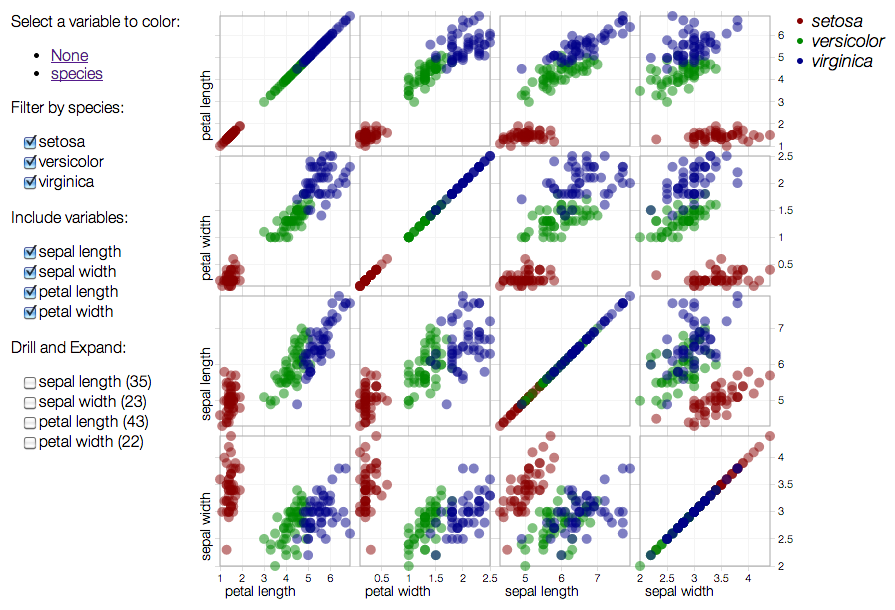
|
Live Power Outages In Maine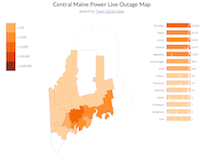
|
Relative Size Of The Planets
|
AWS EC2 Price Comparison Chart
|
Hurricane Forecast Path Evolution
|
Sandy's Storm Surge
|
Monthly NCDC Climate Summary
|
Epidemic Game 
|
UK Temperature Graphs
|
Data Heatmap with Sorting Functions
|
Node-Link Tree Showing Branches of Government
|
3D Force Layout
|
Rotating Arcs
|
Lifespan
|
The Movie Network
|
Bowls with Liquid
|
BiPartite Visualization
|
BeerViz
|
3D Donut
|
Graceful Tree Conjecture
|
Gradient Pie
|
Top Scorers in 2013/14 Champions League - Breakdown analysis
|
Sankey: How a Georgia bill becomes law
|
A game based on d3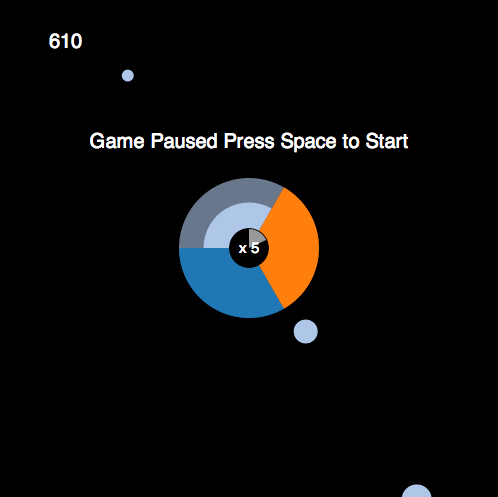
|
Viroscope - virus taxonomy viewer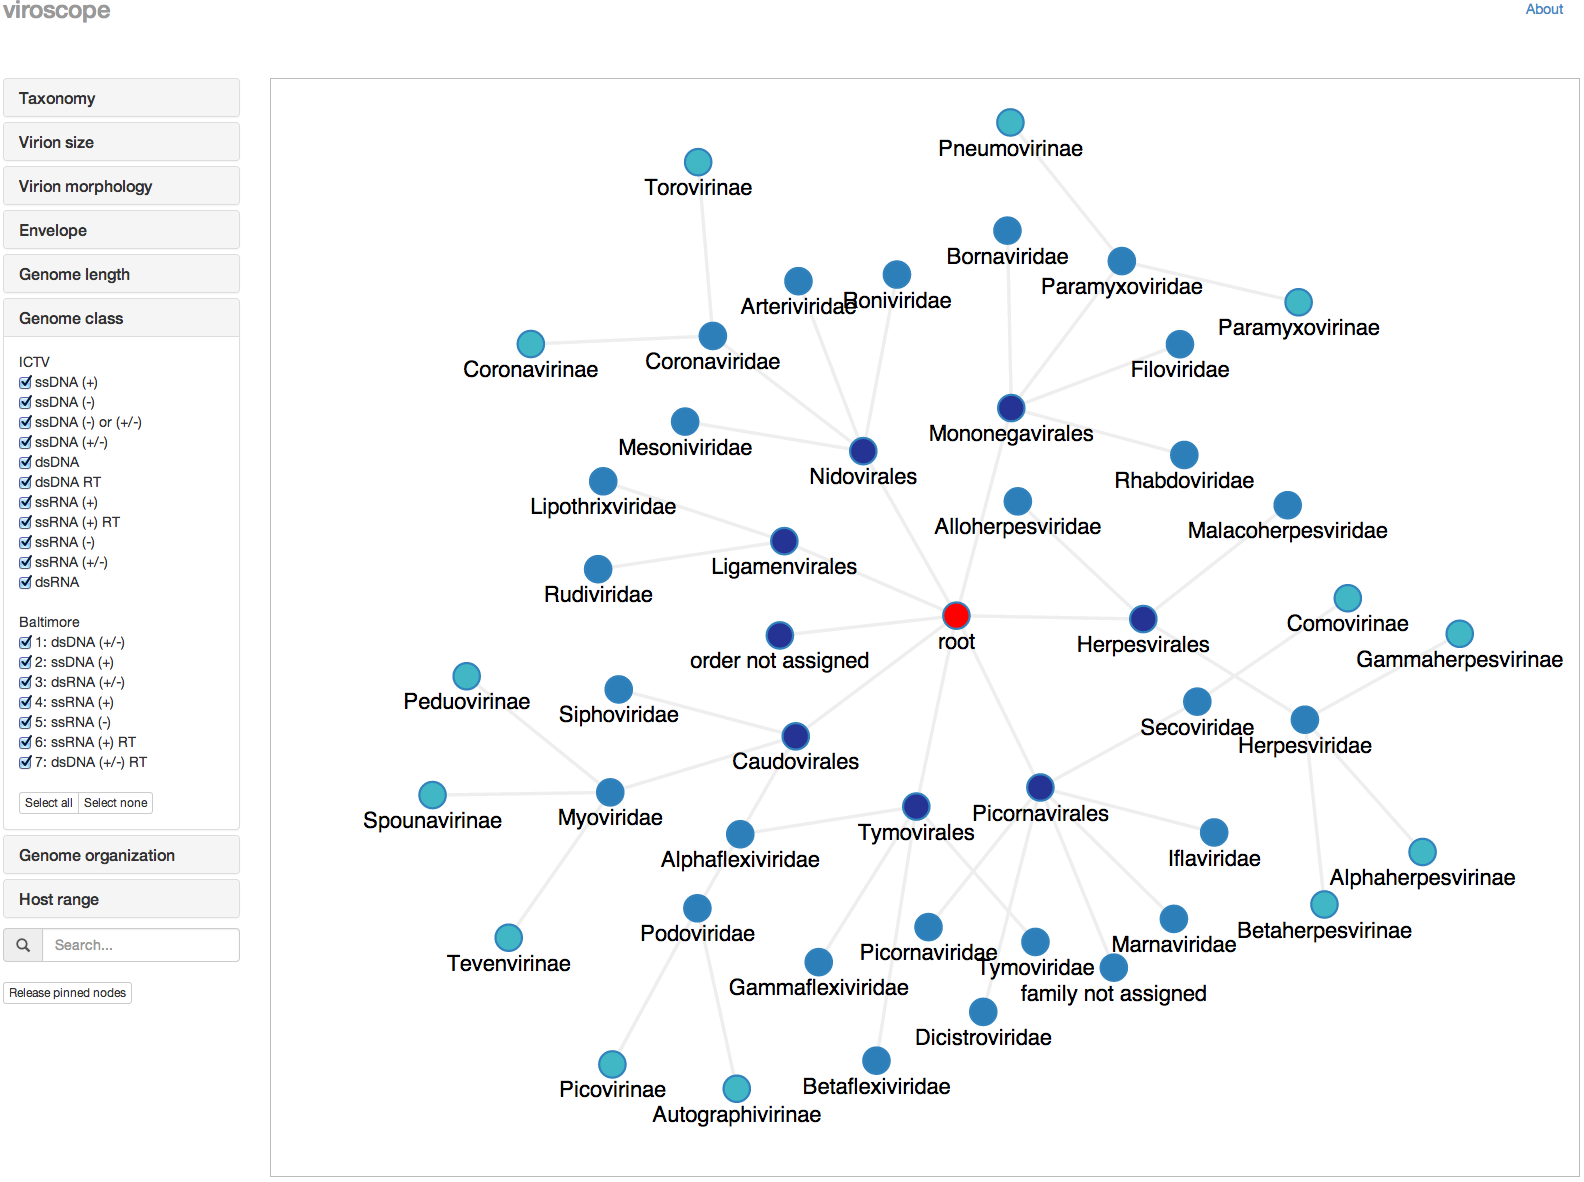
|
Twitter & Reddit topics during week one of MH-370's disappearance
|
Eurovision song contest voting oddities
|
SizeViewer
|
Area Chart
|
Line Chart
|
Bivariate Area Chart
|
Multi-Series Line Chart
|
Stacked Area Chart
|
Bar Chart
|
Stacked Bar Chart
|
Normalized Stacked Bar Chart
|
Grouped Bar Chart
|
Scatterplot
|
Donut Chart
|
Pie Chart
|
Donut Multiples
|
Bar Chart with Negative Values
|
Animated Donut Chart with Labels
|
Stacked Bar Charts on time scale
|
Bar Chart Multiples
|
d3pie - pie chart generator and lib

|
General Update Pattern
|
Sortable Bar Chart
|
van Wijk Smooth Zooming
|
Progress Events
|
Margin Convention
|
Focus+Context via Brushing
|
Difference Chart
|
Pie Chart Update
|
Hexagonal Binning
|
Contour Plot
|
Build Your Own Graph
|
Modifying a Force Layout 
|
Spline Interpolation
|
Dispatching Events
|
Better force layout selection
|
v45 web theme using SVG
|
Interactive force layout
|
- Government Sequester 2013 - Enigma
- [World Inequality Database on Education] (http://www.education-inequalities.org/) - UNESCO
- [Are global CO2 emissions still rising?] (http://infographics.pbl.nl/website/globalco2/) - Allard Warrink and Jeroen Dolmans
- [BLOSUM Substitution Matrices as a Dynamic Network (force layout)] (http://ahmetrasit.com/blosum/) - Ahmet R. Ozturk, Ankara
- [50 Years of Change (map, matrix, and block bar chart)] (http://50yearsofchange.com/) - Erin Hamilton, Rashauna Mead, and Vanessa Knoppke-Wetzel, UW-Madison
- [Hurricane #Sandy Twitter DataViz] (http://geo-odyssey.com/links/sandy/) - Chris Cantey, Caroline Rose, Morgan Jarocki, UW-Madison
- Distribution of Grant Awards in Fiscal Year 2013, (github), global-development-sprint version 23 - [Artem Zubkov] (https://github.com/artzub)
- [Commuting Scales, Lausanne Campus commuters] (http://choros.ch/cs/) - Boris Beaude and Luc Guillemot
- [Disk Space Visualization] (http://wheresmydiskspace.com/) - Lou Montulli
- [Visualization of the Flask Source Code] (http://www.andreas-dewes.de/code_is_beautiful) - Andreas Dewes ([bl.ocks.org] (http://bl.ocks.org/adewes/4710330))
- [Violence in Nepal] (http://nepal.icbl.org/data-ncbl-main) - Shirish Pandey
- Photography Stats Analysis (bottom of the page) - Remi Escola
- StockTwits Social Heatmap - StockTwits
- Social web use in 2009 - Nikhil Bobb
- Visualizing opinons around the world (zoomable world map and interactive pie chart) - Siamac Fazli, Bastian Venthur
- Running Away Balloons - simple game - Astek
- A Photographer's infographic - Najeem Muhammed
- Visualizing word density in the Bible - Gary Lee
- [Election 2012 Social Dashboard (interactive Twitter visualization)] (http://events.current.com/social_dashboard) - Current TV
- Visualizing document similarity over time
- Drought during Month
- Interactive Publication History - Ben Bederson
- Visualizing Networks with Hive Plots
- The Wealth & Health of Nations
- Bézier Curves, Collatz Graph, Word Cloud and many Mathematical Visualisations - Jason Davies
- Koalas to the Max! - Vadim Ogievetsky
- Urban Water Explorer - Jan Willem Tulp
- What Do You Work For? - Jeffrey Baumes
- Misc. Examples - Justin Palmer
- Collusion FireFox Addon - Atul Varma
- UK University Statistics - Keming Labs (Kevin Lynagh)
- Slopegraphs - Hamilton Ulmer
- Marmoset chimerism dotplot - David Rio Deiros
- UN Global Pulse 2010 Visualization - Eduardo Graells & Ruth Garcia
- U.S. Population Pyramid - Jeff Heer
- WindHistory.com: maps and charts - Nelson Minar
- Students' seating habits - Ali Almossawi
- World Wide Women's Rights - Wimdows.nl
- Old Visualizations Made New Again - Jim Vallandingham
- Scatterize - Nate Vack
- Various visualisations especially with d3.geo - Lars Kotthoff
- Global Life Expectancy - Nathan Yau (FlowingData)
- Vegetable Nutrition w/ Parallel Coordinates - Kai Chang
- London Olympics Perceptions - Donuts to Chord Diagram Transition - Kyle Foreman, Peter Hamilton, Cristina Grigoruta
- Colony - Visualising Javascript projects and their dependencies - Hugh Kennedy
- Euro Debt Crisis
- Fuzzy Link-Bot - Entity co-occurrence in music news by Andrew Collins.
- Job Flow
- Visualizing a newborn's feeding and diaper activity - Jimmie Yoo
- Inequality in America - EJ Fox for Visual.ly
- Current Article Popularity Trends on Hacker News - Vadim Ogievetsky
- Hacker News statistics using PhantomJS
- AFL Brownlow Medalists, Summer Olympics Home Ground Advantage, Formula 1 Lap Chart, When is Easter? and David Foster Wallace's "Infinite Jest", and more... - Chris Pudney (VisLives!)
- Uber Rides by Neighborhood
- Les Misérables Co-occurrence
- Les Misérables 'Gap Heat Map' Co-occurrence
- US Elections 2012 / Twitter
- Major League Baseball Home Runs, 1995-2010 - Ken Cherven (Visual-Baseball.com)
- Color: a color matching game - Maria Munuera and Mark MacKay
- NCAA 2012 March Madness Power Rankings - Angi Chau
- iTunes Music Library Artist/Genre Graph - Christopher Martin
- A Race to Entitlement
- Visualising New Zealand's Stolen Vehicle Database Part1 and Part2 and source code
- Visualizing San Francisco Home Price Ranges
- Daily data return rates for seismic networks in the EarthScope USArray - Rob Newman, Array Network Facility, UCSD
- What Size Am I? Finding dresses that fit - Anna Powell-Smith
- Baseball 2012 Predictions based on past 6 years - Danny Hadley
- Last Chart! - See the Music
- Multiple visualization from the Société Typographique de Neuchâtel - Vincent Hiribarren
- Prime numbers pattern
- Interactive visual breakpoint detection on SegAnnDB - Toby Dylan Hocking
- Coordinated visualizations for Consumer Packaged Goods
- eCommerce API Wheel for eBay - Saranyan Vigraham
- The business of Bond
- Home energy consumption - Peter Cook
- Heatmap of gene expression with hierarchical clustering , [demo here] (http://blog.nextgenetics.net/demo/entry0044/) - Damian Kao
- [Graph diagram of gene ontology] (http://blog.nextgenetics.net/?e=19), [demo here] (http://blog.nextgenetics.net/demo/entry0019/demo.html) - Damian Kao
- [UMLS (Unified Medical Language System) Visualizer] (https://ncc.cchmc.org/prod/umls_visualizer/index.do)
- University of Washington Departments - Matthew Sorensen
- Baby Names in England & Wales - Anna Powell-Smith
- Realtime webserver stats - demo - (Github, Github) - Andrew Weeks
- TradeArc - Arc Diagram of Offseason NHL Trades, (Github) - Nathan Stehr
- Visualizing Swiss politicians on Twitter using D3.js - Ralph
- Close Votes - visualizing voting similarities for the Dutch 2012 national elections - Jan Willem Tulp
- Multiple Area charts and a brush tool - Tyler Craft
- Enumerating vertex induced connected subgraphs - Robert Kozikowski
- Startup Salary & Equity Compensation - Jared Jacobs (wealthfront.com)
- Pyramid charts: demographic transition in the US
- Floating bubble chart: De Maastricht au traité budgétaire : les oui et les non de 39 personnalités politiques
- Exploring d3.js with data from my runs to plot my heart rate
- Is Barack Obama the President? (Balloon charts)
- Audio Spectrum Analyzer - Ari Russo
- Browser usage plurality - Ali Almossawi
- Places in the Game of Thrones - Jérôme Cukier
- A Visit From The Goon Squad - Interactive Character Map - Filip Zembowicz
- Twitter Influencer Visualization - Erik Driessen
- Chicago Ward Remap Outlines - Christopher Manning
- Minute: record of all of my keystrokes - Tom MacWright
- Olympic Medal Rivalry - Makoto Inoue
- Visualizing U.S. Births and Deaths in Real-Time - Brad Flyon
- Vélib network visualization - Cyril Gantzer
- Events in the Game of Thrones - Jérôme Cukier
- Chart Wheel Visualization - Anil Omanwar
- Comparing the same surveys by different polling organizations (polish) and translated in english - smarterpoland
- Confidence interval in poll surveys and translated in english - smarterpoland
- Forecast of Mexican 2012 presidential election - Diego Valle-Jones
- Romanian parliamentarian bubble chart. In Romanian - Harta Politicii
- Linked Jazz network graph - Matt Miller
- Bibly v2: Visualizing word distribution within the KJV bible - GARY LEE & ANIRUDH VENKATESH
- A physics model of a physics model - Michiel van der Blonk
- OECD Health, Government Spending, and Obesity Rates (nvd3) - Amelia Mango
- The first thing that should be shown in any Trigonometry class
- How educated are world leaders? - Ali Almossawi
- Dynamic charts and dynamically populated charts - Marcello La Rocca
- Radial Line Chart and Chart Wheel - Anil Omanwar
- Indo-European concepts, cognates, and etymologies - Joseph Nudell
- Remix of the Century - Henrik Pettersson, David Vella, and Tom Hannen
- Displaying real-time data - Marcello La Rocca
- “Decide the Czech 2013 Presidential Election” interactive visualization - Vojtech Hyza, Karel Minarik, Josef Slerka (about, source)
- Mass Gun shootings in USA - Nanda Yadav
- Clock visualization Dashboard
- UK Rainfall 1910-2012 - Peter Cook
- Modal Logic Playground - Ross Kirsling
- [Slopegraph - 1 static & 1 with d3] (http://www.streamlinedataworks.com/example6.html) - Anna Mehrotra
- [Collection of 9 dynamical systems examples] (http://sigsystext.com) - interactive examples found under educational material - Sean Summers
- [Expected university tuition growth 2030] (http://rumachine.com/tuition/expectedgrowth.html) - Sean Summers
- Standings Slopegraph - Slopegraph of weekly NHL standings for 2012-13 season, (Github) - Nathan Stehr
- [Amsterdam Economic Performance 1995-2011] (http://www.iconomical.com/customers/Amsterdam-EZ/release/) - Iconomical
- Examination Results in Karnataka, India | Dashboard with maps - Sajjad Anwar
- 2002-2011 International Phone Call Traffic bar chart with time series
- Influence Map: Women & Leadership - Dane Lyons
- The State of Do Not Track - Mozilla
- Personal texting trends demo (using dc.js) - Joseph Nudell
- Worldwide remittance flows - David Bauer, Ilya Boyandin und René Stalder
- Evolution of the Firefox Codebase - Ali Almossawi
- Language Network - José Cotrino
- Superposed areas for comparing 2 values - Etienne Ramstein
- Object constancy through many types of buble charts - Etienne Ramstein
- The Fundamental Theorem of Arithmetic, source - Adam Becker
- Global Oil Production & Consumption since 1965 - Timo Grossenbacher
- Swiss Votes Explorer - Timo Grossenbacher
- Electrical field lines and Equipotential surfaces simulation - Pance Cavkovski
- Artefacts of the Collective Unconscious - Noah Pedrini and David Patman
- Starpaths - José Cotrino
- Most common birthdays - David Bauer
- Premier League Transfers, 1992-2013 - Joseph Nudell
- Relative Size Of The Planets - Keith Watson (best in Safari, where I can get the drop shadow to work)
- Most Expensive Football Transfers: How the Money Flows - Ramiro Gómez
- User-Specific LinkedIn Social Network Visualization and Analysis - Craig Tutterow
- Interactive Stacked Bar Chart of US Population - Zhou Yu
- Arapahoe Basin Ski Slopes Vizualized - David Wilson
- D3-dateline - horizontal timeline, force-directed - Peter Binkley
- Visualizing K-Means Clustering - Naftali Harris
- Australian Election Preferences - Peter Neish
- Lifespan - José Cotrino
- Millennium Development Goals and Economic Growth - Helen Jackson
- Weather and UK Agricultural Yields Regression Results - Helen Jackson
- Simple Schelling Model of Urban Segregation - Helen Jackson
- Sensitivity Analysis of Renewable Technology Costs - Helen Jackson
- UK Electricity Supply Crunch - Helen Jackson
- [New Years Resolutions and Search Trends] (http://www.bytemuse.com/post/resolutions-and-search-trends/) - Chris Polis
- [Geometric Proof of the Pythagorean theorem] (http://www.bytemuse.com/post/geometric-proof-of-the-pythagorean-theorem-in-d3-js/) - Chris Polis
- [NHL Cap Hits] (http://caphits.com) - Joe Meissler
- [Top words and the words they frequently appear with in American Hip-Hop] (http://hiphop.laserdeathstehr.com/) - Nathan Stehr
- [Sochi Winter Olympics Medals by Country and Sport] (http://www.bytemuse.com/post/sochi-winter-olympics-medals-by-country-sport/) - Chris Polis
- Process map and documentation using an interactive force layout - James Nylen
- Beijing Air Pollution Visualization - Scott Cheng
- China Historical Films Timeline - Laurent C.
- What the SA job scene looks like for developers - Eshaam Rabaney
- Can we have a Pie chart like this? - Anwarhusen Malgave
- And like this? A Pie chart with dofferent angle - Anwarhusen Malgave
- Tracking Flu Outbreaks with Wikipedia - Laura Hamilton
- Surgery Prices by State - Laura Hamilton
- [Eurovision song contest voting oddities] (http://xliberation.com/e/d3euro.html) - Bruce McPherson
- [DogeOS/SmartOS SMF browser] (http://www.dogeos.net/smfgraph/) - LI, Yu
- [Members of the Lower House of the Parliament of India] (http://www.datafootprints.com/loksabha/) - Raj Verma
- [Archive of polling data for Austria] (http://www.strategieanalysen.at/umfragen/) - Flooh Perlot
- The Facebook Offering: How It Compares - Jeremy Ashkenas et al.
- [Four Ways to Slice Obama’s 2013 Budget Proposal] (http://www.nytimes.com/interactive/2012/02/13/us/politics/2013-budget-proposal-graphic.html) - Shan Carter
- At the Democratic Convention, the Words Being Used
- How the Chicago Public School District Compares
- Drought and Deluge in the Lower 48
- All the Medalists: Men’s 100-Meter Freestyle
- The electoral map: building path to victory
- Who Voted for Rick Santorum and Mitt Romney
- Over the Decades, How States Have Shifted
- 512 Paths to the White House and design process
- At the National Conventions, the Words They Used
- Drought Extends, Crops Wither
- How Obama Won Re-election
http://www.jeromecukier.net/projects/models/models.html
- La Nuit Blanche
- Percolation model
- Markov processes
- Cellular automata
- Game of life
- The Polya process
- Schelling's segregation model
- Antipodes
- Quadratic Koch Island Simplification
- Random Points on a Sphere
- Topology-Preserving Geometry Simplification
- Detecting Duplicates in O(1) Space and O(n) Time
- Factorisation Diagrams
- Bubbles
- Set Partitions
- El Patrón de los Números Primos
- Infinite Plasma Fractal
- Random Arboretum
- Crayola Colour Chronology
- Parallel Sets
- Rhodonea Curve
- Tag Cloud
- Combinatorial Necklaces and Bracelets
- Biham-Middleton-Levine Traffic Model
- 9-Patch Quilt Generator
- The Music of Graphs
- Planarity
- Mobile Patent Lawsuits
- Sunflower Phyllotaxis
- Girko's Circular Law
- Calkin–Wilf Tree
- Bloom Filters
- Carotid-Kundalini Fractal Explorer
- Coffee Flavour Wheel
- Number of unique rectangle-free 4-colourings for an nxm grid
- Animated Quasicrystals
- Collatz Graph: All Numbers Lead to One
- Hamming Quilt
- Hilbert Stocks
- Hilbert Curve
- Gaussian Primes
- Wave
- Latest Earthquakes
- Phylogenetic Tree of Life
- Voronoi Boids: Voroboids
- Animated Bézier Curves
- Animated Trigonometry
- Apollonian Gasket
- Monte Carlo simulation of bifurcations in the logistic map
- Sorting Visualisations
- Complete Graphs
- Leibniz Spiral
- Morley's trisector theorem
- Poincaré Disc
- Proof of Pythagoras’ Theorem
- From Random Polygon to Ellipse
- Tübingen
- American Forces in Afghanistan and Iraq
- How to Make an Interactive Network Visualization
- Word Frequency Bubble Clouds
- Animated Bubble Chart of Gates Educational Donations
- Stowers Group Collaboration Network
- GSA-Leased Opportunity Dashboard
- Feltronifier
- We're In The Money: How Much Do The Movies We Love Make?
- Visualizing The Racial Divide
- Composition of Church Membership by State: 1890
- Proportion of Foreign Born in Large Cities: 1900
- http://vallandingham.me/vis/jobs_by_state.html
- License Usage Dashboard
http://www.healthmetricsandevaluation.org/tools/data-visualizations
- [US Health Map] (http://www.healthmetricsandevaluation.org/tools/data-visualization/us-health-map)
- GBD Compare
- Mortality Visualization
- COD Visualization
- GBD Heatmap
- GBD Arrow Diagram
- GBD Uncertainty Visualization
- GBD Cause Patterns
- GBD 2010 healthy years lost vs life expectancy
- Life expectancy by county and sex (US) with country comparison
- Development assistance for health by health focus area
- Development assistance for health by channel of assistance
- Hierarchical Bar Chart
- Grouped Bar Chart
- Stacked Bar Chart
- Reorderable Stacked Bar Chart
- Dynamic Bar Charts
- Sortable bars: Foreign aid, corruption and internet use - Nikhil Sonnad
- Grouped and Stacked Bar Chart
- Waterfall Chart
- Dual-scale Bar Chart
- Reusable Interdependent Interactive Histograms (demo)
- Histogram Chart
- Fixed-width Histogram, Irwin–Hall distribution
- Fixed-width Histogram of Durations, log-normal distribution
- Variable-width Histogram
- Axis Component
- Small Multiples
- Sparklines
- Interactive Line Graph
- [Comprehensive Line Graph] (http://mpf.vis.ywng.cloudbees.net/)
- Dual scale line chart
- Horizon Chart
- Line Chart with tooltips
- Stacked layout with time axis
- Multiple Area Charts with D3.JS
- Multiple time-series with object constancy - Nikhil Sonnad
- [Overlapped distribution Area chart] (http://bl.ocks.org/nswamy14/083a1e3181c81428f817) - Narayana Swamy
- Reusable Pie Charts (demo)
- Pie Multiples / Pie Multiples with Nesting
- Pie Chart Updating (Part 1) (Part 2)
- [Hierarchical Pie Chart] (http://bl.ocks.org/4710330/94a7c0aeb6f09d681dbfdd0e5150578e4935c6ae) - Andreas Dewes
- Scatterplot for K-Means clustering visualization
- Animated bubble charts for school data analysis
- Scatterplot and Heatmap
- Scatterplot: Social trust vs ease of doing business - Nikhil Sonnad
- Explore Matrix Data with Scatterplots
- k-Nearest-Neighbor Search with Quadtree
- Animated Sankey Diagram (alluvial)
- Sankey diagram with cycles
- Parallel Coordinates
- Parallel coordinates with fisheye distortion
- Parallel Sets
- Parallel Sets with reorderable heading
- Pair Contribution and Selection - Jesse Heitler
- Graphicbaseball: 2012 Batters and 2012 Pitchers - Will Turman
- Sunburst Layout with Labels
- Sunburst: Coffee Flavour Wheel
- Partition Layout (Zoomable Icicle)
- Sunburst: Color schemer with parse.com integration
- Using a sunburst to analyze sequences of events
- Symbols
- Custom Forces
- Multiple Foci
- Multi Foci with Convex Hulls
- Nodes snapping to four colored clusters
- Images and Labels
- Drag and Drop Support to set nodes to fixed position when dropped
- Interactive Construction
- Collapsible Hierarchy
- From XML
- From Matrix Market format
- Directed Edges (Curves and Arrow Markers)
- Bounded Force Layout
- Force-Based Label Placement
- Groups and Labels showing relations of football players participating in Euro 2012
- Chicago Lobbyists
- Hacker News Visualisation
- Web performance
- 2011 International Phone Traffic
- Gravity by Disqus
- Navigate site by tags focus
- Interactive process map and documentation
- Building a tree diagram
- Reveal animation on a tree with a clip path
- Collpase/expand nodes of a tree
- Pedigree Tree
- Animated
- Collapsible
- Collapsible, with Labels
- Indented Tree (Collapsible)
- Vertical, Collapsible Wikipedia Tree
- Connections in time
- Voronoi Diagram with Force Directed Nodes and Delaunay Links
- Building Cubic Hamiltonian Graphs from LCF Notation
- Circular tree. Will your team win the NCAA Tournament?
- Bracket Layout
- SCION simulation environment
- Treemap Layout in SVG
- Circular tree of d3 src using burrow() for recursive nesting
- Circular tree comparing the src directory for three versions of d3
- Interactive visualization that shows changes in the internal node tree of a quadtree as points are added
- Football passes
- Selecties EK 2012
- [Remittance flows] (http://www.torre.nl/remittances/)
- Dependencies Between Classes
- Uber Rides by Neighborhood
- Updating data
- Updating data
- Fade on Hover
- Fade on Hover
- Fade on Hover
- [Static] (http://bl.ocks.org/1046712)
- [Static] (http://bl.ocks.org/1308257)
- Chord Layout Transitions
- [Co-Authors Chords] (http://www.rjbaxley.com/p/publications.html)
- [Visualizing Overlapping Sets] (http://radialsets.org) - [Bernd Landauer] (http://syrenio.com/)
- Visualizing Package Dependencies
- Switching behavior between phone brands of the Dutch and Code
- BeerViz - Visualizing Beers and their relations
- Click-to-Zoom with Albers Projection
- Google Maps
- Polymaps
- Polymaps with custom tiler
- Map from GeoJSON data with zoom/pan
- Maps and sound
- Choropleth classification systems
- Choropleth with interactive parameters for NYC data visualization, code
- Mercator and Albers to Orthographic Projection
- Non-Contiguous Cartogram
- Reusable non-contiguous cartogram with force layout
- Flows of refugees between the world countries in 2008
- [Interactive azimuthal projection simulating a 3D earth with stars] (http://marcneuwirth.com/blog/2012/06/24/creating-the-earth-with-d3-js/)
- Calculating quadtree bounding boxes, veronoi polygons, delaunay polygons and displaying them in leaflet
- Projection Transitions and Comparing Map Projections
- Composite Map Projection
- World Boundaries TopoJSON
- Mapbox: add vector features to your map with D3
- DataMaps: Interactive maps for data visualizations. - Mark DiMarco
- We ♥ France: transition between the Hexagon and a heart
- Cartogram.js: Continuous Area Cartograms - Shawn Allen
- Earthquakes in Chile since 1900 (Github) - Pablo Navarro
- Choropleth of White House Petition Signers - Adam Pearce
- Interactive choropleth of life excpectancy – Karel Minarik
- India population - Liji Jinaraj
- Hexbins in Leaflet
- [Interactive svg map using D3 circles and transitions] (http://www.incont.ro/infografice/judet-bogat-judet-sarac-unde-se-castiga-cei-mai-multi-bani-in-romania-si-in-ce-domeniu.html) - Vlad Moldoveanu
- ZipDecode - Nelson Minar (after Ben Fry)
- Interactive choropleth: San Francisco voter turnout and the 1989 earthquake - Garrett Glasgow
- Visualizing transit data
- Asia's Deadliest Conflicts (interactive map with timeline)
- All 2012 US flights from Google Fusion
- San Francisco Contours - Liji Jinaraj
- Global Oil Production & Consumption since 1965 - Timo Grossenbacher
- Nielsen Media Markets - Simon Zou
- d3.micromaps — An implementation of Linked Micromaps Plots (D. Carr et al.) by Manuel Aristarán
- Visualization of the Persecution of the Baha'i community in Iran using d3.js, leaflet and Crossfilter - Jérôme Gagnon-Voyer
- Venn Diagram using Clipping
- Venn Diagram using Opacity
- Marimekko Chart
- Gauge
- Chernoff faces and Chernoff faces example: happy planet index
- Swimlane Chart
- Pictograms
- Smoke charts and source code
- Sankey Diagram with Overlap
- Hierarchical Edge Bundling
- Spiral for John Hunter
- Hexagonal Heatmaps for e.g. Self Organizing Maps and code
- Superformula Explorer
- Superformula Tweening
- LTE Protocol visualization
- OMG Particles!
- Line Tension
- Segmented Lines and Slope Coloring
- Raindrops
- Weeknd3
- Explosions
- Linear Gradients
- Force Directed States of America
- Rounded Rectangles
- Spermatozoa
- Spline, Zoom and Pan
- Arc Tweens
- Show Reel
- VVVV viewer
- Merge Sort
- Epicyclic Gearing
- DOM-to-Canvas
- Transform Transitions
- Square Circle Spiral Illusion
- Adventures in D3
- Time Series
- Voronoi-based point picker
- Radar chart
- Drag rectangle
- Elastic collisions(http://bl.ocks.org/1706849)
- Collider - a d3.js game
- alpha-shapes aka concave hulls
- Conway's Game of life as a scrolling background
- Simple Dashboard Example
- Dataflow programming with D3 and Blockly
- XKCD-style plots
- Violin: Instrumenting JavaScript
- Rotating hypercube in orthogonal projection and parallel coordinates
- Webplatform dancing logo
- Metro Maps of the News
- Life expectancy: small multiples
- Semi-manual force layout of cablegate reference graphs
- Digital Clock By Virtual Force
- Radar Chart or Spider Chart
- [Battle Statistics from the MMO game World of Tanks] (http://www.polsci.ucsb.edu/faculty/glasgow/research/d3/WoTkillratio.html) - Garrett Glasgow
Charts using the reusable API
- Parallel Coordinates and repository
- Chernoff faces, Fisheye, Geodesic grid, Hive plot, Horizon chart, Sankey diagram,
- Parallel Sets
- Word Cloud
- Progressive Word Cloud visualising Bloomberg financial news
- MathJax label
- Simple table
- Legend
- Simple Reusable Bar Chart
- Polygonal Lasso Selection
- Floor Plan Map
- Streamgraph an Interactive version
- Histogram
- Circular heat chart
- Word Tree
- Simple XY Line Chart
- Correct zoom for layout
- Date Ticks
- Masking with external svg elements
- PJAX
- Table Sorting
- Automatically sizing text
- Templating ala Mustache, with Chernoff faces example
- Bay Area earthquake responses by zip code: loading external file through Yahoo Pipes
- Simple HTML data tables
- Responsive SVG resizing without re-rendering
- Automatic floating labels using d3 force-layout
- [Long Scroll] (http://bl.ocks.org/3689677)
- Custom Line Interpolation
- Export to SVG/PNG/PDF server-side using Perl
- Constraint relaxation 1and 2
- Custom Path and Area Generator
- Axis Examples
- Loading Adobe Photoshop ASE color palette
- Render sever-side using Phantomjs
- Reusable text rotation
- Bieber Fever Meter with HTML5′s Web Socket, d3.js and Pusher - Ollie Glass
- Reverse Geocoding Plug-in using an offline canvas
- Custom Multi Scale Time Format Axis - Mike Bostock
- IPython-Notebook with d3.js
- Plotting library for python based on d3
- mpld3: d3 visualizations of matplotlib (python) plots
- Visualizing NetworkX graphs in the browser using D3
- Pushing d3 commands to the browser from iPython
- Dance.js: D3 with Backbone and Data.js
- Backbone-D3
- Viewing OpenLearn Mindmaps Using d3.js
- Splay Tree animation with dart, d3, and local storage
- Sankey diagrams from Excel - Bruce McPherson
- [Plotsk: A python/coffeescript/d3.js-based library for plotting data in a web browser] (https://github.com/davidcox/plotsk)
- Data visualization with D3.js and python
- d3.js force diagrams straight from Excel - Bruce McPherson
- Instant interactive visualization with d3 + ggplot2
- d3.js force diagrams with markers straight from Excel - Bruce McPherson
- Visualising a real-time DataSift feed with Node and D3.js
- Very limited, in-progress attempt to hook d3.js up to three.js
- SVG to Canvas to PNG using Canvg
- Canvas with d3 and Underscore
- Automatically sizing text
- SVG to Canvas
- d3 rendered with RaphaelJS for IE Compatibility
- d34raphael
- [D3 graphics in a Pergola SVG UI] (http://www.dotuscomus.com/pergola/pergola_1.4.0/ExamplesHTML/D3/multiD3.html)
- Visualising ConAir Data With Cubism.js (Arduino, TempoDB, Sinatra)
- Render Geographic Information in 3D With Three.js and D3.js
- D3 heatmap using Backbone.js and CoffeeScript - Nacho Caballero
- Visualizing a network with Cypher and d3.js
- ggplot2 + d3 = r2d3
- Using the D3.js Visualization Library with AngularJS - Brian Ford
- Zoomable Partition Charts directly from Excel - Bruce McPherson
- SHEETSEE.JS: Fill up Websites with Stuff from Google Spreasheet -Jessica Lord
- Web reporting with D3js and R using RStudio Shiny - klr @timelyportfolio
- Dex the Data Explorer - Patrick Martin
- d3.js partition chart serving data from parse.com - Bruce McPherson
- Force directed node focus generated from Excel - Bruce McPherson
- US Airline performance bigdata direct from Google Fusion - Bruce McPherson
- Force directed site concept browser - Bruce McPherson
- Bar chart code generator and online editor
- D3 bar chart online editor-Chinese
- Live coding based on Bret Victor's Inventing on Principle talk
- Tributary
- D3.js playground
- A CoffeeScript console for d3.js visualization
- CSSdeck: Repulsion example
- Bitdeli: Custom analytics with Python and GitHub
- Chart.io: The Easiest Business Dashboard You'll Ever Use
- Cube: Time Series Data Collection & Analysis
- Datacopia.com: Automated data visualization, Charts, and Analysis
- DropTask: Visual task management application using D3 for visuals
- Explore Analytics: cloud-based data analytics and visualization
- Fast Multidimensional Filtering for Coordinated Views
- InfoCaptor Dashboards with D3 and canvas
- Meshu turns your places into beautiful objects.
- Mohiomap: A Visual Memory for Evernote
- MortgageBloom Calculator
- Nodal is a fun way to view your GitHub network graph - Jesse Vogt, Matt Stockton, and Kris Gösser
- Plot.io (swallowed by Platfora)
- Polychart: A browser-based platform for exploring data and creating charts
- Reports for Simple
- Trisul Network Analytic
- Ubiq Analytics: MySQL Analytics & Reporting made easy
- Dc.js
- NVD3
- Dimple
- Cubism.js: Time Series Visualization
- Crossfilter
- Rickshaw: JavaScript toolkit for creating interactive real-time graphs
- Dynamic Visualization LEGO
- xCharts: a D3-based library for building custom charts and graphs
- VisualSedimentation.js: visualizing streaming data, inspired by the process of physical sedimentation
- Insights: Interactive Force Graph Component
- Lepracursor, a d3.js based library which adds a virtual pointer to the page that grows in number with every click
- iopctrl.js: User interface controls and gauges
- arc diagram
- gantt, other timelines and timing diagram
- candlestick or ohlc
- fibonacci scale
- data table (maybe the airline table at the bottom of the crossfilter example?)
- hypergraph