Devs ~ Memory profiling - GeoscienceAustralia/egeodesy GitHub Wiki
Geodesy memory profiling - 30/5/17
See screenshot showing the result of a Chrome heap allocation timeline. See https://developers.google.com/web/tools/chrome-devtools/memory-problems/allocation-profiler
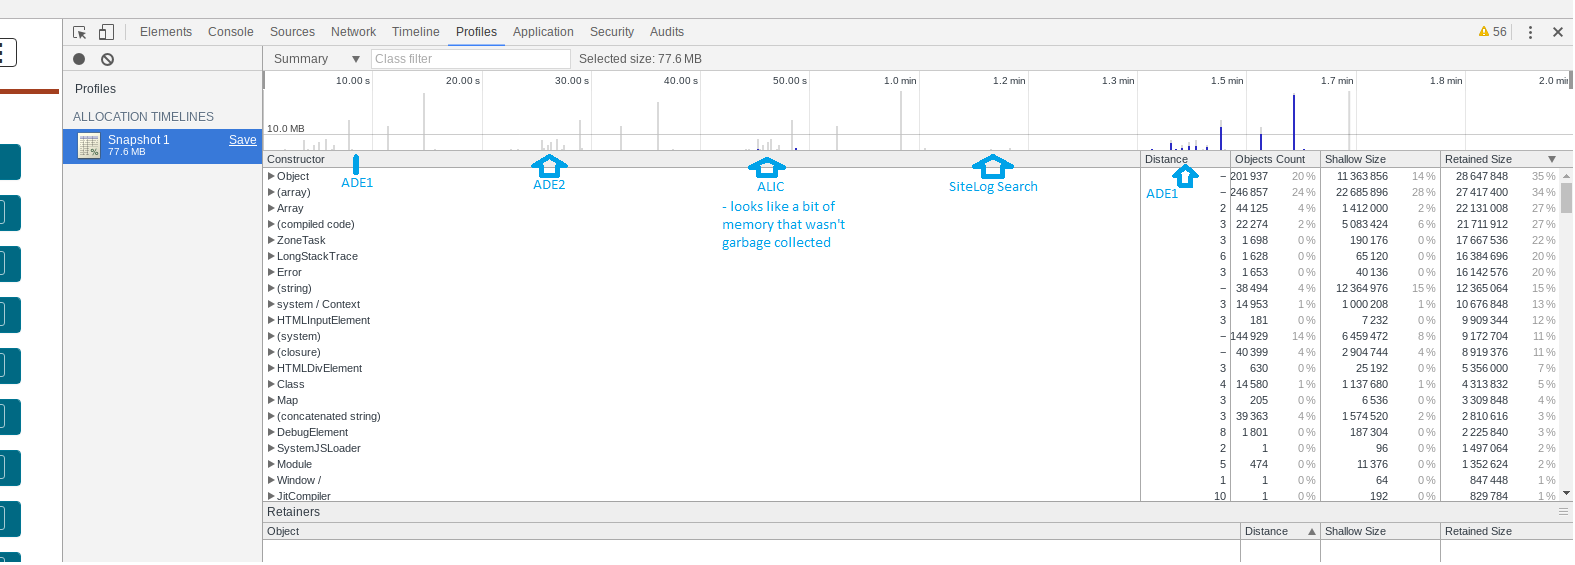
This was run first by starting on the search screen, then pressing 'start' to record. Next I visited ADE1, ADE2, ALIC and then the SiteLog search page. I then finished the test by pressing 'stop'.
The graph shows gray bars and blue bars. The gray bars indicate objects that were allocated during the timeline, but have since been garbage collected and the blue bars indicate objects that are still live at the end of the timeline.
This diagram shows that our memory profile appears to be pretty-much 100% ok. The only concern is that there is a bit of memory that hasn't been GC'd in the ALIC before going back to the SiteLog search.
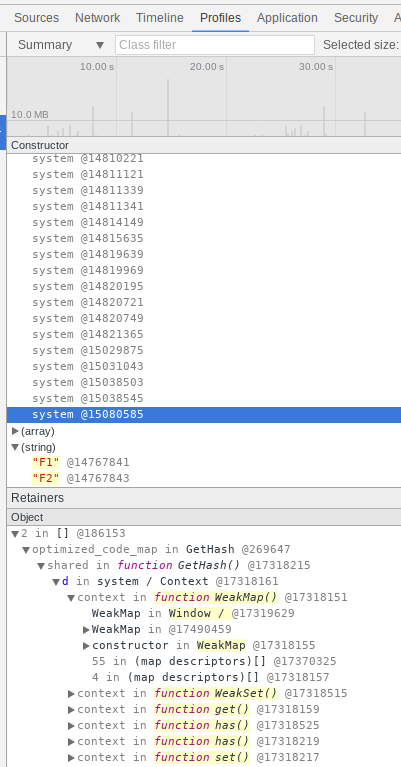
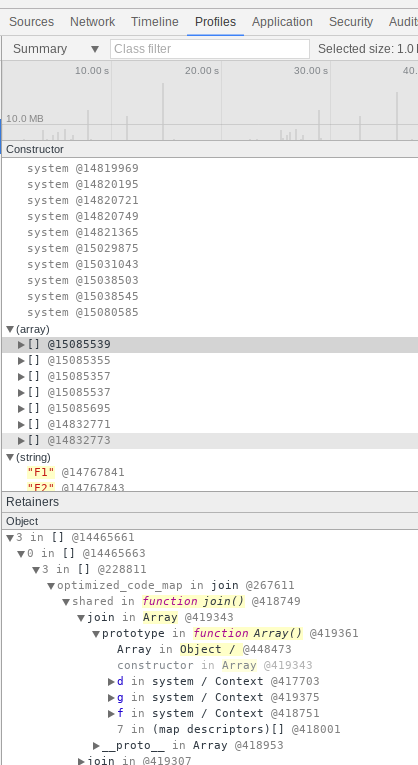
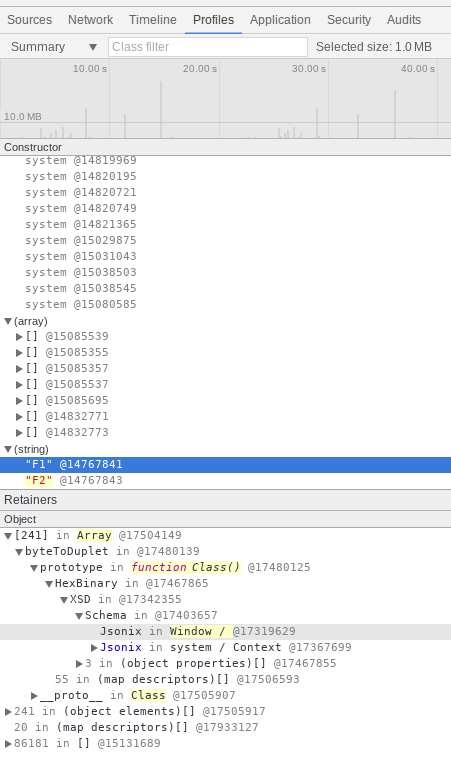
I've drilled down on this (see HeapAllocationTimeline Drill down.png 1 to 3) and from what i can tell it is memory occupied by third party (eg. JSONIX) or Javascript core code.
From the doco:
Nodes highlighted yellow have direct references to them from the JavaScript code. Nodes highlighted red do not have direct references. They are only alive because they are part of the yellow node's tree. In general, you want to focus on the yellow nodes. Fix your code so that the yellow node isn't alive for longer than it needs to be, and you also get rid of the red nodes that are part of the yellow node's tree.
I extended the investigation by looking at the Memory timeline (https://developers.google.com/web/tools/chrome-devtools/memory-problems/#visualize_memory_leaks_with_timeline_recordings)
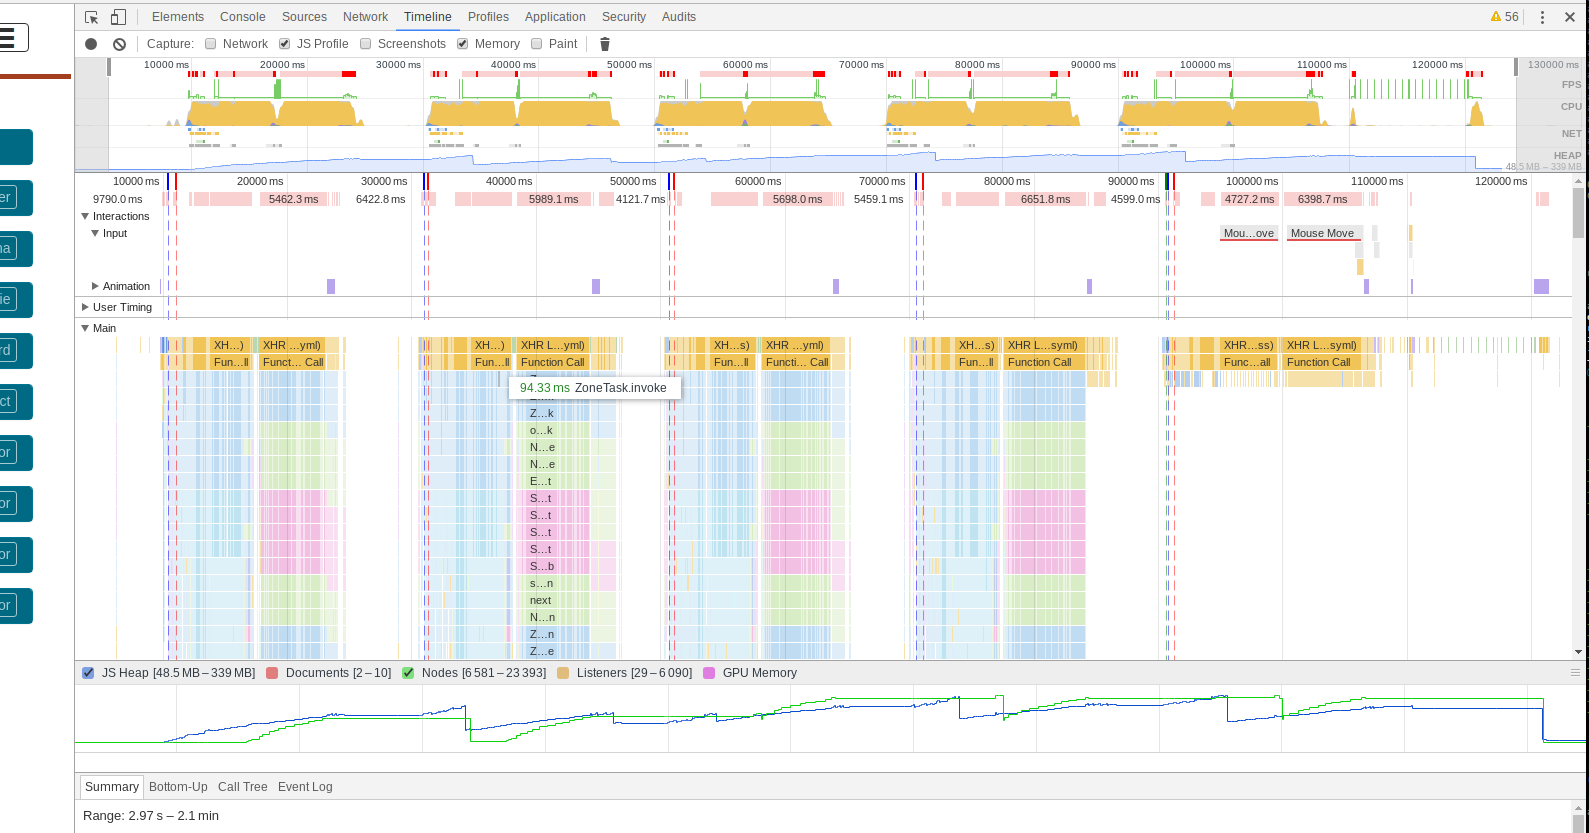
These graphs show 5 successive searches at (seconds) 10, 30, 50, 70 and 90 with a SiteSearch at 110 and a manual garbage collection at 120.
Look at the HEAP graph (top-right) or bottom. It shows the heap allocation rise and fall and the final garbage collection brings the state back to something very similar to how the interaction started.