volesti vs hitandrun - GeomScale/volesti GitHub Wiki
In this topic we compare volesti with CRAN package hitandrun. We sample uniformly distributed points from convex polytopes and compare run-times. hitandrun supports only Random Directions Hit and Run (RDHR) and thus we use the same random walk from volesti. The following R script generates a random polytope for each dimension and samples 10000 points (walk length = 10) with both packages.
library(volesti)
library(hitandrun)
library(ggplot2)

N=1000
times_volesti = c()
times_hnr = c()
for (d in seq(from=10,to=100,by=10)) {

  P = gen_cube(d, 'H')
  tim = system.time({ sample_points(P, n=N, random_walk = list("walk" = "RDHR", "walk_length"=5)) })
  times_volesti = c(times_volesti, as.numeric(tim)[3])

  constr <- list(constr = P$A, dir=rep('<=', 2*d), rhs=P$b)
  tim = system.time({ hitandrun(constr, n.samples=N, thin=5) })
  times_hnr = c(times_hnr, as.numeric(tim)[3])
}
The following Table reports the run-times.
| dimension | volesti time | hitandrun time |
|---|---|---|
| 10 | 0.017 | 0.102 |
| 20 | 0.024 | 0.157 |
| 30 | 0.031 | 0.593 |
| 40 | 0.043 | 1.471 |
| 50 | 0.055 | 3.311 |
| 60 | 0.069 | 6.460 |
| 70 | 0.089 | 11.481 |
| 80 | 0.108 | 19.056 |
| 90 | 0.132 | 33.651 |
| 100 | 0.156 | 50.482 |
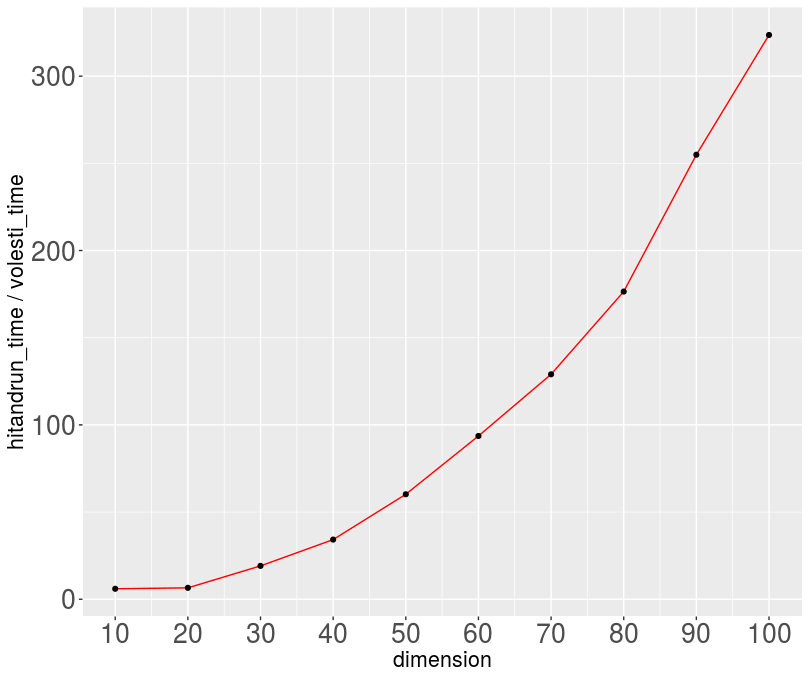
The following figure illustrates the asymptotic in the dimension difference in run-time between volesti and hitandrun.