Pattern Exploration - Genometric/GeMSE GitHub Wiki
See the following video for the pattern exploration in action.
You can search for patterns on each of the genometric spaces of state-transition tree. To do this:
- Select a node on
state-transition tree - Goto
Tools > Search Pattern
The pattern search window is explained in the following.
Interface

The pattern interface consists of three sections:
1. Controllers to initiate a pattern search process
Use Domain to choose for searching for patterns of Rows (regions) or Columns (samples). Then choose distance metric using Metric dropdown. The options for distance metric are:
- Euclidean Distance
- Manhattan Distance
- Earth Movers Distance
- Chebyshev Distance
- Canberra Distance
- Pearson Correlation Coefficient.

Check `Plot Elbow method data`, if you want to see the variance of percentage between various number of clusters used for suggesting a number of clusters. The elbow output panel is similar to the following.

2. Controllers for setting the number of patterns
GeMSE provides three features for setting the number of patterns:
Number of clustersHeight from Root(see this description)Distance between children(see this description)
GeMSE sets the minimum and maximum value of the three sliders to the possible values based on the clustering result. GeMSE automatically updates the sliders and all pattern extraction menus, once a slider value is changed.
3. Patterns, and their extension and description
This section explains extracted patterns in three tabs described as it follows.
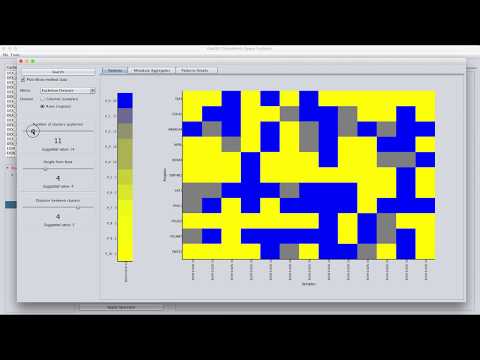
3.1. Patterns
This panel visualizes the determined patterns on heatmap. The panel uses two heatmaps:
-
A heatmap on the center of the panel which shows the determined patterns. Each pattern consists of at least one region/sample. The central panel visualizes each pattern using the first region/sample in the pattern. Also, it labels the row/column using the label of the visualized region/sample. User can see all the regions/samples composing the pattern using
Pattern Detailstab (see pattern details section). -
A heatmap to the left (if searching for patterns of regions), or to the top (if searching for patterns of samples) of heatmap in the center.
- If searching for patterns of regions: this heatmap has
1column andnrows, wherenis the number of patterns. - If searching for the patterns of columns: this heatmap has
1row, andncolumns, wherenis the number of patterns.
This heatmap shows the count of each pattern; where the
nth cell, refers to thenth pattern. These cells are labeled asP_X: Y, whereXis the number of the pattern, andYis the count of the regions/samples having that pattern (which is also visualized on by the heatmap cell). - If searching for patterns of regions: this heatmap has
3.2. Metadata Aggregates
Explains the determined patterns using samples metadata. Accordingly, it has two behaviors depending on the domain for pattern finding.

- Patterns of columns: Based on the number of clusters, GeMSE determines a table such as the following
| Attribute | Value | P_0 | P_1 | P_2 | P_3 | P_4 | P_5 | P_6 |
|---|---|---|---|---|---|---|---|---|
| Antibody or target protein | GR (sc-1003) | 3 | 0 | 0 | 0 | 0 | 0 | 0 |
| Antibody or target protein | USF1 (sc-229) | 2 | 0 | 0 | 0 | 0 | 0 | 0 |
| Library Protocol | ChIP AMpure XP | 9 | 0 | 0 | 0 | 1 | 1 | 1 |
| Library Protocol | HiSeq 2500 | 0 | 10 | 0 | 0 | 0 | 0 | 0 |
| Library Protocol | NA | 0 | 0 | 0 | 1 | 0 | 0 | 0 |
| Treatment | DEX_100nM 0h | 0 | 1 | 0 | 0 | 0 | 0 | 0 |
| Treatment | DEX_100nM 4h | 0 | 1 | 0 | 0 | 0 | 0 | 0 |
| Treatment | DEX_100nM 8h | 0 | 1 | 0 | 0 | 0 | 0 | 0 |
| Treatment | EtOH 0.02% 1h | 10 | 0 | 1 | 0 | 1 | 1 | 0 |
This table counts attribute-value pairs read from samples metadata for each of the patterns. For instance, 3 of the samples in P_0 are experiments targeting GR (sc-1003) protein, and 2 of the samples in this pattern are targeting the protein USF1 (sc-229). Or, the library protocol of only the samples in P_1 is HiSeq 2500.
- Patterns of rows:
GeMSE displays a list of patterns and their count. User chooses one of the patterns, and GeMSE displays a table of its metadata with values being the count of the displayed attribute-value pair in each of the samples (columns). A portion of the table is as the following.
| Attribute | Value | Dex 5nM 1h | Dex 50nM 1h | Dex 100nM 0h | Dex 100nM 1h |
|---|---|---|---|---|---|
| Antibody or target protein | GR (sc-1003) | 51 | 51 | 0 | 0 |
| Antibody or target protein | JUNB | 0 | 0 | 51 | 51 |
| Library Protocol | PCR 1-round | 51 | 51 | 0 | 0 |
| Library Protocol | HiSeq 2500 | 0 | 0 | 51 | 51 |
3.3 Pattern Details

This panel provides features for exploring each of the patterns. User can choose to see:
- descriptive metadata (e.g., gene name) of each of the patterns. GeMSE displays a table such the following the
genes involved in the selected pattern.
| index | gene_name |
|---|---|
| 0 | ESPL1 |
| 1 | HOXC4 |
| 2 | NCOA1 |
- The regions/samples composing the pattern on a heatmap (as in the above figure) or a table.