Interface - Genometric/GeMSE GitHub Wiki
The following video explains the interface.
Layout
 |
|---|
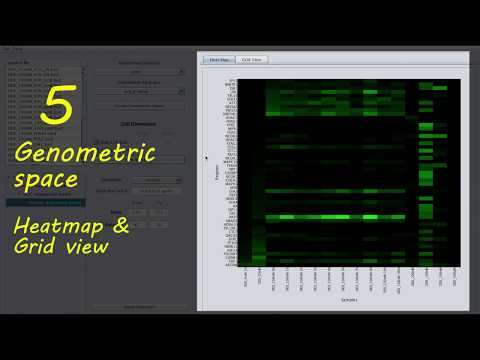
| Figure 1. |
Panel 1
A table of the imported files name.
Panel 2
Features to generate genometric space, and plotting options. The UI elements are explained as follows.
Determined Features: imported data can define different features (e.g., gene, or CDS); this combobox allows user to generate a genometric space for one of the features, or all. Multiple features are available when (a) imported samples are inGTFformat, or (b) data are mapped (converted from heterogeneous to homogeneous) using a reference sample inGTFformat.Determined Attributes: this combobox lists all the numerical attributes read from the source files. The values of this attribute from the imported data set the values in genometric space cells.Create Genometric Space: initializes a genometric space using the selected feature and attribute. This operation deletes the history.Auto Cell Size: if checked, lets GeMSE to automatically adjust cell sizes of the heatmap to fit it in the panel. The minimum size is1. If there are more cells that can not fit in the panel with cell dimension≤1, then GeMSE sets the panel scrollable. If unchecked, user defines cell dimensions.Auto Update Plot: if checked, GeMSE automatically updates the heatmap and grid view of the genometric space at each new transition or traverse on the history tree structure.Plot Heatmap: manually updates heatmap and grid view.
Panel 3
Visualizes the state transition based history in a tree structure. Each node in the tree is a genometric space, and the transition which created it from its parent. The nodes (genometric spaces) are immutable, i.e., once created can not be deleted or changed.
The label of each node consists of two parts:
Transition Label
Where Transition is the applied operation, and it is set by GeMSE. Label is a user-defined label for each operation. For instance:
Extract expressed genes
where Extract is the transition, and expressed genes is a user-defined label.
Clicking on any node, its genometric space is plotted (if Auto Update Plot is checked), and its transition is shown. Modifying the transition or defining a different transition, then clicking on Apply Operation, creates a new node with the current node being it's parent.
Panel 4
Sets and gets parameters for a transition. Choosing a transition from Operations dropdown, all the adjustable parameters for the selected transition are displayed in this panel. User sets the parameters, and Operation Label, and clicks Apply Operation for the operation to be applied on the selected node.
Panel 5
The panel has three tabs:
Heatmap: visualizes the genometric space of a selected node on a heatmap.Grid View: is a tabular view of the genometric space of a selected node.Dendrogram: shows the dendrogram of a clustering operation. This tab is visible when the transition of a selected node isClustering.