Home - Fleet-Analytics-Dashboard/Application GitHub Wiki
1. Overview of Wiki
- Home
- Goals
- Solution Approach
- User Research
- Design Concept
- Data Foundation
- Technology stack
- Data Science
- Dashboard Explanation
- Lessons Learned
- Potential Improvements
2. Milestones
These are the five milestones by which this project will be carried out:
- research: course requirements, user needs, ideate
- concept: user journey, user needs, plan
- design: data visualization methods, navigation, styles, layout, typography, colors, fonts
- build: software architecture, server, database, dashboard
- completion: rollout, tests, presentation
3. Distribution of roles
- Tim: Data Science
- Jakob: Downtimes Dash view
- Lucie: Vehicles Table Dash view
- Larisa: Home Dash view
- Johannes: Deployment, Project Management
4.Project management - SCRUM
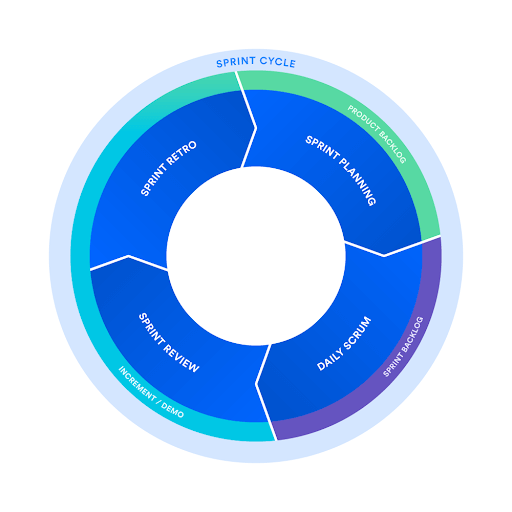
For this project, the scrum framework is used. Therefore, the team workes self-organized, reflect together on wins and losses, and to continuously improve. The following GitHub Projects Kanban board is used for organizing the ticket: https://github.com/Fleet-Analytics-Dashboard/Application/projects/
- backlog: list of tasks that drives the product towards its vision (revisited, re-prioritized and maintained by the project manager)
- sprint cycle: one week period (enables to work more flexible and outweigh the lack of a daily scrum meeting)
- sprint: when the team works together to finish an increment (group members choose the tasks from the sprint list independently)
- sprint review, retrospective, and review: the team reviews the tickets done in the last sprint and planes together the work to be performed (scope) during the next sprint (every Thursday at 2:15 pm)

Reference: scrum explanation by Atlassian