Lab #5 - FAR-Lab/Developing-and-Designing-Interactive-Devices GitHub Wiki
Data logging with Rpi and Arduino
For this lab, we will be experimenting with a variety of sensors, play it back on your LCD display or serial monitor, logging data back to the Raspberry Pi, and making it possible to remotely view the data in real-time.
Part A. Writing to the Serial Monitor
Hook up the simple potentiometer voltage divider circuit from lab 4.
The LCD display from the last lab is a great and helpful tool for debug purposes; the serial monitor is another. Use the code from File->Examples->Communication->Graph as a template to print data from your potentiometer to the serial monitor. Don't disconnect the USB cable after uploading the code; instead, use the serial monitor button on the Arduino IDE (in the upper right corner, magnifying glass icon) to see the data coming from the Arduino. If the Arduino is connected to the RaspberryPi you can either use xWindows to open the serial monitor or use ArduinoMake to Upload and monitor your Arduino.
a. Based on the readings from the serial monitor, what is the range of the analog values being read?
b. How many bits of resolution does the analog to digital converter (ADC) on the Arduino have(hint: where might you look to find this sort of thing)? How many are you using with the range of values you're seeing?
You can also read inputs from the serial monitor, or wait for the serial monitor to open before spewing data over the USB line! A nice tutorial on the basic serial transmit functions can be found at http://arduino.cc/en/Tutorial/AnalogReadSerial. You can see from the sample code included in the comments of the Graph program that you could use the serial communication functions to communicate data from your sensors to other programs, such as Processing, Flash, MaxMSP.
For this lab, you can use the serial monitor and/or the LCD whenever you are told to display something, depending on what you think is easier/prettier.
Part B. Voltage Varying Sensors
Some more sophisticated sensors have ICs that measure physical phenomena and then output an analog voltage level, varying voltage much as a voltage divider circuit would. We have one of these for each table.
1. IR Distance Sensor
Get an IR distance sensor and an IR distance sensor jumper cable. The circuit for the distance sensor is simple: just connect red to +5V, black to ground, and white to analog input 0.
IR Sensor Datasheet More Info on Sharp Distance Sensors
Use your Lowly Multimeter program to look at the data the sensor returns. What happens when the field of view is clear? Move your hand or a piece of paper over the sensor and see how the readings vary with distance.
a. Describe the voltage change over the sensing range of the sensor. A sketch of voltage vs. distance would work also. Does it match up with what you expect from the datasheet?
2. Accelerometer

The accelerometer is a 3-axis, accelerometer based on the ADXL335. The ADXL335 is a 3.3V part, but the Adafruit board has an onboard voltage regulator so that the part can be powered on 5V power on the Vin pin.
You will need to solder the 5 pin header to the accelerometer board.
This example code is meant to read values from a 3-axis accelerometer out to a computer over the serial monitor. Test it out!
Adapt the code to indicate what your readings are on the X, Y and Z axes of the accelerometer on your 16x2 LCD panel.
Get a feel for the data the accelerometer provides. Pick up the Arduino+accelerometer board and tilt it in various directions. Start by holding it so that the accelerometer board is parallel to the ground. Find in which direction the X reading increases and decreases; do the same for the Y reading.
a. Include your accelerometer read-out code in your write-up.
Part C. Count/Time-Based Sensors
One last type of sensor!
1. Rotary Encoder
 We have a high-quality 24 pulse encoder with knob and nice, click-y rotation detents.
Like a potentiometer, a rotary encoder has 3 pins; unlike a potentiometer, an encoder can be spun round and round without stop. Rotary encoders use quadrature to tell how fast and in which direction you are turning a knob. To connect the encoder to your breadboard, you can insert three pins directly into motherboard like picture below.
The circuit below is the "correct" way of hooking up a rotary encoder with your Arduino; the resistors and capacitors help to filter out noise from the mechanical operation of the encoder - this circuit diagram is from the datasheet.
https://ccrma.stanford.edu/wiki/images/c/c1/Encoder_filter.png
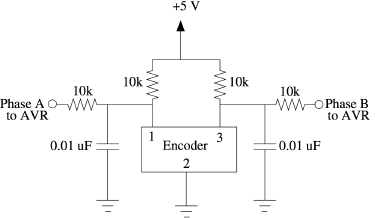
However, to actually hook up your encoder, just use the 3-pin side. Hook the middle to ground, and the "A" and "B" pins to digital pins 2 and 3 of your Arduino.
What is going on in this circuit? The Phase A and Phase B pins actually behave like switches, so the pins have pull-ups so that they will be high by default, until they are pulled low by the encoder (your Arduino actually uses its own internal pull-ups). The resistor and capacitor combo also forms a low-pass circuit to eliminate stray voltage spikes that might occur from the quick switching (this is called "debouncing"). You can use any capacitor that is up to an order of magnitude away from the 10nF value.
Use this rotary encoder code to see if you have hooked the encoder up correctly!
Part D. Logging values to the EEPROM and reading them back
1. Design your logger
You've been thinking at a high level about a data logger and what it is used for; now you need to adapt that to the specific implementation.
In addition to the sensors you've tried out, your kit has a photocell, which is a light-varying resistor. We also have limited number (15) of the following sensors:
- Flex sensor
- Time of Flight sensor
- Long arm snap switch
- Rocker switch
as well as two sets of this sensor variety kit: VKmaker T30 Sensor Module the separate sensor documentation is available for download.
A lot of the art of data logging is being clever about how to use the sensor. Feel free to engage the teaching team for advice.
Your data logger will have two main modes: one where it logs data and another where it plays the data back. Think a little about what sensors you would like to log data from and how you would like to display your data. Create a state diagram sketch that indicates how you'd like to switch between one mode and the other, and also what you'd like the program to do in each state. This can help you decide what buttons or knobs might be useful for your design.
You might make changes to your design before this lab is complete.
a. Turn in a copy of your final state diagram.
2. Reading and writing values to the Arduino EEPROM
The Atmega 328P at the heart of the Arduino has 1024 bytes of internal EEPROM Memory (which is separate from the 32KB of Program memory it has for the code it is running.)
a. How many byte-sized data samples can you store on the Atmega328? b. How would you get your analog data from the ADC to be byte-sized?
Use the code in the File->Examples->EEPROM as a template to write and read your own analog values to Arduino's EEPROM. (Ignore what they say about the EEPROM having only 512 bytes. You'll have to adjust your code to match the EEPROM size of the Arduino Micro. The Atmega328 datasheet tells you how much EEPROM it has too).
3. Reading and writing values to the Raspberry Pi
Alternatively, you can also store the data directly on the Raspberry Pi. This has certain advantages like disk space or the build in clock but also require the Pi to be constantly connected and on. The simple-data-logger stores the data on the Raspberry Pi from the Arduino.
There are three folders inside the project.
- In the folder
sensorCodeis a simple Arduino program that periodically sends sensor values over the serial port. - The
dataStoragefolder contains an node programdataStorage.js. It opens the serial port and writes any(!) incoming messages into thedataBase.csv. Don't forget to run 'npm install' to get all required packages. webServeris a simple node web serverserver.jsapplication, that streams thedataBase.csvfile and additions to that file line by line to any connected web browser.Don't forget to run 'npm install' to get all required packages.
-
Set up your Arduino so that it sends its data over the serial port. You can use the provided
sensorCode.inoor code from any of the earlier examples. -
Start the
dataStorage.jswithnohupso it can keep logging data in the background, even if you log off. Like so:
nohup node dataStorage.js &
Before we go on lets verify that data is actually stored. Lets go one folder up with cd .. and look at the tail of the file with the -F flag so that it keeps refreshing any changes.
tail -F dataBase.csv
Every time the Arduino sends a new measurement it should appear here. It probably looks something like
date,value
1500000003500,868
1500000005501,867
1500000007499,866
The left side of the comma is a time measurement in unix time with milliseconds, the right side the sensor value at that time.
-
Start the web server by going into the web server folder
cd webServerand runnode server.js. Now you can go to your browser and connect to the Raspberry Pi just like before with the Interaction Engineixe[00].local:8000. -
The graph you'll see is rendered using vega-light. For this assignment change the appearance so it fits your data.
The design of the graph is defined at the top of the client.js file inside the webServer/public/ folder. The available elements can be found by going through the example looking at the vega-light documentation and by playing with the vega-light online editor.
The design define definition is all part of vlSpec object:
var vlSpec ={
 "$schema": "https://vega.github.io/schema/vega-lite/v2.json",
 "data": { "name": "table","format": {
      "parse": {
        "date": "utc:'%Q'"
      }
    }
   },
 "width": 1000,
  "height":500,
  "mark": "line",
  "encoding": {
    "x": {
      "timeUnit":"utcyearmonthdatehoursminutessecondsmilliseconds",
      "field": "date",
      "type": "temporal"
    },
    "y": {
      "field": "value",
      "type": "quantitative"
    }
  }
};
4. Create your data logger!
Now it's up to you to integrate the software and hardware necessary to interface with your data logger! Your logger should be able to record a stream of analog data (at a sample rate of your desire) and then play it back at some later point in time. You are welcome to play back to either the 16x2 LCD or the Pi, as suits the application.
a. Use the lab camera or your own camera/cell phone to record and upload a short demo video of your logger in action.