Alt Lab 5 - FAR-Lab/Developing-and-Designing-Interactive-Devices GitHub Wiki
This lab is a merge of what is originally Lab 4 and Lab 5 of the curriculum. This is meant for students who have had this curriculum before. If you have little experience with electronics, breadboarding, Arduino programming or the Arduino hardware, please work on Lab 4 and Lab 5 separately!
The alt-pre-Lab helps you to get set up in advance of in-class lab.
For the upcoming lab, we will be building data loggers.
- PRE-SOLDERING: To avoid the backup around the soldering irons this time in lab, solder connectors onto your LIS3DH accelerometer.

-
STATE DIAGRAMS: To sketch out how your interactive devices should act in different modes, we will be using state diagrams. Please review this tutorial on Everything to Know about State Diagrams
-
(optional) I2C: In the upcoming lab, the accelerometer and proximity sensor share the same communication bus! Here is a quick example of how that works. http://www.mbeddedc.com/2017/05/i2c-bus-communication-protocol-tutorial.html
-
READING: This is intended to help you understand what it means to prototype and test interactions: Bill Moggridge, Designing Interactions, Chapter 10
-
IDEA GENERATION: The point of this week's lab is to figure out a cool interaction that you can make possible with the a micro controller which can record data generated by a sensor, and then play it back. You could make programmable piano. You could make that records how much you toss and turn at night. You could make something that measures the changing light levels in your room.
-
Read through the lab.
-
Collect cardboard, and the tools you'll need for the lab activity, in advance of the lab.
For this lab, we will be experimenting with a variety of sensors, sending the data to the Arduino serial monitor, writing data to the EEPROM of the Arduino, and then playing the data back.
What's in this lab?
A. Writing to the Serial Monitor
B. RGB LED
C. Resistance & Voltage Varying Sensors
D. I2C Sensors
E. Logging Values to the EEPROM and Reading Them Back
F. Create your own Data logger!
For the report, make a copy of this wiki page for your own repository, and then delete everything but the headers and the sections between the stars. Write the answers to the questions under the starred sentences. Include snippets of code that explain what you did.
Deliverables are due next Tuesday. Post a link to the wiki page on your main class hub page.
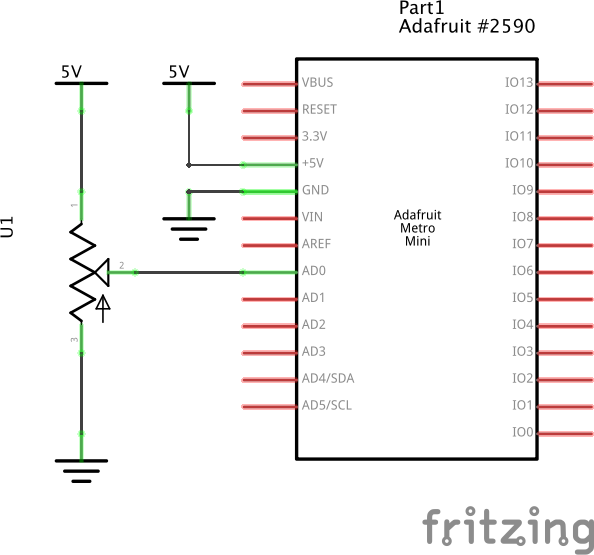
The OLED display from the Lab 02 is a great and helpful tool for debug purposes; the serial monitor is another. Use the code from File->Examples->Communication->Graph as a template to print data from your potentiometer to the serial monitor. Don't disconnect the USB cable after uploading the code; instead, use the serial monitor button on the Arduino IDE (in the upper right corner, magnifying glass icon) to see the data coming from the Arduino.
a. Based on the readings from the serial monitor, what is the range of the analog values being read?
b. How many bits of resolution does the analog to digital converter (ADC) on the Arduino have (hint: where might you look to find this sort of thing)? How many are you using with the range of values you're seeing?
You can also read inputs from the serial monitor, or wait for the serial monitor to open before spewing data over the USB line! A nice tutorial on the basic serial transmit functions can be found at http://arduino.cc/en/Tutorial/AnalogReadSerial.
NEW!!! Also you can plot the data with the Arduino Serial Plotter! This can be found under Tools->Serial Plotter. Try it out.
For this lab, you can use the serial monitor, plotter and/or the LCD whenever you are told to display something, depending on what you think is easier/prettier.
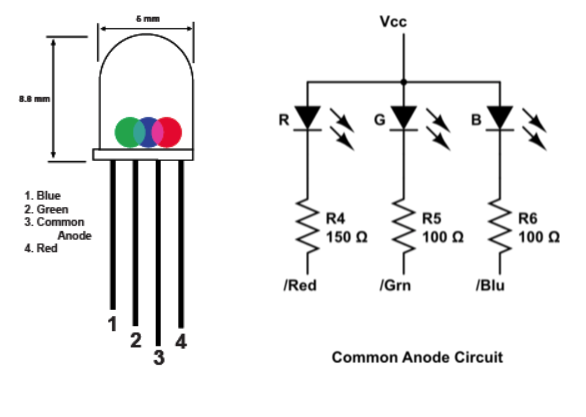
In your kit, you have a "common anode RGB LED." This means that the three LEDs in the RGB package share a common power source, and turn on when the R, G, or B legs have a low enough voltage to cause current to flow. The LONGEST leg is the "common anode" and should be connected to power (do you need a resistor?). The rest of the legs will be connected to pins based on the code you decide to use.
You should add the LEDs in the schematic below.
Here is sample code that controls the color of an RGB LED using the Arduino.
One of the useful aspects of the Arduino is the multitude of analog input pins. We'll explore this more now.
Now that you have a set up that lets you look at changes in the analog voltage from the potentiometer, let's swap in other analog sensors!

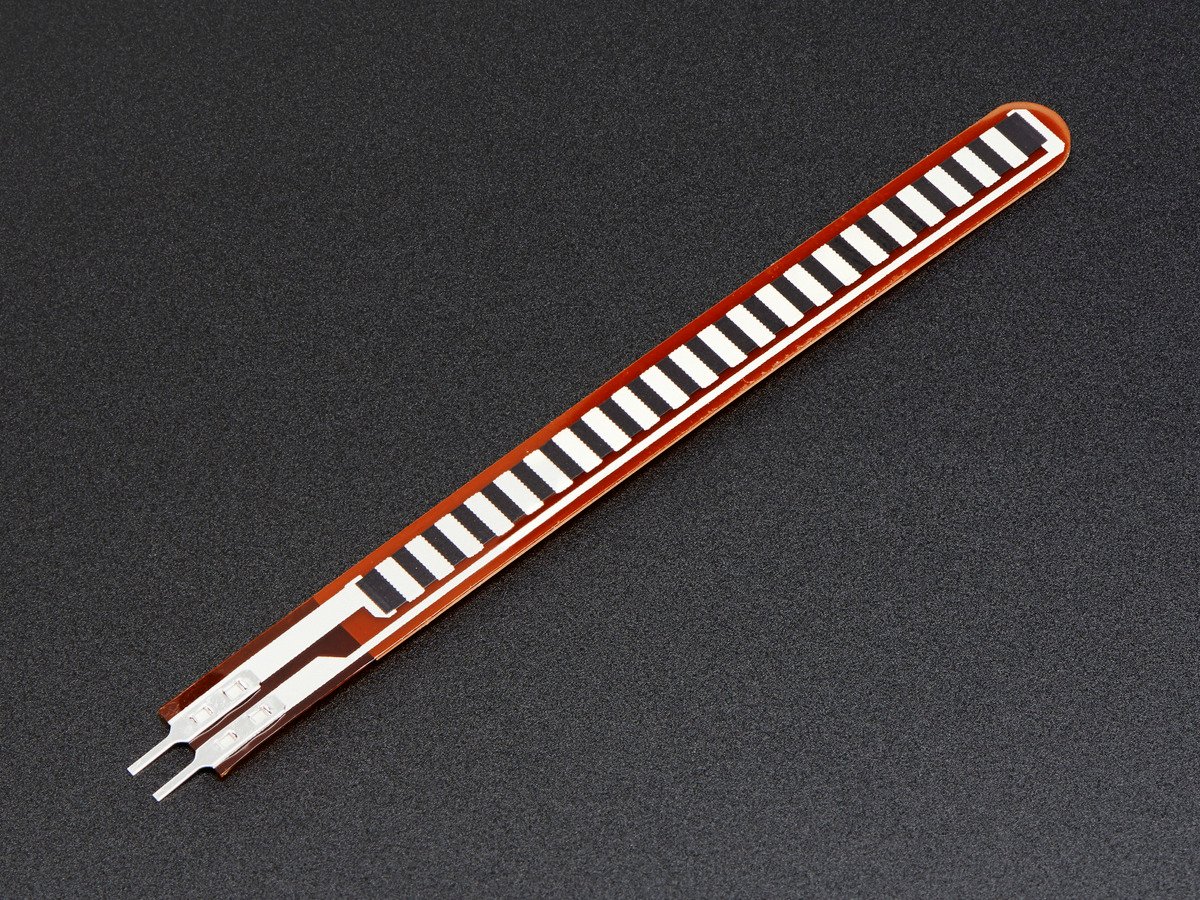
The FSR (force sensitive resistor) changes resistance — in this case when pressure is applied to the FSR. Here's the datasheet. We'll use a voltage divider with a 27kOhm resistor, using the analog input with the previous potentiometer code. (Feel free to use a 10kOhm resistor instead, or anything in this range.)
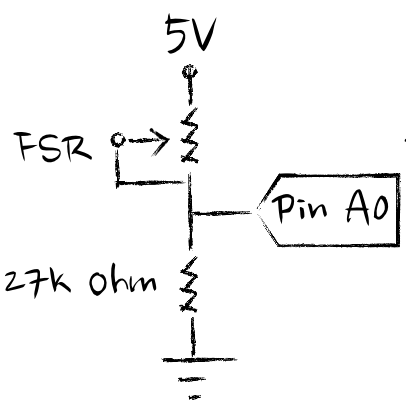
We need a voltage divider because the Arduino can't measure resistance directly, which is the thing that changes when you physically interact with the sensor. A voltage divider circuit converts a change in resistance to a change in voltage.
a. What voltage values do you see from your force sensor?
b. What kind of relationship does the voltage have as a function of the force applied? (e.g., linear?)
c. In Examples->Basic->Fading the RGB LED values range from 0-255. What do you have to do so that you get the full range of output voltages from the RGB LED when using your FSR to change the LED color?
Now experiment with the flex sensor (Optional), photo cell and softpot.


a. What resistance do you need to have in series to get a reasonable range of voltages from each sensor?
b. What kind of relationship does the resistance have as a function of stimulus? (e.g., linear?)
Control the colors of the LED using the above sensors ( including FSR )
Some more sophisticated sensors have ICs that measure physical phenomena and then output an digital signal indicating what the analog voltage reading is.
The accelerometer is a 3-axis, accelerometer based on the LIS3DH. The LIS3DH is a 3.3V part, but the Adafruit board has an onboard voltage regulator so that the part can be powered on 5V power on the Vin pin.
Here's the Datasheet
Unlike the other parts we've used to date, this is a "smart sensor" which can communicate the sensor readings digitally (rather than through an analog voltage) using communication protocols I2C and SPI.
This example code is meant to read values from a 3-axis accelerometer out to a computer over the serial monitor. Test it out! Hint: make sure to read the I2C Wiring section carefully, because the picture uses a different kind of Arduino. Here's a Fritzing diagram of the correct wiring:
https://github.com/FAR-Lab/Interactive-Lab-Hub/tree/master/Lab4/LIS3DH_breadboard.JPG
Adapt the code to indicate what your readings are on the X, Y and Z axes of the accelerometer on your 16x2 LCD panel.
Now set up the RGB LED so that each color is mapped to the X, Y and Z axes accelerations.
Get a feel for the data the accelerometer provides. Pick up the Arduino+accelerometer board and tilt it in various directions. Start by holding it so that the accelerometer board is parallel to the ground. Find in which direction the X reading increases and decreases; do the same for the Y reading.
a. Include your accelerometer read-out code in your write-up.
The sample code in File->Examples->EEPROM shows functions from the Arduino EEPROM Library to write and read values to Arduino's EEPROM. This modified version of the SwitchState code employs these functions in three different states. Try it out.
a. Does it matter what actions are assigned to which state? Why?
b. Why is the code here all in the setup() functions and not in the loop() functions?
Each character in the string is a byte. That is, it takes 8-bits to encode a character, so the number of characters in the string we are writing is the number of bytes we are occupying in EEPROM. The Atmega 328P at the heart of the Arduino has 1024 bytes of internal EEPROM Memory (which is separate from the 32KB of Program memory it has for the code it is running.)
c. How many byte-sized data samples can you store on the Atmega328?
d. How would you get analog data from the Arduino analog pins to be byte-sized? How about analog data from the I2C devices?
e. Alternately, how would we store the data if it were bigger than a byte? (hint: take a look at the EEPROMPut example)
Modify the code to take in analog values from your sensors and print them back out to the Arduino Serial Monitor.
You've been thinking at a high level about a data logger and what it is used for; now you need to adapt that to the specific implementation.
A lot of the art of data logging is being clever about how to use the sensor. Feel free to engage the teaching team for advice.
Your data logger will have two main modes: one where it logs data and another where it plays the data back. Think a little about what sensors you would like to log data from and how you would like to display your data. Create a state diagram sketch that indicates how you'd like to switch between one mode and the other, and also what you'd like the program to do in each state. This can help you decide what buttons or knobs might be useful for your design.
You might make changes to your design before this lab is complete.
a. Turn in a copy of your final state diagram.
Now it's up to you to integrate the software and hardware necessary to interface with your data logger! Your logger should be able to record a stream of analog data (at a sample rate of your desire) and then play it back at some later point in time on your display of choice.
a. Record and upload a short demo video of your logger in action.
For this week’s lab, you will design and build an autonomous device that incorporates:
- Physical Fabrication
- Actuation
- Sensing/Input
- Timing
- Sound
As a guide, we have included instructions to get you most of the way through designing a Jack-in-a-Box. Feel free to explore alternatives to the basic design. For example, if you turn the box on its side, you could have a mouse trap, or a cat door.
Show photos and a video of your final design in action.
Include your sketches and designs for your device, including for ideas you didn't pursue this time.
Building off of the strip box from Lab 3, this box design is built from two cardboard strips that are the same width X.
This design can be made by scoring two long strips of corrugated cardboard of width X, with the following measurements:
| <---- X ---->
+ thickness of cardboard | <---- X ----> |
| --- | --- | --- |
| <---- X ----> | <---- X ----> | <---- X ----> | <---- X ----> |
|---|
Use an Olfa knife with a cutting mat to cut out your pattern, using 2 cuts to score the cardboard strip at the bends and 3 cuts to cut. (A second mat can be used as a straight edge, and you can use one strip to measure out X on the other.)

Fold the flaps up, and cut the as necessary to level the sides.
Hot glue the two pieces in a 't', with the 3-segment strip on the bottom. You have a few seconds, while the glue is hot, to make sure the pieces are lined up correctly before the glue cools and sets. The weight of the double cardboard bottom helps to make the box stable.


On the side flap where you plan to mount the servo motor, use a bead of hot glue along the edge to join the flaps together. Hold the flaps for a few seconds until the hot glue sets.

DO NOT GLUE THE OTHER SIDE FLAP.
The cardboard mount holds the servo motor against the side of the box.

This can be made with strip of cardboard scrap of width X, where X > the height of the servo motor
| F length of flap | D = depth of servo to the flange |
W width of the servo + two cardboard thicknesses |
D = depth of servo to the flange |
F length of flap |
|---|
Cut a square hole in the middle of the strip for the rectangular face of the servo to fit through.
Hot glue the flaps and the back of the servo and stick this in the back corner of the box, with the pivot of the servo near the lid. As before, you will need to hold things in place for a bit while the hot glue sets.


** include a photo of your box and servo mount **
Check to make sure your breadboard and battery fit in. To make programming easier, orient things so the USB cable faces the open side of the box.

Use shipping tape to make slick patches on the sides of the box, and use removable blue tape (with the ends folded under to make grab tabs) to make a reclosable service panel for your box.


** include a photo of your box closed **

Tip: If you don't have the 9V connector, you just need to make sure that the micro controller is plugged into your computer, for power.
Load the example previously downloaded.
You can also make your own program but make sure you put HIGH digital value to pin 5 if you connected the circuit as the one in the electronics part.
Pay attention that you can change the position of close and open box in the following lines:
#define closePos 10
#define openPos 110
You'll have to hot glue an arm to the servo motor arm to push back the lid. How should that arm be designed?
** include a photo of your arm design **
Think about where each component should go, and assemble your box so that the servo motor opens the box.
** include a video of the box opening **
Using cardboard, paper, or found objects, make a jack that pops out when the top opens.
Here are useful links:
How to make a paper spring How to Use Slicer to make 3D shapes using stacked slices of laser (or Olfa) -cut cardboard
** include drawings, sketches or links to any part files used for creating Jack **
** include a video of the finished design **
For your write up, include:
-
Your Arduino code.
-
.stl or .svg files for your Jack — if you use some other technique, include the respective supporting material.
-
At least one photo-studio-quality photo of your box closed, and another photo of your box open.
-
A video of your box in action.