A Review on Machine Learning Algorithms Applied in the Stock Market - ECE-180D-WS-2024/Wiki-Knowledge-Base GitHub Wiki
word count: 823
I. Introduction
The use of historical stock market data is essential to making informed trades. Exchanges such as NASDAQ possess historical records on stock movements of various companies ever since its foundation during the 1970s. This information was essential for traders reliant on charting and the use of technical indicators.
In this modern age, market participants are able to execute near-instantaneous trades through online brokerage accounts. The outcomes of various trades are dictated by the participant’s ability to effectively analyze fluctuating data and execute trades in a matter of seconds.
By utilizing machine learning algorithms such as regression-based models, time-series forecasting models, and deep learning models, traders are better equipped to execute highly profitable trades.
II. Machine Learning Algorithms for Stock Market Prediction
i. Linear Regression Model
The linear regression is one of the simplest machine learning algorithms used in the stock market. The fundamental points are that this algorithm uses a regression equation to establish a linear relationship between dependent and independent variables to visualize general trends.
 Figure 1. general polynomial linear regression equation for n degrees
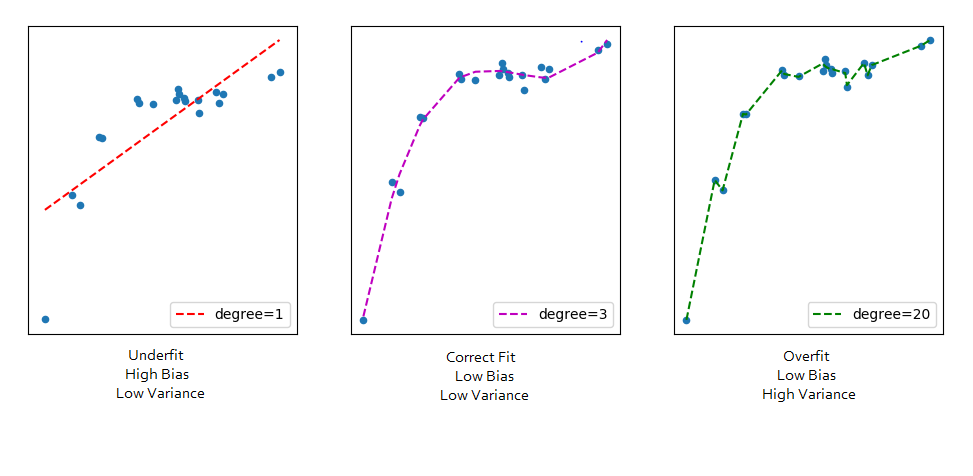
 Figure 2. Effect of higher degree polynomial linear regression on data fitting.
Often, the relationship between time and stock price is non-linear. By using the equation in Figure 1. we introduce higher degree polynomials to model complex patterns in the data.

Figure 3. general multiple linear regression equation.
Using the equation in Figure 3. we can establish a relationship between the dependent variable (e.g. stock price) and multiple independent variables (e.g. trading volume, market capitalization) to see a more generalized effect on the dependent variable.
Linear regression models are easy to implement and interpret, making them an excellent starting point for beginners in machine learning. However, they may not always capture the complexities of stock market data, especially when dealing with non-linear relationships or interactions between multiple variables. Advanced techniques like polynomial regression or combining linear regression with other models can help address these limitations. For instance, incorporating economic indicators such as GDP growth, inflation rates, and interest rates can enhance the model's predictive power.
ii. Autoregressive Integrated Moving Average Model (ARIMA)
The ARIMA model is a popular time series forecasting technique. This model is built on 3 key components:
- Autoregression (p): models current values as a function of its previous values
- Integrated (d): converts the times series data to a stationary format through differencing each data point
- Moving Average (q): eliminates noise to better visualize the overall stock trend
Diving deeper, the behavior of each component is adjusted through hyperparameter tuning. The p parameter indicates up to what extent the model considers lagged values to perform future predictions, the d parameter determines the frequency of differencing to achieve stationarity, and the q parameter determines the size of the averaging window

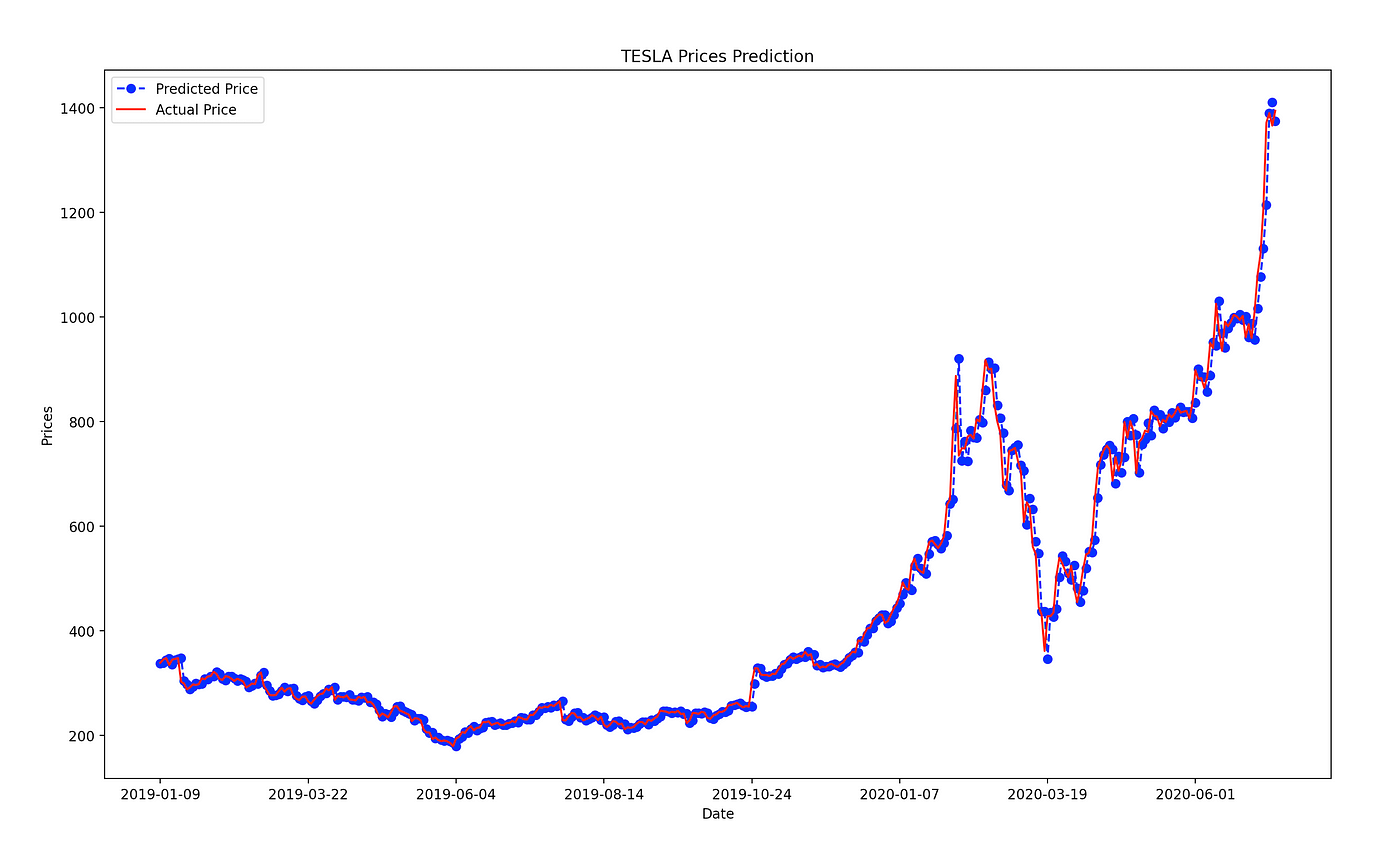
Figure 4. ARIMA model on stock data
One of the key strengths of ARIMA is its ability to model and predict time series data with trends and seasonality. This makes it particularly useful for forecasting short-term stock prices. However, ARIMA models require the data to be stationary, which means that the statistical properties of the series should not change over time. This can be achieved through differencing, but it adds an extra step to the modeling process. For example, ARIMA can be effectively used to predict the monthly sales of a company, helping in inventory management and resource allocation.
Overall, the ARIMA model is strongly suited for short term trades based solely off of historical market data. Consequently, it is vulnerable to market sentiment that may arise from news such as trades embargoes, resource shortages, etc.
iii. Long Short Term Memory (LSTM) Model

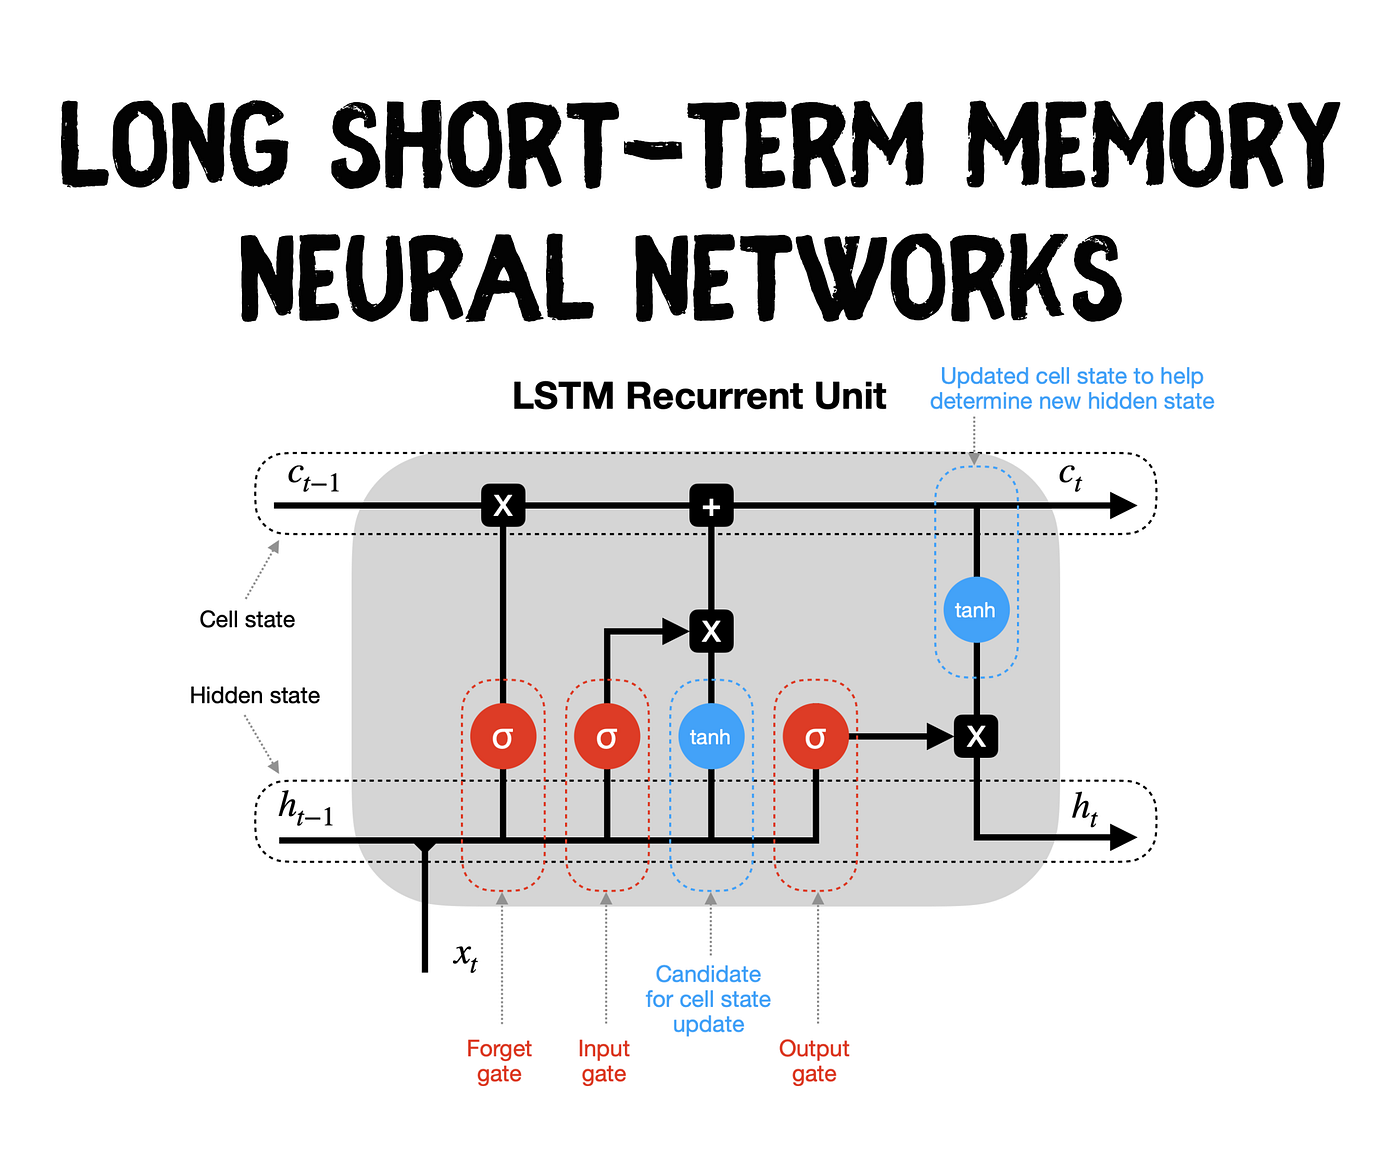
Figure 5. LSTM architecture
The LSTM falls under the realm of both time forecasting and deep learning. LSTMs are built off of recurrent neural network(RNN) architecture. What differentiates this model from RNNs is the presence of memory cells that are ideal for learning long term dependencies in market data. As seen in Figure 5, the LSTM possesses multiple sigmoid and tanh activation functions for determining which dependencies are stored and forgotten for future forecasting. In general, deep learning algorithms require large datasets and tuning multiple hyperparameters. Moreover, poor hyperparameter tuning leads to unnecessarily higher computational costs and overfitting.
LSTM models are particularly effective for capturing long-term dependencies in sequential data, such as stock prices. Their ability to maintain information over long periods makes them suitable for predicting future stock prices based on historical data. However, LSTMs can be computationally intensive and require significant resources for training, especially when dealing with large datasets. For instance, LSTMs can be applied to predict the next day's closing price of a stock by analyzing the past 60 days of trading data, allowing traders to make informed decisions.
iv. Deep Q-Networks (DQN)

Figure 6. Deep Q-Network architecture
The DQN model is a combination of both deep learning and reinforcement learning. The general idea behind a DQN model is that it trains an agent to learn an optimal policy within a specified environment. For simplicity, we model the stock market using the following data: closing prices and time. At each step, the agent receives an observation from its current environment. From there, it utilizes a neural network to approximate the q-value of different actions. Using this prediction, the model develops the most ideal policy for interacting with different states. Using this optimal policy, stock traders can fully automate their trading process by integrating it with a trading account API such as Alpaca API.
To further optimize a DQN, raw data may be preprocessed such that the agent is able to adopt various technical indicators and market sentiment. The DQN is highly suitable for short and long term analysis of stocks considering that it can learn various trading strategies faster. Despite its highly robust nature, the complexity of DQN architecture requires the trader to be well-versed in machine learning algorithms. As such, the development of DQNs is computationally expensive and time consuming.
Deep Q-Networks excel in environments where the agent needs to make a series of decisions over time, such as in trading. The reinforcement learning aspect allows the agent to learn from its interactions with the environment, improving its strategy with experience. This makes DQNs powerful tools for developing automated trading systems that can adapt to changing market conditions. For example, a DQN could be trained to manage a portfolio by learning to buy, hold, or sell stocks based on historical performance and market conditions.
v. Support Vector Machines (SVM)
Support Vector Machines (SVM) are supervised learning models used for classification and regression tasks. In the context of the stock market, SVMs can classify stock price movements based on historical data. They work by finding the optimal hyperplane that separates different classes in the feature space.
SVMs are particularly effective in high-dimensional spaces and are versatile in their application to various financial indicators. They can be combined with other algorithms to improve prediction accuracy and robustness. By using kernel functions, SVMs can handle non-linear relationships in the data, making them adaptable to complex market dynamics. For instance, SVMs can be used to classify whether a stock will close higher or lower than its opening price based on multiple features such as volume, previous close, and market sentiment.
III. Conclusion
The review of the various approaches has explored the nuances of using each machine learning algorithm in the stock market. From the simplicity of linear regression to the complex and robust nature of deep q-networks, each algorithm offers their own unique strengths and limitations toward market analysis.
For traders that have a deep understanding of machine learning algorithms, deep q-networks are the most ideal due to their capability to consider multiple scenarios in the stock market. For beginners, linear regression is one of the simplest yet most effective tools to gauge the general trend of a stock. Overall, the implementation of multiple algorithms in a trading system will lead to better informed decisions and profits in the stock market.
Machine learning continues to revolutionize the stock market by providing traders with advanced tools for analyzing data and making predictions. As these technologies evolve, their application in trading will become even more sophisticated, offering new opportunities for achieving financial success. By leveraging the strengths of various algorithms, traders can develop comprehensive strategies that enhance their decision-making processes and ultimately, their profitability.
References:
[1] https://www.investopedia.com/terms/a/autoregressive-integrated-moving-average-arima.asp
[2] https://www.tensorflow.org/agents/tutorials/0_intro_rl
[3] https://www.investopedia.com/terms/m/movingaverage.asp
[5] https://www.investopedia.com/terms/m/movingaverage.asp
[6] https://towardsdatascience.com/polynomial-regression-bbe8b9d97491
[9] https://towardsdatascience.com/deep-q-networks-theory-and-implementation-37543f60dd67