8.2 Beta Analysis - DianaCarolinaVergara/16S-rRNA-Analysis GitHub Wiki
Beta Diversity Analysis
Beta diversity (β-diversity or true beta diversity) is the ratio between regional and local species diversity. The idea was that the total species diversity in a landscape (γ) is determined by two different things, the mean species diversity at the habitat level (α) and the differentiation among habitats (β). Other formulations for beta diversity include "absolute species turnover", "^Whittaker's species turnover" and "proportional species turnover".
As Whittaker defined in 1960, is “the extent of change in community composition, or degree of community differentiation, in relation to a complex-gradient of environment, or a pattern of environments”.
In its simplest form (strict sense or multiplicative beta diversity), beta diversity is defined as the ratio between gamma (regional) and alpha (local) diversities (Whittaker, 1960; Jost, 2007). Therefore, it is the effective number of distinct compositional units in the region (Tuomisto, 2010). Essentially, beta diversity quantifies the number of different communities in the region. Beta diversity does not only account for the relationship between local and regional diversity, but also informs about the degree of differentiation among biological communities.
Tables and graphics examples of beta-diversity:


Here the PCoA plot showing beta diversity between Negative and Positive control (with induced necrotic enteritis) as measured by weighted UniFrac metric.


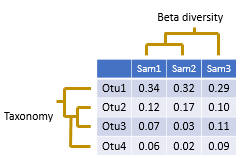
Or this table after taxonomic assignation.
Code:
Previously we had created a folder called -core-metrics-results. And there we are going to save our outputs.
First we are goign to quantify the Bray-Curtis index with qiime diversity beta-group-significance with bray-curtis distance matrix as input, --m-metadata-file with the previously used metadata table.
Than you sellect the exact collumn you want to use to compare your samples in the metadata table, with --m-metadata-column. Here I use the species column but you can compare with different categorical columns:
species, genus, geographic distribution, zooxanthellae (AZ-Z), reproductive time, season, etc.
qiime diversity beta-group-significance \
  --i-distance-matrix core-metrics-results/bray_curtis_distance_matrix.qza \
  --m-metadata-file sample_metadata.txt \
  --m-metadata-column species \
    --o-visualization core-metrics-results/bray_curtis-species-significance.qzv
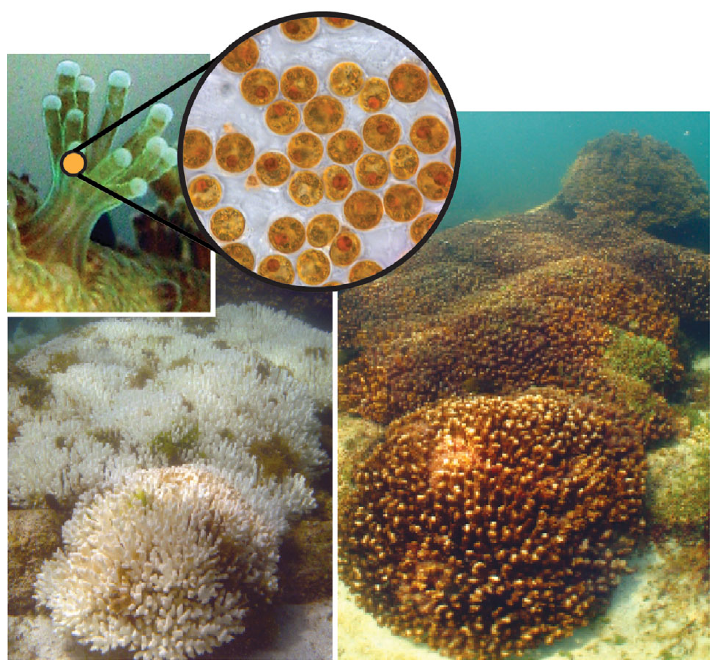
The same here but comparing between species with and without zooxanthellae (algae living inside the gastrovascular cavity of corals that I'm studing). Here some photos.


qiime diversity beta-group-significance \
  --i-distance-matrix core-metrics-results/bray_curtis_distance_matrix.qza \
  --m-metadata-file sample_metadata.txt \
  --m-metadata-column zooxanthellae \
    --o-visualization core-metrics-results/bray_curtis-zooxanthellae-significance.qzv

Here comparing between localities
different contries, oceans and seas, and between continental reefs and island isolated reef.
qiime diversity beta-group-significance \
  --i-distance-matrix core-metrics-results/bray_curtis_distance_matrix.qza \
  --m-metadata-file sample_metadata.txt \
  --m-metadata-column Depto \
    --o-visualization core-metrics-results/bray_curtis-depto-significance.qzv
And finally comparing between depth range
shallow, mesophotic or deep-sea ecosystems.
qiime diversity beta-group-significance \
  --i-distance-matrix core-metrics-results/bray_curtis_distance_matrix.qza \
  --m-metadata-file sample_metadata.txt \
  --m-metadata-column prof \
    --o-visualization core-metrics-results/bray_curtis-prof-significance.qzv
I prefer to use Bray-Curtis, but also you can use another statistics as Weighted-unifrac or unweighted-unifrac
Here the code for those stats:
qiime diversity beta-group-significance \
  --i-distance-matrix core-metrics-results/unweighted_unifrac_distance_matrix.qza \
  --m-metadata-file sample_metadata.txt \
  --m-metadata-column Depto \
  --p-pairwise \
  --o-visualization core-metrics-results/unweighted-unifrac-Depto-significance.qzv
qiime diversity beta-group-significance \
  --i-distance-matrix core-metrics-results/unweighted_unifrac_distance_matrix.qza \
  --m-metadata-file sample_metadata.txt \
  --m-metadata-column zooxanthellae \
  --p-pairwise \
  --o-visualization core-metrics-results/unweighted-unifrac-zooxanthellae-significance.qzv
References:
- Whittaker, R. H. (1960) Vegetation of the Siskiyou Mountains, Oregon and California. Ecological Monographs, 30, 279–338. doi:10.2307/1943563