12. Graphics - DianaCarolinaVergara/16S-rRNA-Analysis GitHub Wiki
Plotting graphics
For Alfa and Beta divesity Analysis:
Examples:

Fig 1. PCoA plot that shows preservation in Zymo best approximates the community captured using dry ice, Drierite and Ethanol, RNA-later.
qiime emperor plot \
  --i-pcoa core-metrics-results/unweighted_unifrac_pcoa_results.qza \
  --m-metadata-file sample_metadata.txt \
  --p-custom-axes species \
  --o-visualization core-metrics-results/unweighted-unifrac-emperor-species.qzv
qiime emperor plot \
  --i-pcoa core-metrics-results/bray_curtis_pcoa_results.qza \
  --m-metadata-file sample_metadata.txt \
  --p-custom-axes species \
  --o-visualization core-metrics-results/bray-curtis-emperor-species.qzv
qiime emperor plot \
  --i-pcoa core-metrics-results/bray_curtis_pcoa_results.qza \
  --m-metadata-file sample_metadata.txt \
  --p-custom-axes zooxanthellae \
  --o-visualization core-metrics-results/bray-curtis-emperor-zooxanthellae.qzv
qiime emperor plot \
  --i-pcoa core-metrics-results/bray_curtis_pcoa_results.qza \
  --m-metadata-file sample_metadata.txt \
  --p-custom-axes Depto \
  --o-visualization core-metrics-results/bray-curtis-emperor-depto.qzv
qiime emperor plot \
  --i-pcoa core-metrics-results/bray_curtis_pcoa_results.qza \
  --m-metadata-file sample_metadata.txt \
  --p-custom-axes prof \
  --o-visualization core-metrics-results/bray-curtis-emperor-prof.qzv
Another good tool for ordination graphics:
https://rstudio-pubs-static.s3.amazonaws.com/294383_fcf4912e1820425fa80cf1cfcd4208ff.html
For taxonomic Barplots:
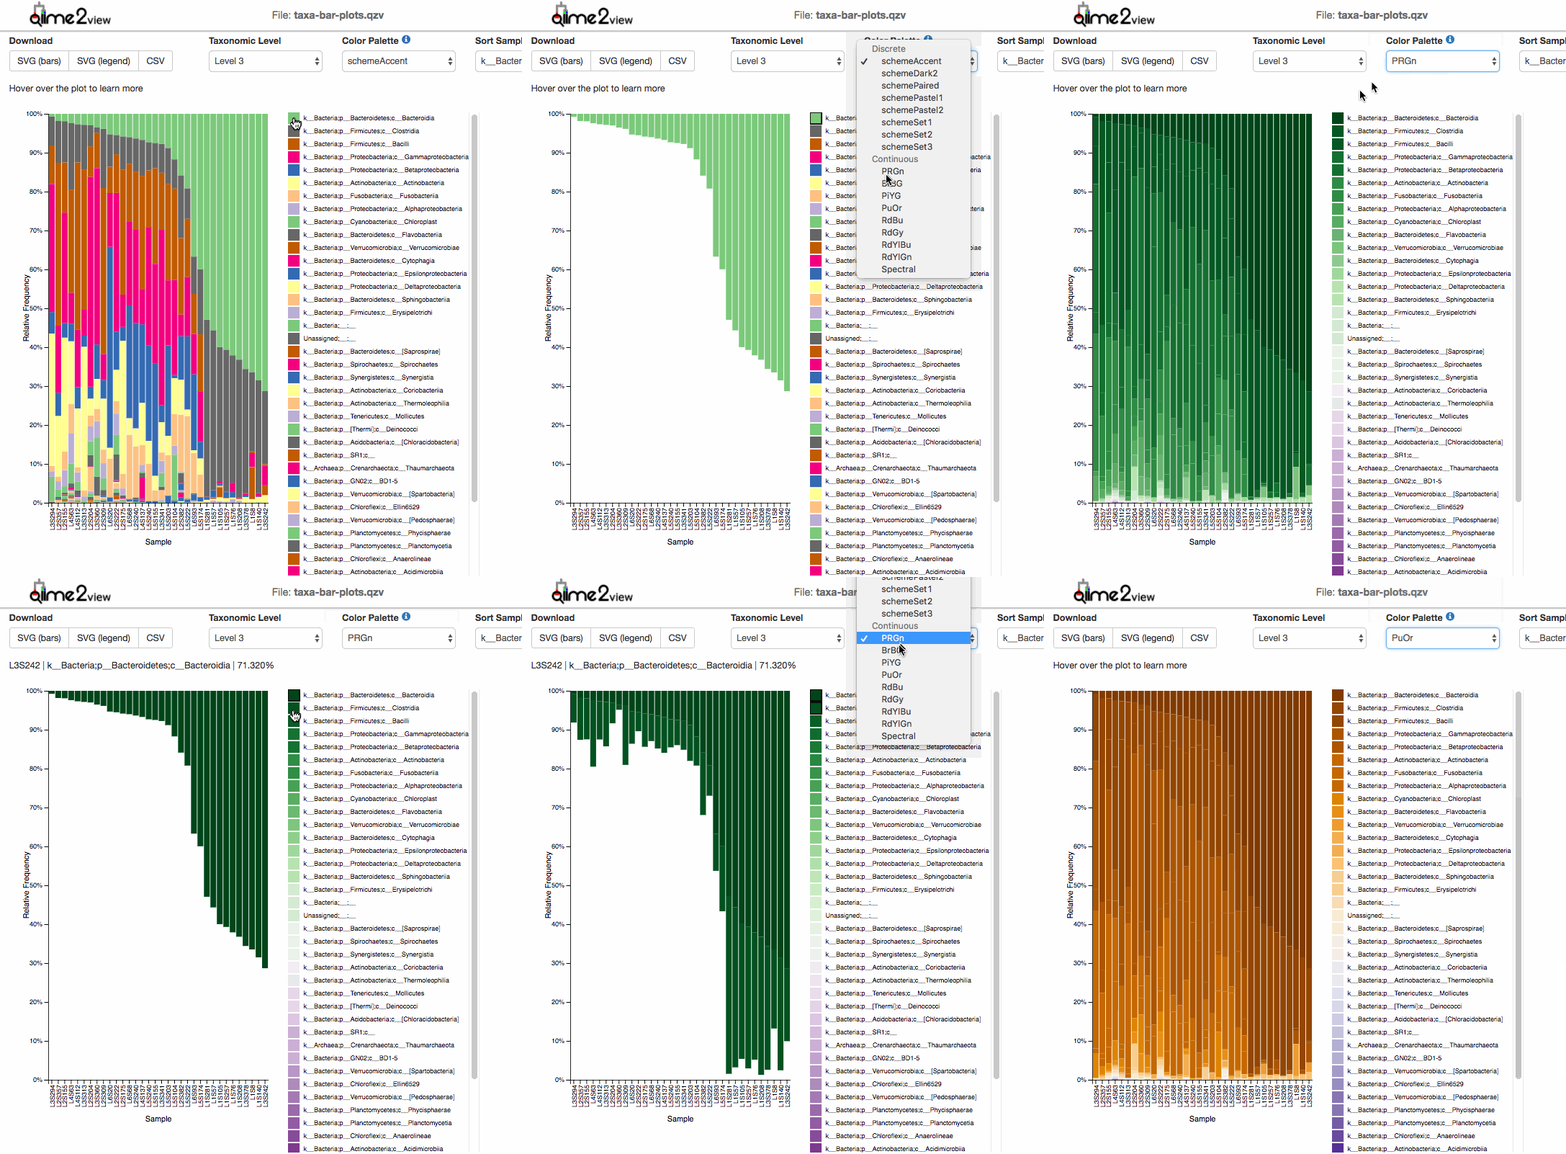
After taxonomic classification, the most common graphic to show all the taxonomic levels assignment for all the samples is the qiime taxa barplot.

Examples:

qiime taxa barplot \
  --i-table table-dada2.qza \
  --i-taxonomy taxonomy.qza \
  --m-metadata-file sample_metadata.txt \
  --o-visualization taxa-bar-plots.qzv
Heatmaps
Some examples of heatmaps:
- Full heatmaps

Fig _. Classification of the skin lesions using OR predictor genes. The heatmap was obtained by unsupervised hierarchical clustering of the baseline and posttreatment 3 data using 45 predictor genes.
- Collapsed heatmaps
by phylum, order, families, etc.

Fig _. https://forum.qiime2.org/t/preparing-data-for-analysis-with-dada2-denoising/6072
Heatmap (version 2018.4)
qiime taxa collapse \
  --i-table table-dada2.qza \
  --i-taxonomy taxonomy.qza \
  --p-level phylum \
  --o-collapsed-table collapsed_phylum_table.qza
qiime taxa collapse \
  --i-table table-dada2.qza \
  --i-taxonomy taxonomy.qza \
  --p-level family \
  --o-collapsed-table collapsed_family_table.qza
Here a very good example to join a phylogeny (or NJ tree) and a barplot.

Fig 3. Relative abundance taxa bar plot of vaginal samples from healthy asymptomatic women, and those diagnosed with BV or VVC before treatment. Taxa (groups of V6 rRNA gene sequences) are represented at the genus level where possible, with the exception of L. iners and L. crispatus , and the BV- Associated Bacteria (BVAB). The dendrogram above the bar plot represents the hierarchical average-linkage clustering of the microbiota profiles based on the computed weighted UniFrac distances.
qiime feature-table heatmap \
  --i-table table.qza  \
  --m-metadata-file sample_metadata.txt \
  --m-metadata-column species  \
  --p-normalize \
  --p-title Heatmap Species \
  --o-visualization feature_heatmap.qzv