Support Modules - DeNardoLab/BehaviorDEPOT GitHub Wiki
Support Module Inputs
- All of the support modules (except the Inter-Rater Module) require the same type of input files to function.
- The Validation, Optimization, and Exploration Modules require:
- Human annotation labels (in the form of an 'hB' file)
- BehaviorDEPOT output folder (saved as '_analyzed' in the data directory)
- The Inter-Rater Module requires:
- One or more human annotation files ('hB')
- BehaviorDEPOT labels can optionally be added to the folder
- To avoid errors, it is recommended that you place rater files together in a separate folder for analysis
- The Validation Module can optionally be run on batches of files; to use batch analysis place folders with paired 'hB' files and 'analyzed' folders into a new folder; select the folder containing the individual data folders when launching the module.
Inter-Rater Module
Allows user to make comparisons and visualizations of behavior annotations from multiple users using an averaged-rater projection or a chosen rater as a reference; includes useful visualizations and the ability to output a report of errors between each user and the reference dataset.
Inputs
- The IR Module is designed to input a folder containing 'hB' files and (optionally) BehaviorDEPOT 'analyzed' folders.
- All files for analysis must be placed within a single directory
Usage
- Select the 'Inter-Rater' button from the BehaviorDEPOT GUI.
- From the pop-up menu, select all plots you want to generate.
- If you want to exclude a rater file from analysis, check 'Restrict analysis to subset of rater files' in the pop-up menu.
- Click 'Start'.
- Select the directory containing the rater files to analyze.
- Assign names to each rater file.
- Select rater to use as reference (including the option to select the average of all raters).
- Select behavior to analyze from pop-up menu
- Results will save in the same directory as the rater data.
Outputs
Percent Agreement Plot
- This plot shows the percent agreement for all raters over the session analyzed. Values range from 0-1 (i.e. 0-100%).
- Agreement scores are only shown for behavior-labeled frames. Non-behavior frames that are in agreement by all raters will be display as 0.

Disagreement Plot
- This plot shows the disagreement between raters by individual rater. The value given per rater for any frame is the number of other raters who disagreed at that frame.

Percent Overlap Plot
- This plot shows the percent overlap between each pair of raters.

Performance Plot
- This plot shows the precision, recall, f1 score, and specificity.

Error Tables
- This is a folder containing text files for each rater. In each file, the index start and stop values are reported for all errors found between the reference data and individual rater, organized by length of error span. Additionally, the length of each error 'bout' and the type of error are reported.
- Error types: false positive (FP) or false negative (FN)

IR_Results.mat
- Structure containing all data displayed in plots.


Validation Module
Allows user to choose a batch of BehDEPOT-analyzed files (with associated hBehavior files) and quickly generate performance statistics and visualizations for each video and average statistics for the entire set.
Inputs
- The Validation Module is designed to input either:
- A) A directory containing a BehaviorDEPOT 'analyzed' folder and an associated 'hB' file.
- B) A directory containing folders with 'analyzed' and 'hB' files, with one set of files per folder.
Usage
- Select the 'Classifier Validation' button from the BehaviorDEPOT GUI.
- Select a directory with data to validate (either a directory with data [single] or a directory of directories with data [batch]).
- Select the behavior to validate.
- Results will be saved in the same directory as the input data.
Outputs
Average Performance
- Plot of average performance values across all sessions in validation set.

Performance by Video
- Plot of performance values for individual videos in the validation set.

VResults.mat
- Structure containing all data displayed in plots.

Classifier Optimization Module
Allows user to choose a behavior classifier, 1-2 classifier parameters (i.e. thresholds), a range of test values, and a human annotation file to quickly examine effects of chosen values on classifier performance (reporting F1 score and ROC-based AUC values for range of tested parameters)
Inputs
- The Optimization Module is designed to input a BehaviorDEPOT 'analyzed' folder and an associated 'hB' human labels file.
Usage
- Select the 'Classifier Optimization' button from the BehaviorDEPOT GUI.
- Select a BehaviorDEPOT 'analyzed' folder to use for optimization.
- Select an 'hB' human annotations file associated with the previously chosen 'analyzed' folder.
- Select a behavior to optimize (from the hB file).
- Select a classifier to use for optimization.
- Select a parameter to use for optimization. Other parameters can be tested using iterative rounds of optimization.
- Repeat step 6.
- Input a list of values for each parameter to test (can be any number of values; list can be comma or space separated).
- Results will be saved in the same folder as the input data.
Outputs
F1 Scores
- This plot displays F1 scores for each combination of parameter values chosen.

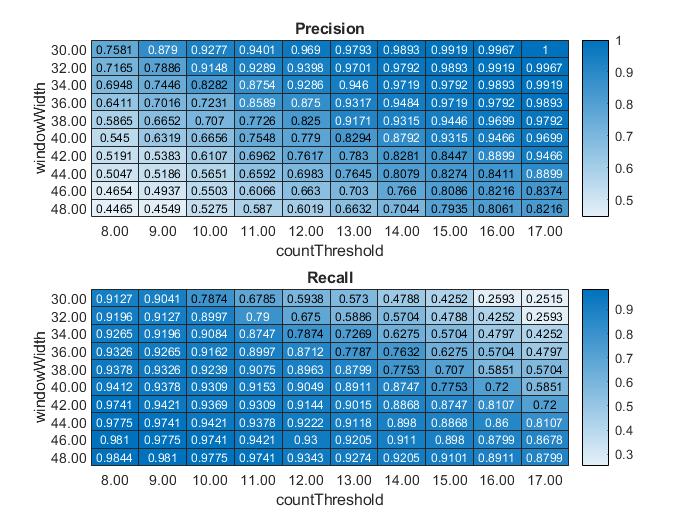
Precision/Recall
- This plot displays the precision and recall for each combination of parameter values chosen.
oResults.mat
- Structure containing all data displayed in plots.

Data Exploration Module
Allows user to choose 1 or 2 metrics from a BehDEPOT-analyzed file and an associated hBehavior file to sort data by chosen behavior and generates a report comparing the behavior subset to the complete dataset based on the selected metrics.
Focused Exploration Mode
Inputs
- The Exploration Module is designed to input a BehaviorDEPOT 'analyzed' folder and an associated 'hB' human labels file.
Usage
- Select the 'Data Exploration' button from the BehaviorDEPOT GUI.
- Select a BehaviorDEPOT 'analyzed' folder to use for exploration.
- Select an 'hB' human annotations file associated with the previously chosen 'analyzed' folder.
- Select 'Focused' mode from the pop-up menu.
- Select metric to test (e.g. head angle, tail velocity, distance between 2 tracked points, etc.).
- Repeat step 4.
- Select behavior to examine (from 'hB' file).
- Results will be saved in the same directory as the input data.
Outputs
Behavior Histograms
- These plots show the histograms of select metrics with labels for behavior and non-behavior frames.
- These plots are useful for visualizing how well different metrics split apart the data based on behavior labels and allows visual identification of likely threshold values.

Z-Score Boxplots
- These boxplots display the distribution of values within each metric for behavior and non-behavior labeled frames.
- All data displayed are shown in metric z-scores.
- Behavior or non-behavior datasets will be randomly sampled to match the number of frames of the smaller dataset, in order to ensure reasonable comparisons.

GLM Probability Estimates
- This plot displays the estimated likelihood of a frame being a behavior-labeled based on various values of the chosen metrics (+/- 1-2 standard deviations).
- The GLM model associated with these estimates is also saved for future use.
- These probability outputs are estimates and are designed to help user's find interactions between different metrics that are relevant to behavior.

GLM Model
- Model for predicting behavior generated by using chosen metrics as predictors.
Results.txt
- Text file containing information about sample means, standard deviations, and Mahalanobis distances for behavior/non-behavior samples per metric selected.
Broad Exploration Mode
Inputs
- The Exploration Module is designed to input a BehaviorDEPOT 'analyzed' folder and an associated 'hB' human labels file.
Usage
- Select the 'Data Exploration' button from the BehaviorDEPOT GUI.
- Select a BehaviorDEPOT 'analyzed' folder to use for exploration.
- Select an 'hB' human annotations file associated with the previously chosen 'analyzed' folder.
- Select 'Broad' mode from the pop-up menu.
- Select behavior to examine (from 'hB' file).
- (Optional) Remove metrics from model as desired.
- Results will be saved in the same directory as the input data.
Outputs
GLM Model
- Model for predicting behavior generated using metrics as predictors.
Ranked List
- Ranked list of potential predictors for user-defined behavior.