3D temperature map - DaveL17/indigo-scripts GitHub Wiki
There are two scripts (sample images are at the bottom of this page):
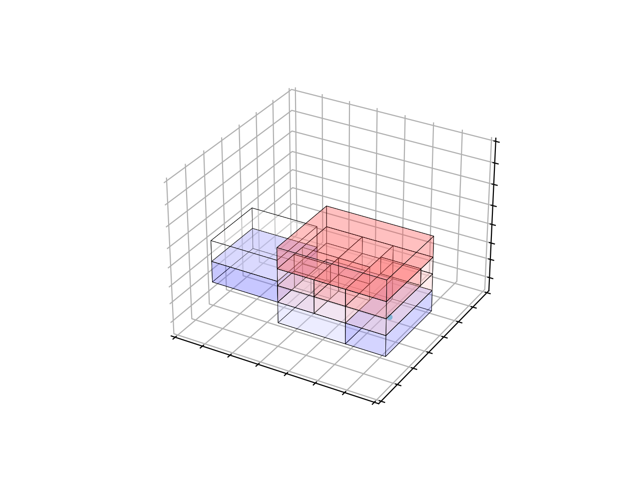
- 3d_map.py - where rooms are represented by cubic rectangles, allowing a more 3-dimensional view of the home.
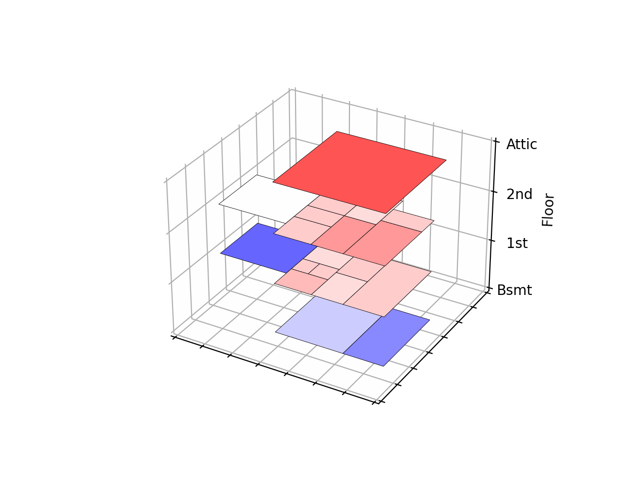
- 3d_map_planar.py - where rooms are represented by flat rectangles, allowing each level to be more easily distinguished from others.
Adapting either script to an Indigo environment will require a bit of revision.
The scripts require a few additional libraries to work. The scripts require Python 3 and some form of video back-end (I use ffmpeg). Because Indigo does not presently support Python 3, it is necessary to invoke the scripts using some means other than a typical Python script. Accomplishing this is beyond the scope of this wiki.
Getting data from Indigo to the scripts can be done in a variety of ways. I have included a reference to sys.argv().
This allows the needed data to be passed to the scripts via a command line parameter. The complete code needed to use
sys.argv() is not included in the scripts.
This is perhaps the most complicated part of the scripts to explain. Each room is represented using coordinates to describe the room in the 3D plane. Using the image below, the coordinate (0, 0, 0) is located in the lower left corner of the image. That is the "origin" and only the first of four needed coordinates. The second represents the distance along the X axis. The third represents the distance along the Y axis. The fourth (and last) represents the distance along the Z axis. The script takes care of filling out the rest of the polygon.
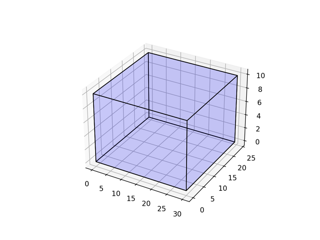
[
(0, 0, 0),
(30, 0, 0),
(0, 30, 0),
(0, 0, 30)
]
The planar plot uses slightly different coordinates because it only needs to reflect the image in the "2D" space. Also, the planar script represents the different levels of the house as 1, 2, 3, and 4.
The scripts are set up to use Matplotlib's 'bwr' color map. This map colors the plot using a range of colors traversing
from blue through white to red. Matplotlib supports many other color maps. The range of values that designate
the boundaries of the color map are set by the Normalize(vmin, vmax) call. Using 'bwr' as an example, any value of
vmin or lower would be colored blue and any value of vmax or greater would be colored red. For another category of
data -- humidity, for example -- a map from white to blue might be used. It is also possible to create custom maps;
however, that is beyond the scope of this wiki.
A sample bit of code shows one way that occupancy could be reflected within plotted image. This creates a point within the image at the designated coordinates. This is optional.
The scripts are written to display the resulting image within the standard Matplotlib image viewer using the
plt.show() call. Saving the images to disk uses the plt.savefig() call.
Another sample bit of code shows how to save the image as an animated plot and how to save it to disk. As mentioned above, this code requires some additional libraries in order to function. This is also optional.
Although developed to display temperature variations, the script could easily be adapted to display humidity, illumination, motion, etc.
3D Temperature Map Animation (300 Kb)
3D Temperature Map Planar Animation (3 Mb)