Process Tree - DaFuqs/MemProcFS-Analyzer GitHub Wiki
The interactive process tree Get-ProcessTree.ps1 shows you a hierarchical view of all processes running on your system at the point of your snapshot. It ingests the proc.csv created by MemProcFS-Analyzer, which itself is an extracted process view from MemProcFS. Such a display is much more tangible than a process table, visualizing the relationships between all the processes in your snapshot.
The Process Tree
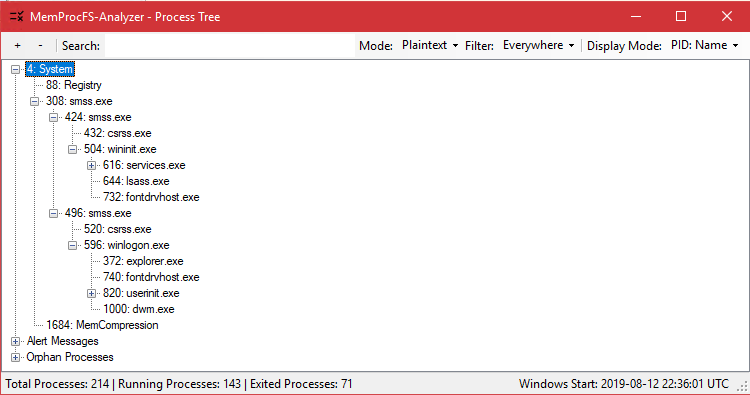
The process tree uses process IDs and parent IDs to create an interactive tree. The root node of this tree will always be the SYSTEM process with process ID 4.
Orphan Processes
Sometimes you will have processes where the parent process is not included in your snapshot anymore. Process entries, whose parent's can not be found anymore (Their Parent Process ID does not match any existing PID), they will get put under the Orphan node.
Pro Tip: Pressing Ctrl+C in the process tree copies all metadata of the selected entry to the clipboard in text form.
Properties View
You can view each entries details via two different methods.
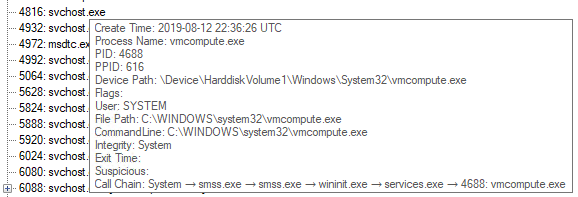
| Via Hover | Via Double Click |
|---|---|
 |
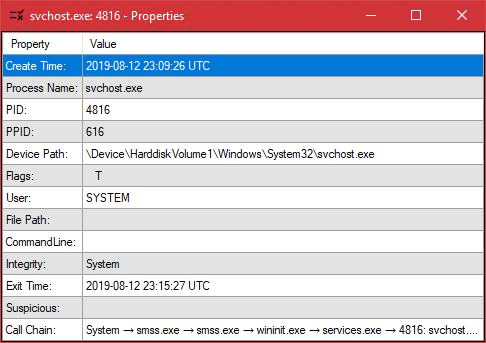 |
| Hovering over an entry shows it's details via tooltip | Double Clicking an entry brings up this handy window. You can open multiple to compare, or use hotkeys to copy it's entries in a unified format |
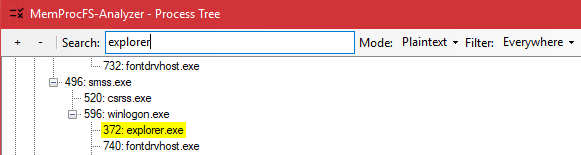
Searching
The process tree's greatest strength is the in-depth search and filter capabilities. You can filter for:
- Process Names
- PIDs
- Parents
- User
- Start Time
- and much more
Searching features 3 different modi:
- Plaintext: 1:1 text matching
- Extended: Allows the use of wildcards, like
*,?and[ ] - Regex: Complete regex Syntax
Via the Filter dropdown you can set to not search all entries properties, but to limit your search for PIDs, or any other property. All search hits will be marked in yellow, with the process tree being expanded to show your search hits and their children.
Enritchment
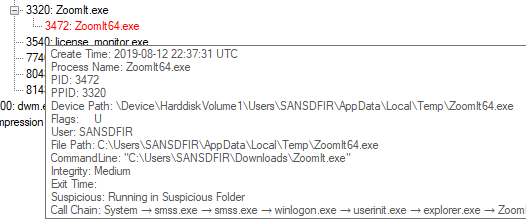
When inspecting a process tree, you may notice some entries being marked in red. These marked entries should be your first points of interest when inspecting a process tree. The color indicates that this entry is in some way notable, because it inhibits properties that make it interesting from a forensics viewpoint, often times properties which are used by malware, attackers, or advanced TTPs.
These abnormalties are added in the processes properties Suspicious tag. If a process fulfills multiple criteria for abnormalties, all of them are listed in this tag, split via ;.
As with all things there can be false-positives, too, like in the screenshot above: while Mark Russinovich's handy tool Zoomit is not running in a commonplace installation folder like Program Files, but running in a users folder, it probably isn't malicious. (but, if you want to make sure, check that executables certificates!)
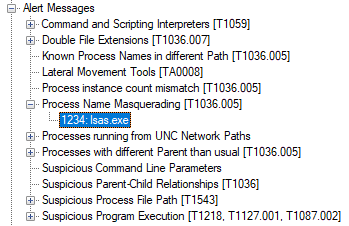
Alert Messages
The root tag Alert Messages lists all these unusual occurences all in one place. This can serve you as a quick glance to find thesee low hanging fruits without scrolling through the whole process tree. A process called lsas.exe should definitely spart your attention and interest quickly ;)
Manual Start
The process tree is launched during MemprocFS-Analyzer's workflow. If you would like to launch it separately you can simply tun the command <MemProcFS-analyzer-dir>\Get-ProcessTree\Get-ProcessTree.ps1 -CSVPath <path-to-proc.csv>.
Using the additional command line parameters you are also able to customize most of the alert messages to your own liking by passing your own parameters and therefore overwriting the default lists. For that, take a look at Get-Help Get-ProcessTree.ps1