운영 모니터링&장애 대응 방안 (Infrastructure) - DCBlock/Documentation GitHub Wiki
Infrastructure Monitoring
infra(server, network), on-host services(mysql, postgresql, nginx, apache 등)의 상태 변화를 모니터링하고, 장애시 경보가 가능한 시스템
Prometheus vs Graphite [참고]
(비교하는 두가지 솔루션 = 시계열 데이터 저장을 위한 Database + 데이터 시각화 도구)
Prometheus and Graphite are open-source monitoring tools used to store and graph time series data. Prometheus is a “time series DBMS and monitoring system,” while Graphite is a simpler “data logging and graphing tool for time series data.”
| Feature | Prometheus | Graphite |
|---|---|---|
| What it is | Fully integrated time series DBMS and monitoring system | Time series data logging and graphing tool |
| What it does | Scraping, storing, querying, graphing, and alerting based on time series data. Provides API endpoints for the data it holds | Stores numeric time series data and provides graphs of that data |
| Implemented in | Go | Python |
| Data types handled | Numeric | Numeric |
| Year released | 2012 | 2006 |
| Website | prometheus.io | github.com/graphite-project/graphite-web |
| Technical documentation | prometheus.io/docs | graphite.readthedocs.io |
| APIs and access methods | RESTful HTTP and JSON | HTTP API Sockets |
| XML support? | Yes (can be imported) | No |
| Server Operating Systems | Linux, Windows | Linux, Unix |
| Supported programming languages | .NET, C++, Go, Haskell, Java, JavaScript (Node.js), Python, Ruby | JavaScript (Node.js), Python, (although you can push metrics to it from virtually any language) |
| Partitioning supported? | Yes, sharding | Yes, via consistent hashing |
| Replication supported? | Yes, by federation | Not by default, but tools exist to support clustering |
| Data collection | Active or pull (configurable) | Passive or push |
Grafana, Kibana, Graphite, Elasticsearch
Grafana::Graphite에 저장된 시계열 데이터를 시각화하는 도구
Kibana::elasticsearch에 저장된 데이터를 시각화 하는 도구
ElasticSearch의 대시보드 툴로 유명한 Kibana 라는 프로젝트가 있습니다만, Grafana는 이 Kibana에서 영감을 받아 만들어진 Graphite판 Kibana라고 이해하시면 좀 더 쉽습니다.
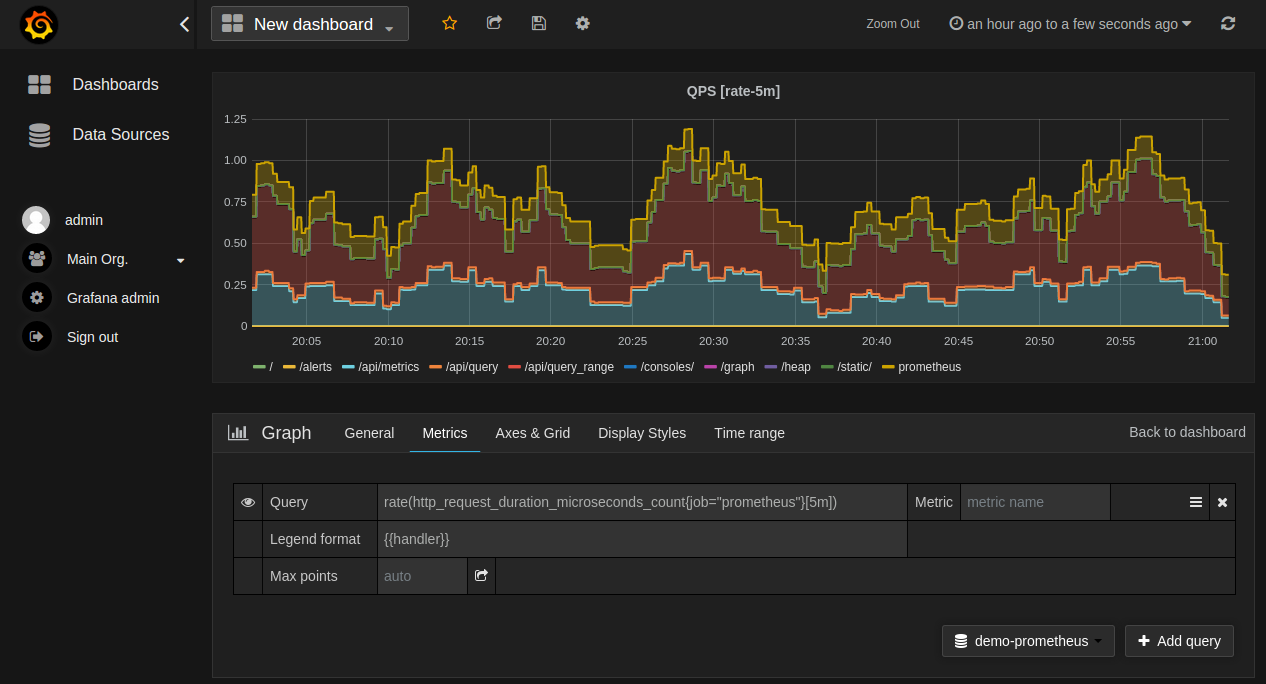
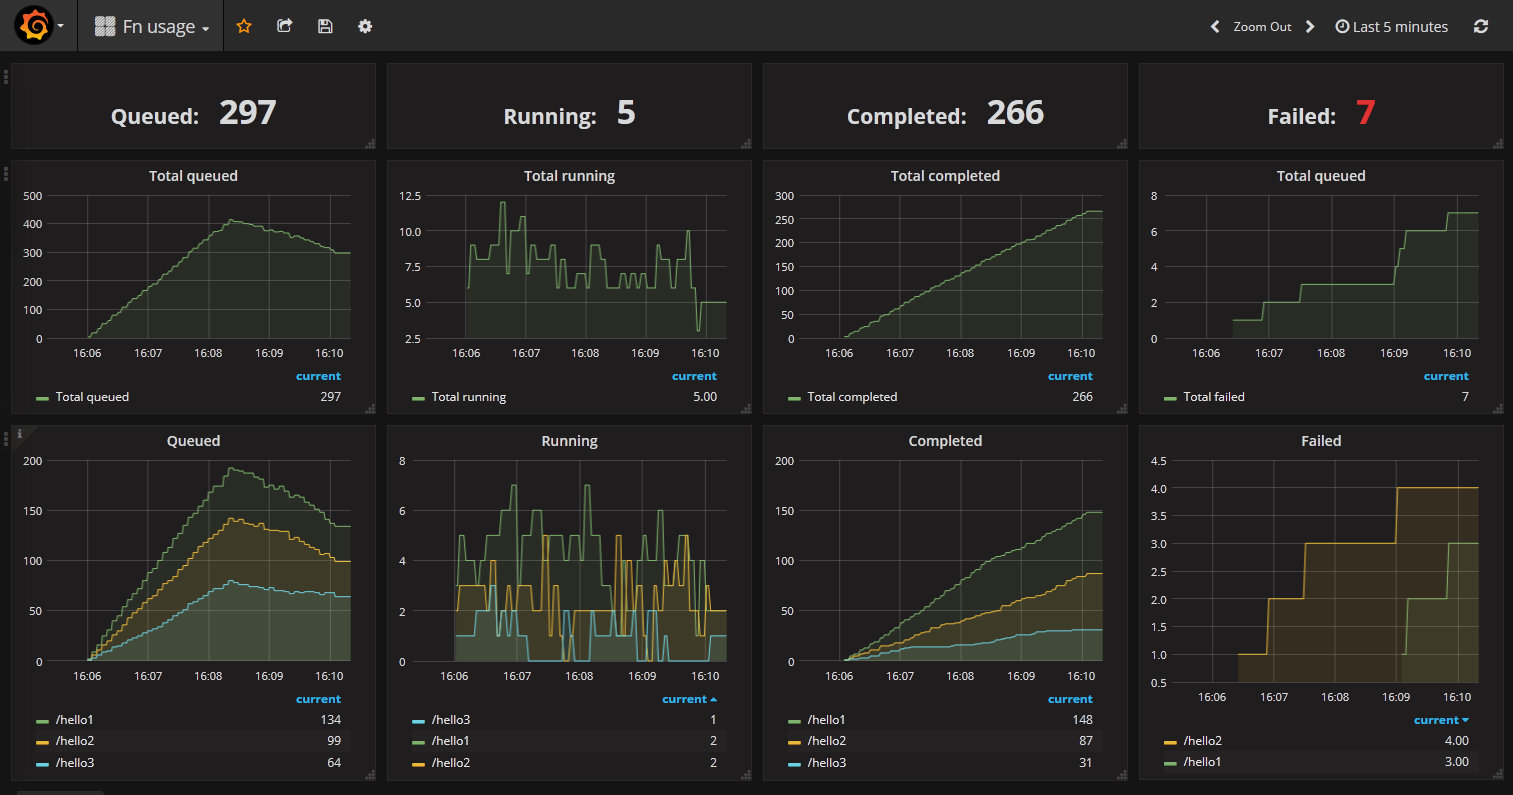
Grafana Dashboard + Prometheus Data Source
Grafana Dashboard를 사용하면 다양한 로깅 데이터 소스를 통합하여 모니터링 가능하고, Prometheus, sensu, zabbix 같은 모니터링 시스템과 연동하여 Grafana Dashboard에 통합 모니터링이 가능한 것이 장점이라 생각한다.
이것은 Prometheus를 사용하기 위한 것인가 Grafana를 사용하기 위한 것인가?
- CloudWatch
- PostgreSQL
- Prometheus
- Prometheus AlertManager
- PRTG
- etc ...
- Zabbix
- sensu
- etc ...
Prometheus Architecture [참고]
 Prometheus scrapes metrics from instrumented jobs, either directly or via an intermediary push gateway for short-lived jobs. It stores all scraped samples locally and runs rules over this data to either aggregate and record new time series from existing data or generate alerts. Grafana or other API consumers can be used to visualize the collected data.
Grafana Dashboard with prometheus


Prometheus vs Zabbix](https://stackshare.io/stackups/prometheus-vs-zabbix)
(많은 사람들이 선택한 이유?)
- Easy to setup
- Easy to extend
- Powerful easy to use monitoring
- Alerts
ICINGA2 [참고]
Icinga is the fork of Nagios, rewritten from scratch in version 2. Opposite to Shinken, it is a good fork with constant updates being made.
Scalability
General architecture:

Icinga 2 has a well-designed distributed monitoring scheme. Only pitfall I found while setting up the test cluster is the amount of settings related to distribution: It could be overwhelming initially.
UI

IcingaWeb2 seems like a decent UI with a lot of extension modules for a lot of purposes. From what I’ve seen, it looks most extendable and flexible, yet has all the features you could expect from a monitoring system UI out of the box.
Drawbacks
(유일한 단점은 설치가 복잡하고 어렵다)
The only drawback I’ve found so far is a complexity of initial setup. It’s not that easy to understand the Icinga point of view on monitoring if you’re used to having something different like Zabbix.