7: Webcam page - Cyrille-de-Brebisson/CBScope GitHub Wiki
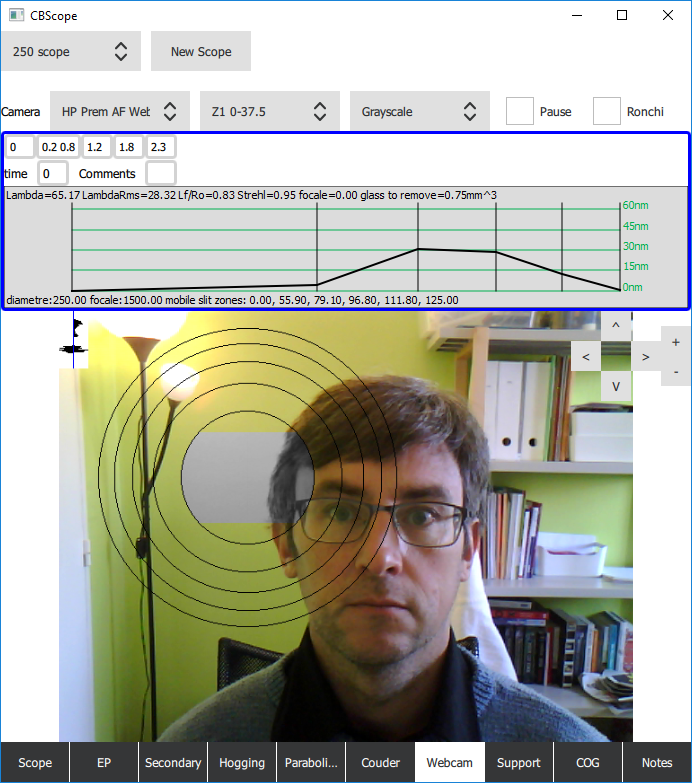
OK, this is another buzy “page”. It is designed to help you do your Foucault (and Ronchi) measurements. In the first use of the page, you will select one of the camera connected to your computer and should see something like this.
Normally, it would not show “you”, but your mirror under Foucault! However, I do not have my setup… well setup at this point in time, so you get my face!
2 “joysticks” are provided that allow you to move the mask and image around. Each stick has 3 controls. The main one, a 2 axis stick allows you to move the mirror mask or camera image. The vertical one is a zoom and the horizontal one a speed control for the 2 other sticks. Note that to “move the image around”, you need to zoom in. Else there is nothing to move!
One area of the mirror will be “grayed” out. This is the area under measure. On the top left of the picture, you will see 2 bar graphs. One for the right and one for the left side of the “zone”. The top of the bar graph represent dark pixels, the bottom light pixels. Here you can see that the left zone has a bunch or relatively light pixels while the right has 3 blocks of pixels. They are, respectively my hairs, my skin and the green area.
Should this be pointing at a mirror under Foucault, what you would see is a measure of the darkness/lightness of the mirror on the right and the left. Your Foucault tester is “on focal” for this zone if the right/left illumination are the same. Ie: if the right and left bar graphs are similar! This removes a lot of eye strain and makes Foucault testing a whole lot easier!
Once you have found the focal, enter the measurement on the Foucault reading at the top (it is the last reading from the “Parabolization” page. You will have to go back there and click on “Add measure” to create a new one when needed) and move on to the next zone by either clicking on it in the picture, or by selecting it on the drop down. By default, the data measured by the bar graph is the luminosity, but you can change it to the average of R/G/B, or one of the 3 color channels. Press on the Pause button to pause the camera if needed.
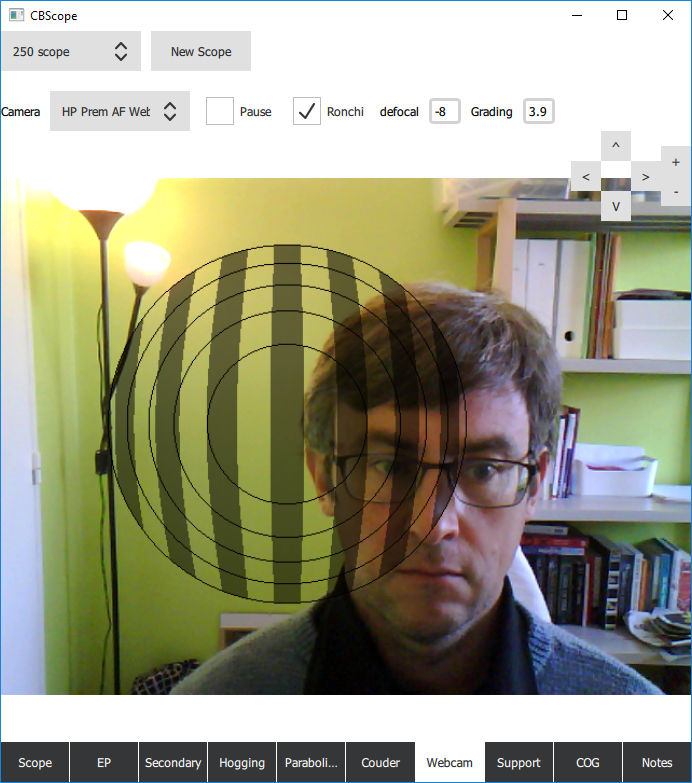
Press on “Ronchi” to change from a Foucault to a Ronchi type test. Enter your grading in slit per mm!!!!! and the defocalization that you are at and it will draw the Ronchigram that you should see! The code to calculate the Ronchigram was lifted from Mel Bartels’ website.
One last feature on this buzy page is the image drop! Drop an image file in the window and the image will replace the camera and let you work on a still picture.