project3 team1 - CourseReps/ECEN489-Fall2015 GitHub Wiki
Project 3 - Team 1
Managing Water Resources - Interconnected tanks
Team Members & Responsibilities
- Kartic Bhargav - Model, Simulation, Calibration
- Xiangdong Yu - Qt, Simulation (Part1)
- Kan Zhang - Qt, Simulation
- Thomas Branyon - Arduino, PCB
##Problem 1 - Measuring the Volume of an object
1. Mathematical Modelling
Basic Principle: The Volume of an object can be calculated by integrating the flow rate with time.

Here t is the time taken by the flow to once again reach steady state. Qout and Qin are the Out and In Flow rates respectively. Qout is calibrated as a function of height by using the approach described in the implementation section.

2. Simulation
For simulation purposes, we calculate the outgoing flow rate (from the bottom of the tank) by the following continuity equation (A.v is a constant). The incoming flow rate would almost be close to zero. [Phi is a constant = 0.95]

Simulation Code:
- We assumed the 2 tanks are at heights h1 and h2.
- Regardless of the PID control as dropping the object will increase the water level for sure, we will have the net flow rate to be:
- From the equation, we can get a updating net flow rate with processing time moving.
Q2.extend([(math.pi*pow(D, 2)/4)*phi*math.sqrt(2*g*(h2))]);
V = V - Q2[i]*(T[i]-T[i-1]);
h2 = V/A;
VolOfStone = VolOfStone + Q2[i]*(T[i]-T[i-1]);
Simulation Results:

3. Implementation
For our implementation, we have a Teensy hooked up to a Bluetooth module as well as connected to a Flow Sensor (to measure the flow rate), a pump (to inject water into the tank) and an IRSensor (to estimate the current height of the water column). A picture of the rig is shown below.

Once every 500 loop counts (time delay between loops = 1msec), the sensed values are transmitted via Bluetooth to the NUC. They are also simultaneously displayed on the serial monitor for verification purposes. A screenshot of the Serial Monitor is showed below.

For a given height setpoint, we estimate the Inflow Rate (as measured by the Flow Sensor) when the flow stabilizes. This is repeated for different values of h. The values of input flow rate vs height are then plotted to arrive at a calibration curve (displayed in the figure below).

Now, at steady state, InFlow = OutFlow in a tank. The only varying parameter that determines the OutFlow Rate is the height of the water column (Qout varies with the square root of height). Hence these values of Inflow for different heights are used as the OutFlow Rates when the system is not in steady state. In our case, this would correspond to the scenario of an object drop. The InFlow Rate at different points of time is estimated by the flow sensor.
Detection of object drop: Initially we bring the system to steady state with a given setpoint h. Dropping an object would disturb the equilibrium and we detect this event by observing an event of threshold breach (>4mm).
From then on, the NetFlow rate is calculated by our first equation. A summation of these values multiplied with the interval between measurements gives us the required Volume of Object. A table below shows the precision of our measurements.
| Steady-State Setpoint | Actual Volume | Calculated Volume | Percentage Error |
|---|---|---|---|
| 7cm | 100 ml | 100.09 ml | 0.09 % |
| 7cm | 200 ml | 209.14 ml | 4.57 % |
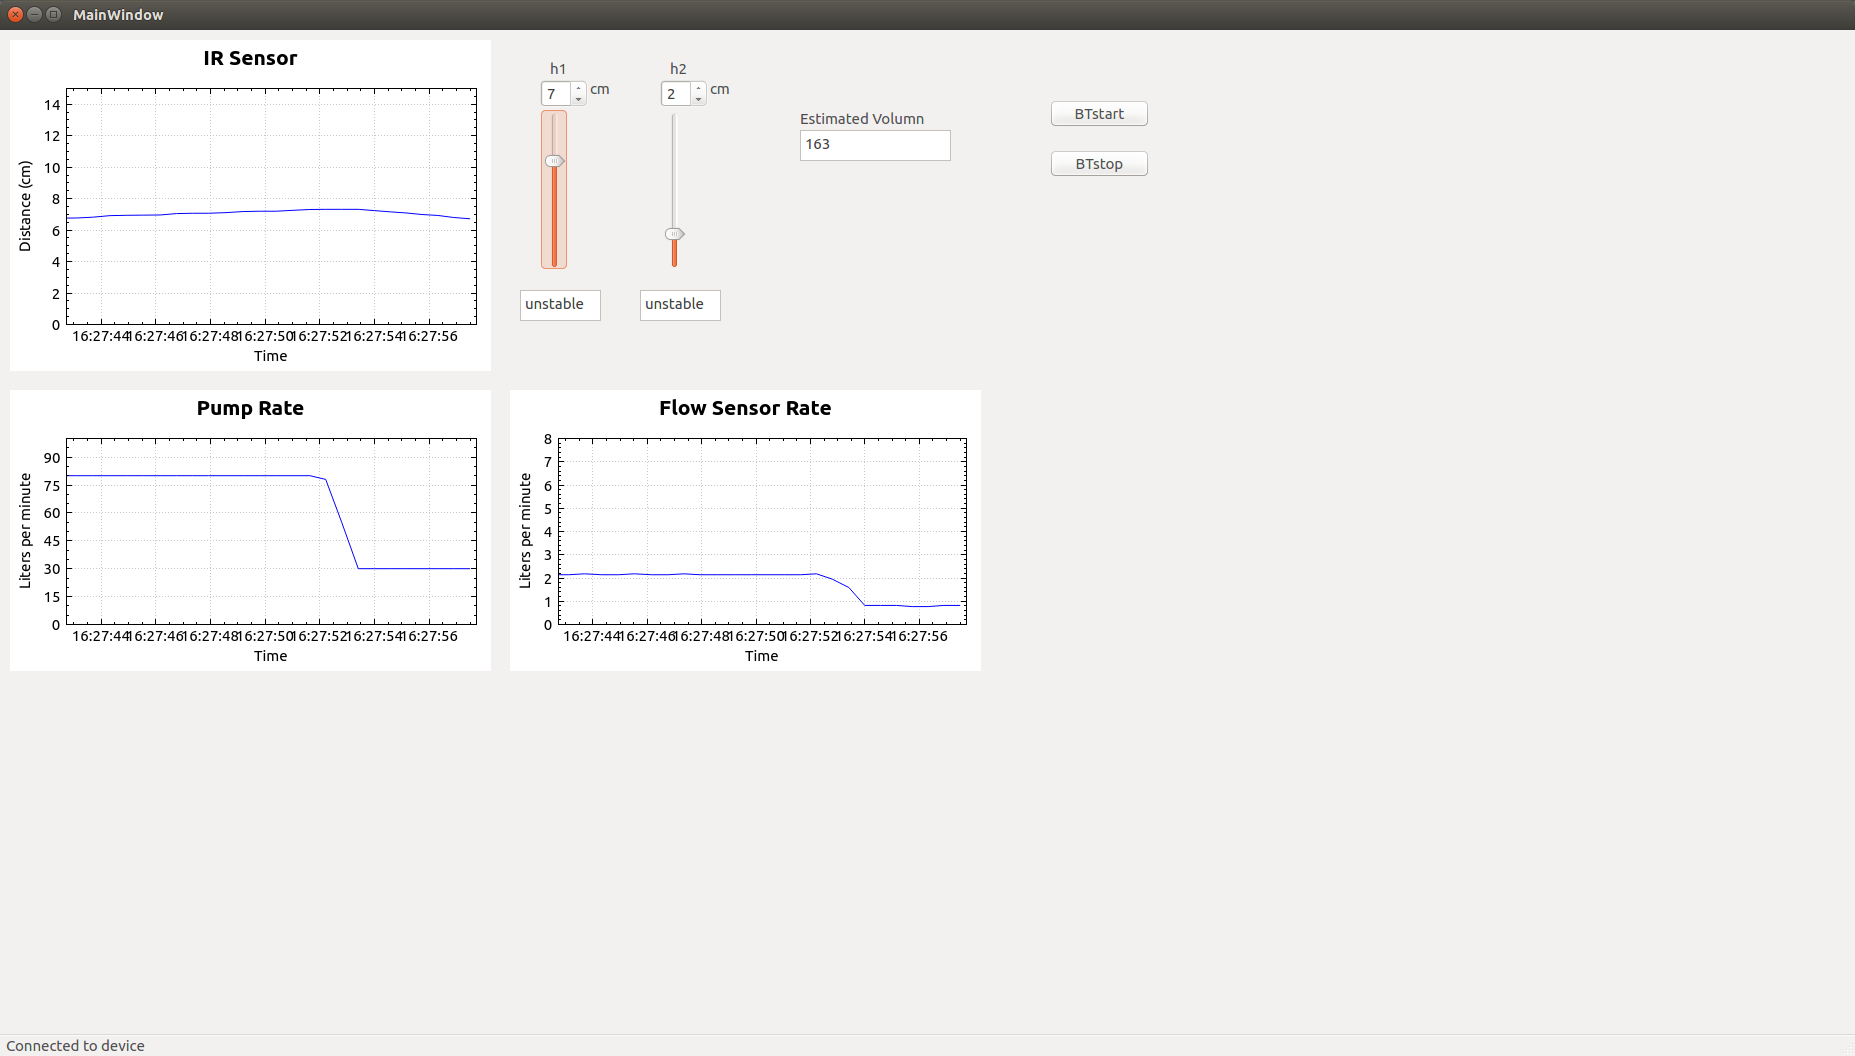
| 6cm | 150 ml | 163 ml | 8.67 % |
We perform this Volume computation on the Teensy and transmit the value to the Qt when calculated. The Qt application running on the NUC, receives the Volume data (as well as the sensed parameter-data) on a real time basis and displays them on the UI.
**A video taping the whole system in action can be found at this location **
##Problem 2 - Flow Stabilization between interconnected tanks Basic Principle: Flowrate (Q) in the interconnecting pipe between 2 tanks can be modeled with the pressure difference that exists between its two ends.

where D is the Diameter and L is the Length of the interconnecting pipe. Eta is the viscosity of the fluid and Rho is its density. dh is the difference between the current heights of the 2 tanks.

Code:
- The 2 tanks are at heights h1 and h2.
- Flowrates entering the tanks (InFlow) via the pumps are Qin1 and Qin2 (Output of the PID).
- Diameters of bottom pipes channeling the outflow are D1 & D2, with flowrates Qout1 & Qout2 respectively.
- The Diameter of the interconnecting pipe is D3.
Hence the Netflow across each Tank would be Inflow - Outflow = Qin - Qout (+) Qint. Qint would be added or subtracted to the Netflow based on whether h1>h2 or h2>h1.
Qin1 = flowrate1;
Qin2 = flowrate2;
Qout1 = Pi*D1*D1/4*Fi*sqrt(2*G*h1);
Qout2 = Pi*D2*D2/4*Fi*sqrt(2*G*h2);
Q3 = Pi*D3*D3*D3*D3/128/YITA*1000*G*dh/L;
dQ1 = Qin1+flag*Q3-Qout1;
dQ2 = Qin2+(-1)*flag*Q3-Qout2;
Vol1 = Vol1 + dQ1*T1;
Vol2 = Vol2 + dQ2*T1;
h1 = Vol1/(Pi*R1*R1);
h2 = Vol2/(Pi*R2*R2);
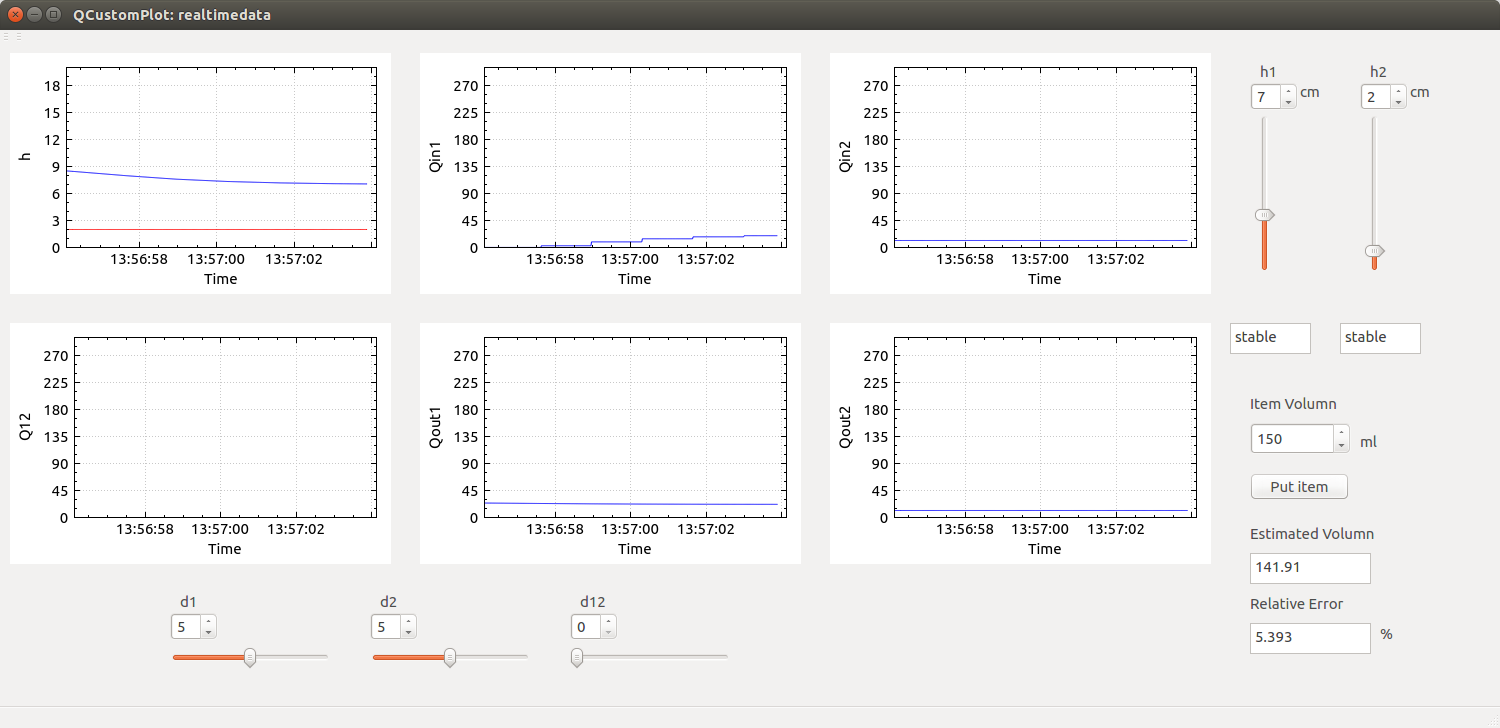
Simulation Results/UI:
4. PCB Layout Design
 This board has connections for two pumps, two IR sensors, and one flow meter through two 4-pin screw terminals. Decoupling/regulation caps have been added to power traces and GND vias are placed around the board for EMI/EMC performance.
Reference:
Final Project Video