Flame Graphs - CliMA/slurm-buildkite GitHub Wiki
Flame graphs provide a tree representation of a set of sampled stack traces, and can be used to show either CPU cost or memory allocations of a single process.
There are two steps:
- Collect the profile trace: see Profiling in the Julia manual
Profile.@profileto collect the stack traces based on periodic sampling: this is helpful for determining how much time is spect in each function.Profile.Allocs.@profileto collect the stack traces from memory allocations: this is helpful for identifying where memory allocations occur in the code.
- generate the flame graphs: we currently recommend using the ProfileCanvas.jl package which can export interactive HTML files, which can be uploaded as Buildkite artifacts.
Usage
- Although you can profile any block of code, it is generally easiest if you run it on a single function invocation.
- You should run the code first to trigger compilation (otherwise you will be profiling the compilation process).
Here we call this function step!(integrator) which takes in an integrator object that contains a model setup and time stepping information, and runs one step of the model.
- It suffices to run your code for one or two timesteps.
Timing profiling
# trigger compilation
step!(integrator)

# profile the `step!` function
import Profile
Profile.clear()
Profile.@profile step!(integrator)
profile = Profile.fetch()

# generate flame graph
import ProfileCanvas
profile_flamegraph = ProfileCanvas.view(profile) # generate flame graph from profile
ProfileCanvas.html_file("timing.html", profile_flamegraph) # save to file
Allocation profiling
# trigger compilation
step!(integrator)

# profile the allocations in `step!`
import Profile
Profile.Allocs.clear()
Profile.Allocs.@profile sample_rate=0.1 step!(integrator) # sample 10% of allocations
allocs = Profile.Allocs.fetch()

# generate flame graph
import ProfileCanvas
allocs_flamegraph = ProfileCanvas.view_allocs(allocs) # generate flame graph from allocation profile
ProfileCanvas.html_file("allocs.html", allocs_flamegraph) # save to file
Interpretation
- here is an example of a flame graph:
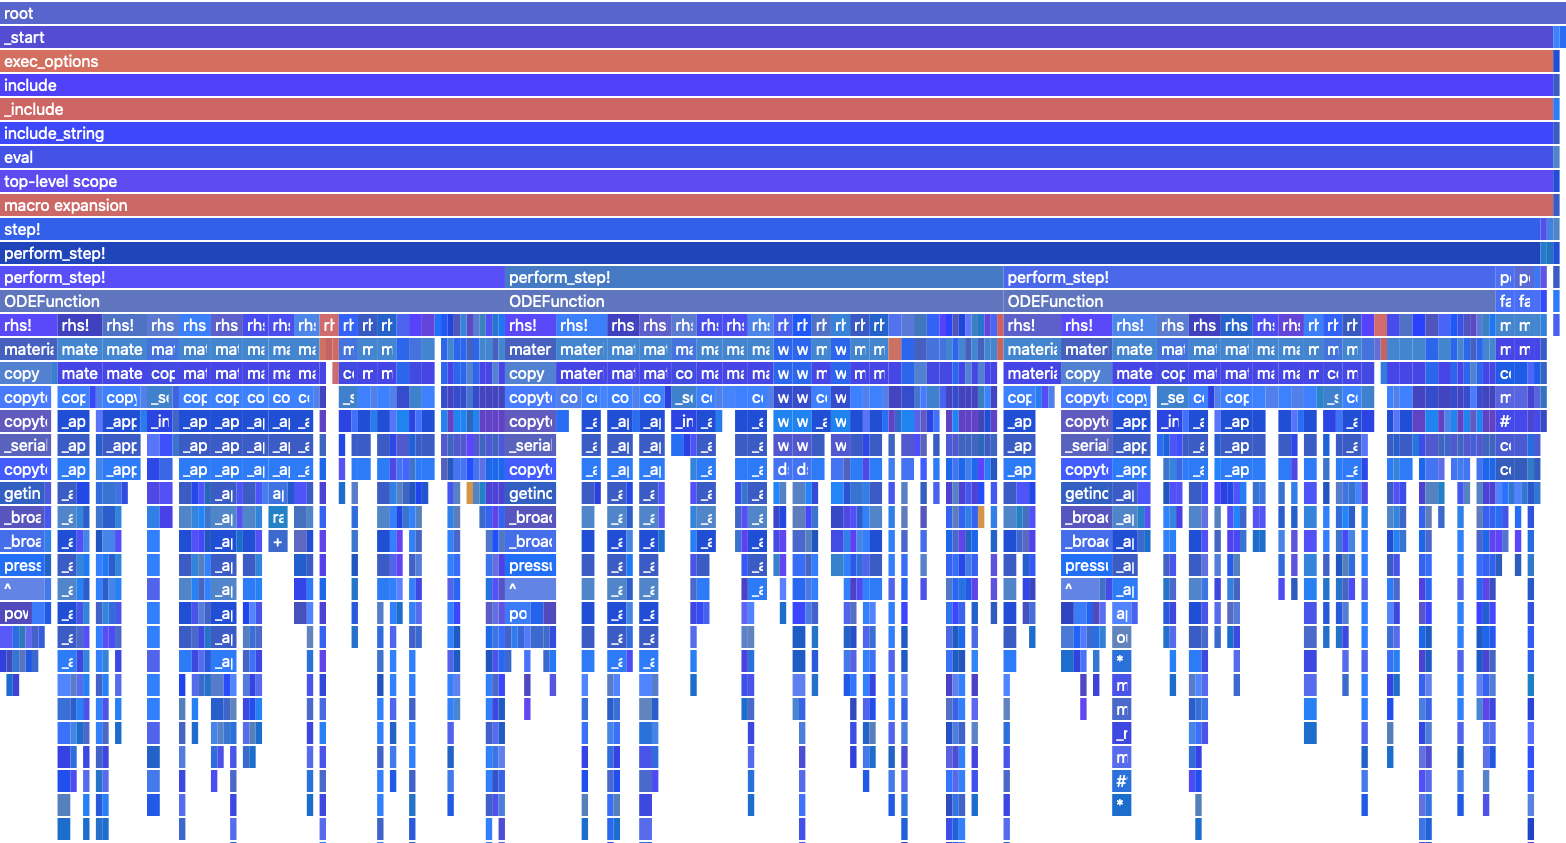
- each row along the y-axis represents a level of backtraces. In this case the lowermost level is at the top, and the top level represents what is directly being run on the CPU. The stacks in each level are sorted alphabetically (not chronologically, like flame charts). The column width is proportional to the presence in samples (related to allocations). The colors are grouped into runtime-dispatch, gc, compilation and default. The intensity is random.
References
- Julia VSCode profiler integration
- Buildkite implementation in ClimaAtmos
- FlameGraphs.jl
- Profile.jl
- jl-profile.js used to format the above flame graph