Getting Started with CTAT Authoring - CMUCTAT/CTAT GitHub Wiki
There are two types of tutors that can be built with CTAT: Example-tracing tutors and Model-tracing tutors. Example-tracing tutors are much easier to build than Model-tracing tutors. What sets CTAT apart from other example-tracing tutor authoring tools is CTAT’s predefined sets of HTML Components. An author has many more options for creating a user interface that “makes thinking visible.” They can be built entirely without programming, namely, through drag-and-drop and programming-by-demonstration.
This page describing the CTAT Authoring Environment for example-tracing has 4 parts:
- Access to the CTAT-Tutorshop server
- CTAT Authoring Workflow overview
- HTML Interface Editor
- Behavior Recorder
You need 2 authoring tools because a tutor has 2 parts:
- The .html file, which is the web page that the student will see. You can create the .html file by either of these methods:
- Use the online HTML Editor available through TutorShop (http://school.tutorshop.web.cmu.edu/)
- Writing your own HTML with a text editor (Sublime is popular and free). For student interactions, you use instances of the CTAT HTML Components.
- A problem-specific .brd file, which contains the tutor's intelligence--the knowledge needed to coach the student through the activity (which is mostly knowledge about how to solve the problem, with some tutoring knowledge sprinkled in).
Access to the CTAT-Tutorshop server
In order to start creating tutors on TutorShop, you will need a "content developer" account. If you do not have an account, you can request one (If you are taking this as part of the CMU course, you will be provided with an account on the first day of lecture):
- Open the TutorShop website.
- Click on the Contact Us button.
- In the contact form, choose "I'd like a developer account" for the Message Type.
- Fill out the remaining fields as appropriate. In the Message field, be sure to provide information describing your intended use of TutorShop.
A single .html file can serve many isomorphic problem instances, each of which has its own .brd file. E.g., a single file fractionAddition.html could serve problem instances 1/4+1/6, 3/10+7/8, 2/3+1/6, etc: all these problem instances have similar steps but differ by the numeric values used.
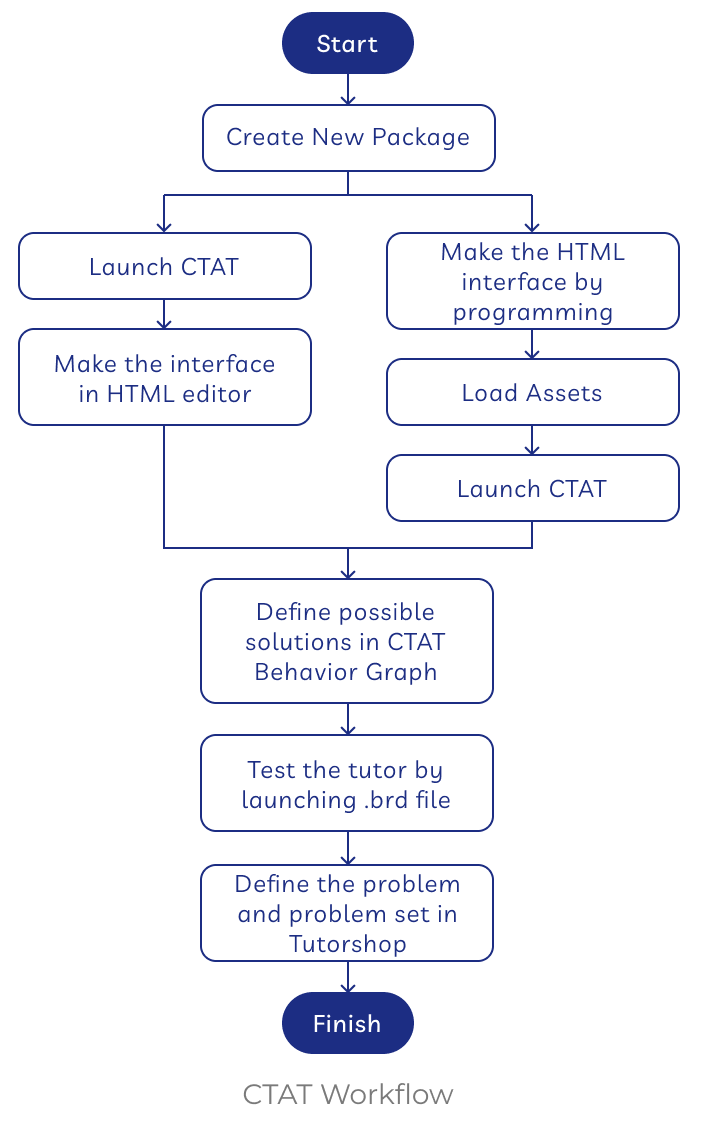
CTAT Authoring Workflow
Before we start reading about various CTAT functionality, let's take a look at the overview of the authoring process here:
- Login to TutorShop
- Select Packages > New Package (or use an existing package)
- To run an existing tutor in the CTAT authoring tools, see Running a Tutor in CTAT
- Enter the package name, click Create Note: Name becomes folder name
- On the package's Assets page, click Edit Assets Opens in the new browser tab
- For a demonstration, see Overview.mp4 Consider slowing playback for clarity
- To create a student interface, the web page that the student will see, right-click your package name in the file list and choose Create New Interface
- Name the new '.html' file and press OK to create it, then find it in the file tree and double-click on its name to invoke the HTML Editor
- Assemble the components you want by dragging them from the palette onto the canvas and click the diskette button in the editor to save your work
- Name each CTAT component in its ID attribute to a name that will remind you of its purpose e.g., in an addition tutor, the first number might be named "addend1"
- When you have several components on your interface, save it and start your first behavior graph. For a demonstration, refer again to Overview.mp4
- Right-click on your package name in the file tree, choose Create New Graph
- Name the new '.brd' file and press OK to create it, then find it in the file tree, right-click, and choose Launch with .html from the context menu; from the 2nd menu, choose your '.html' file
- To start, change the authoring mode at the top of the graph display to Set Initial Values and enter the given values on the student interface; press Enter or Tab after each entry. You should see a link added to the graph for each step.
- Then change the authoring mode to Demonstrate and enter a solution on the student interface. You should see a link added to the graph for each step.
- To add another solution, double-click on node 1 in the graph and enter the new steps.
- To test your tutor so far, change the authoring mode to Test Tutor, double-click on node 1 in the graph, and try your different solutions
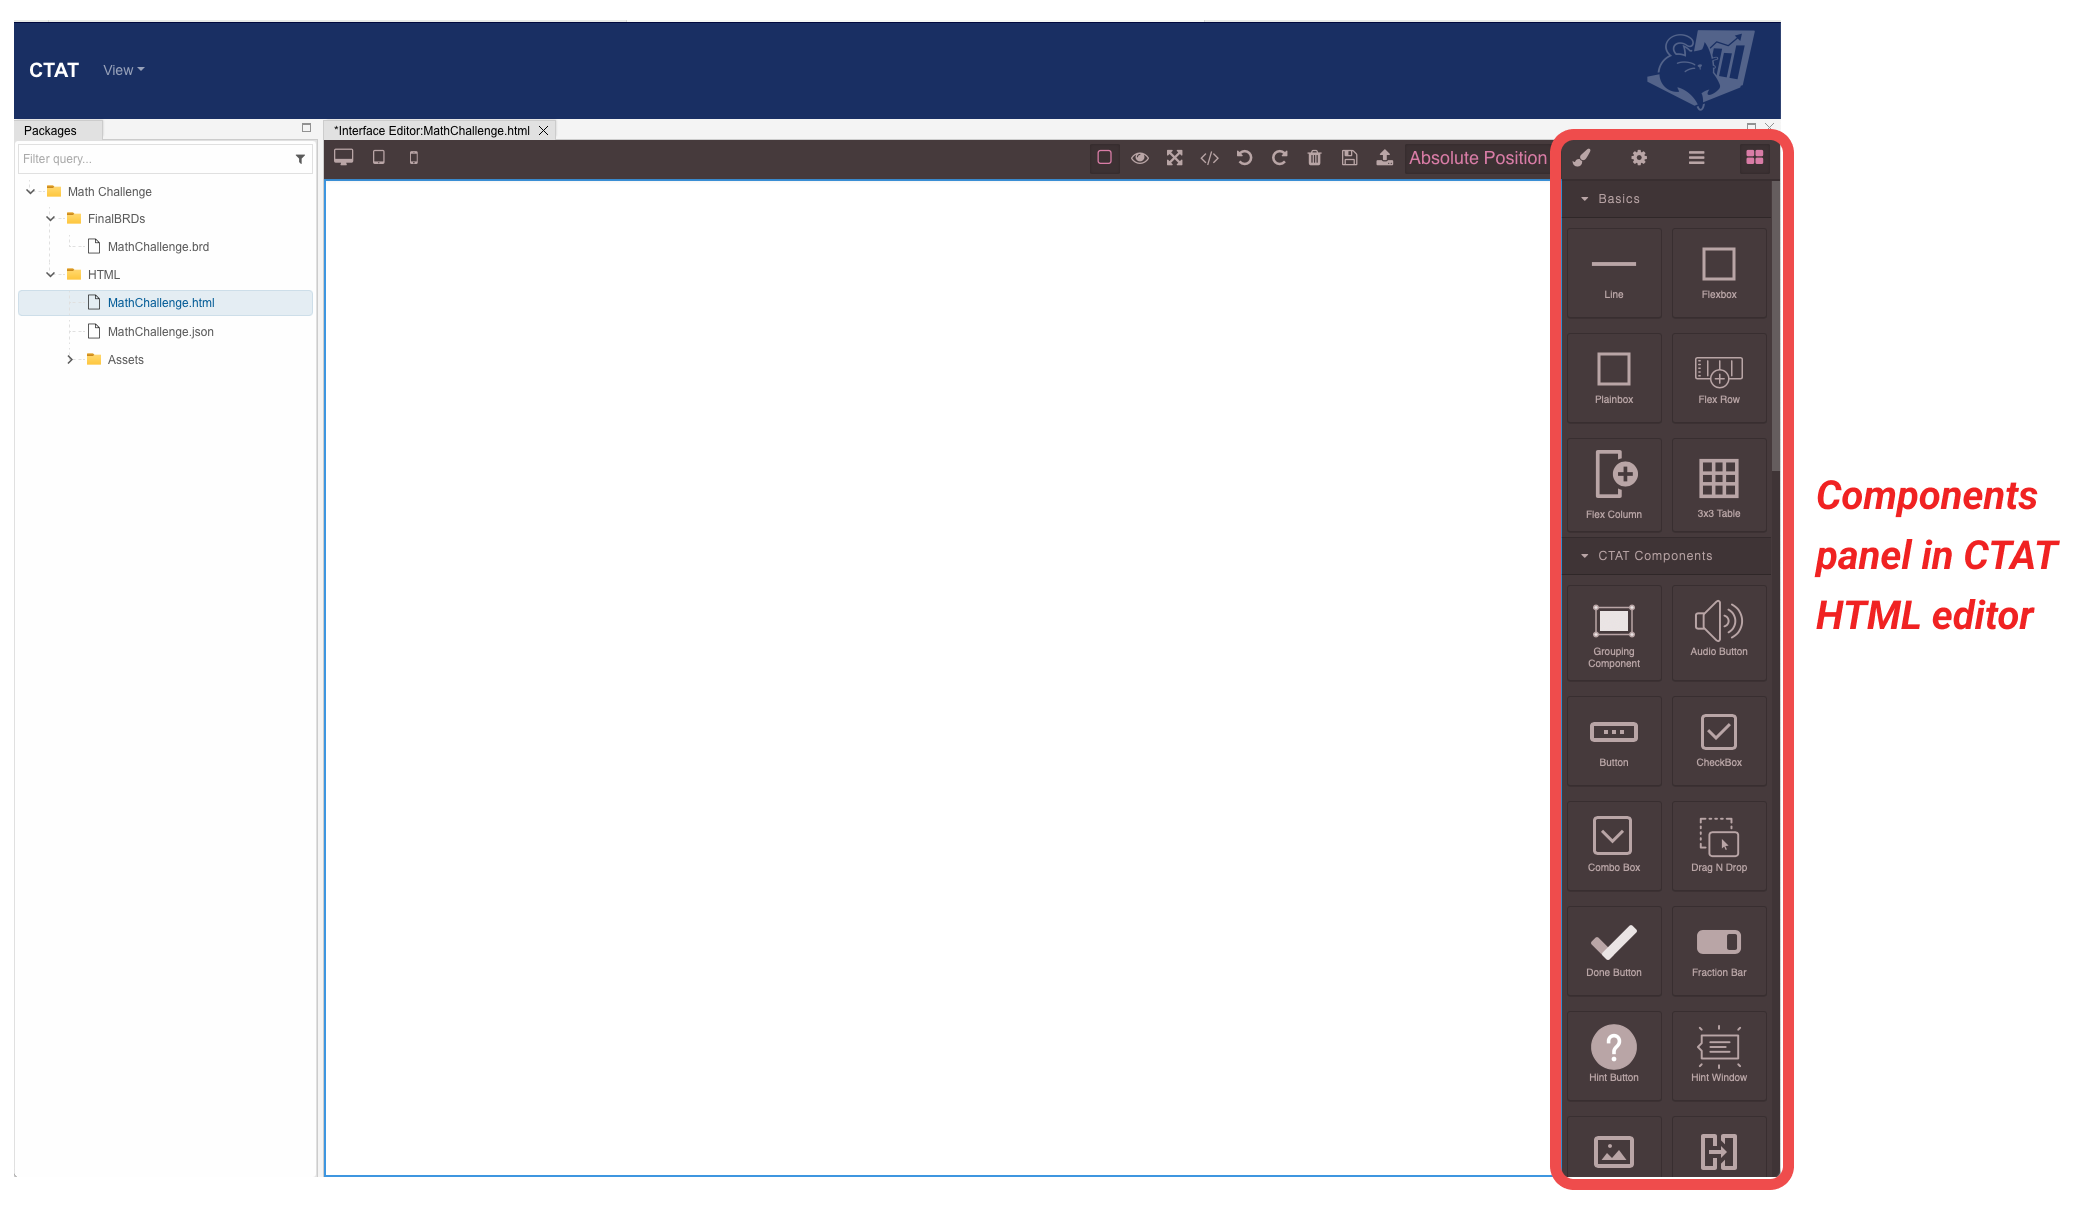
HTML Interface Editor
A student user interface (a .html file) can be created using drag-and-drop actions.
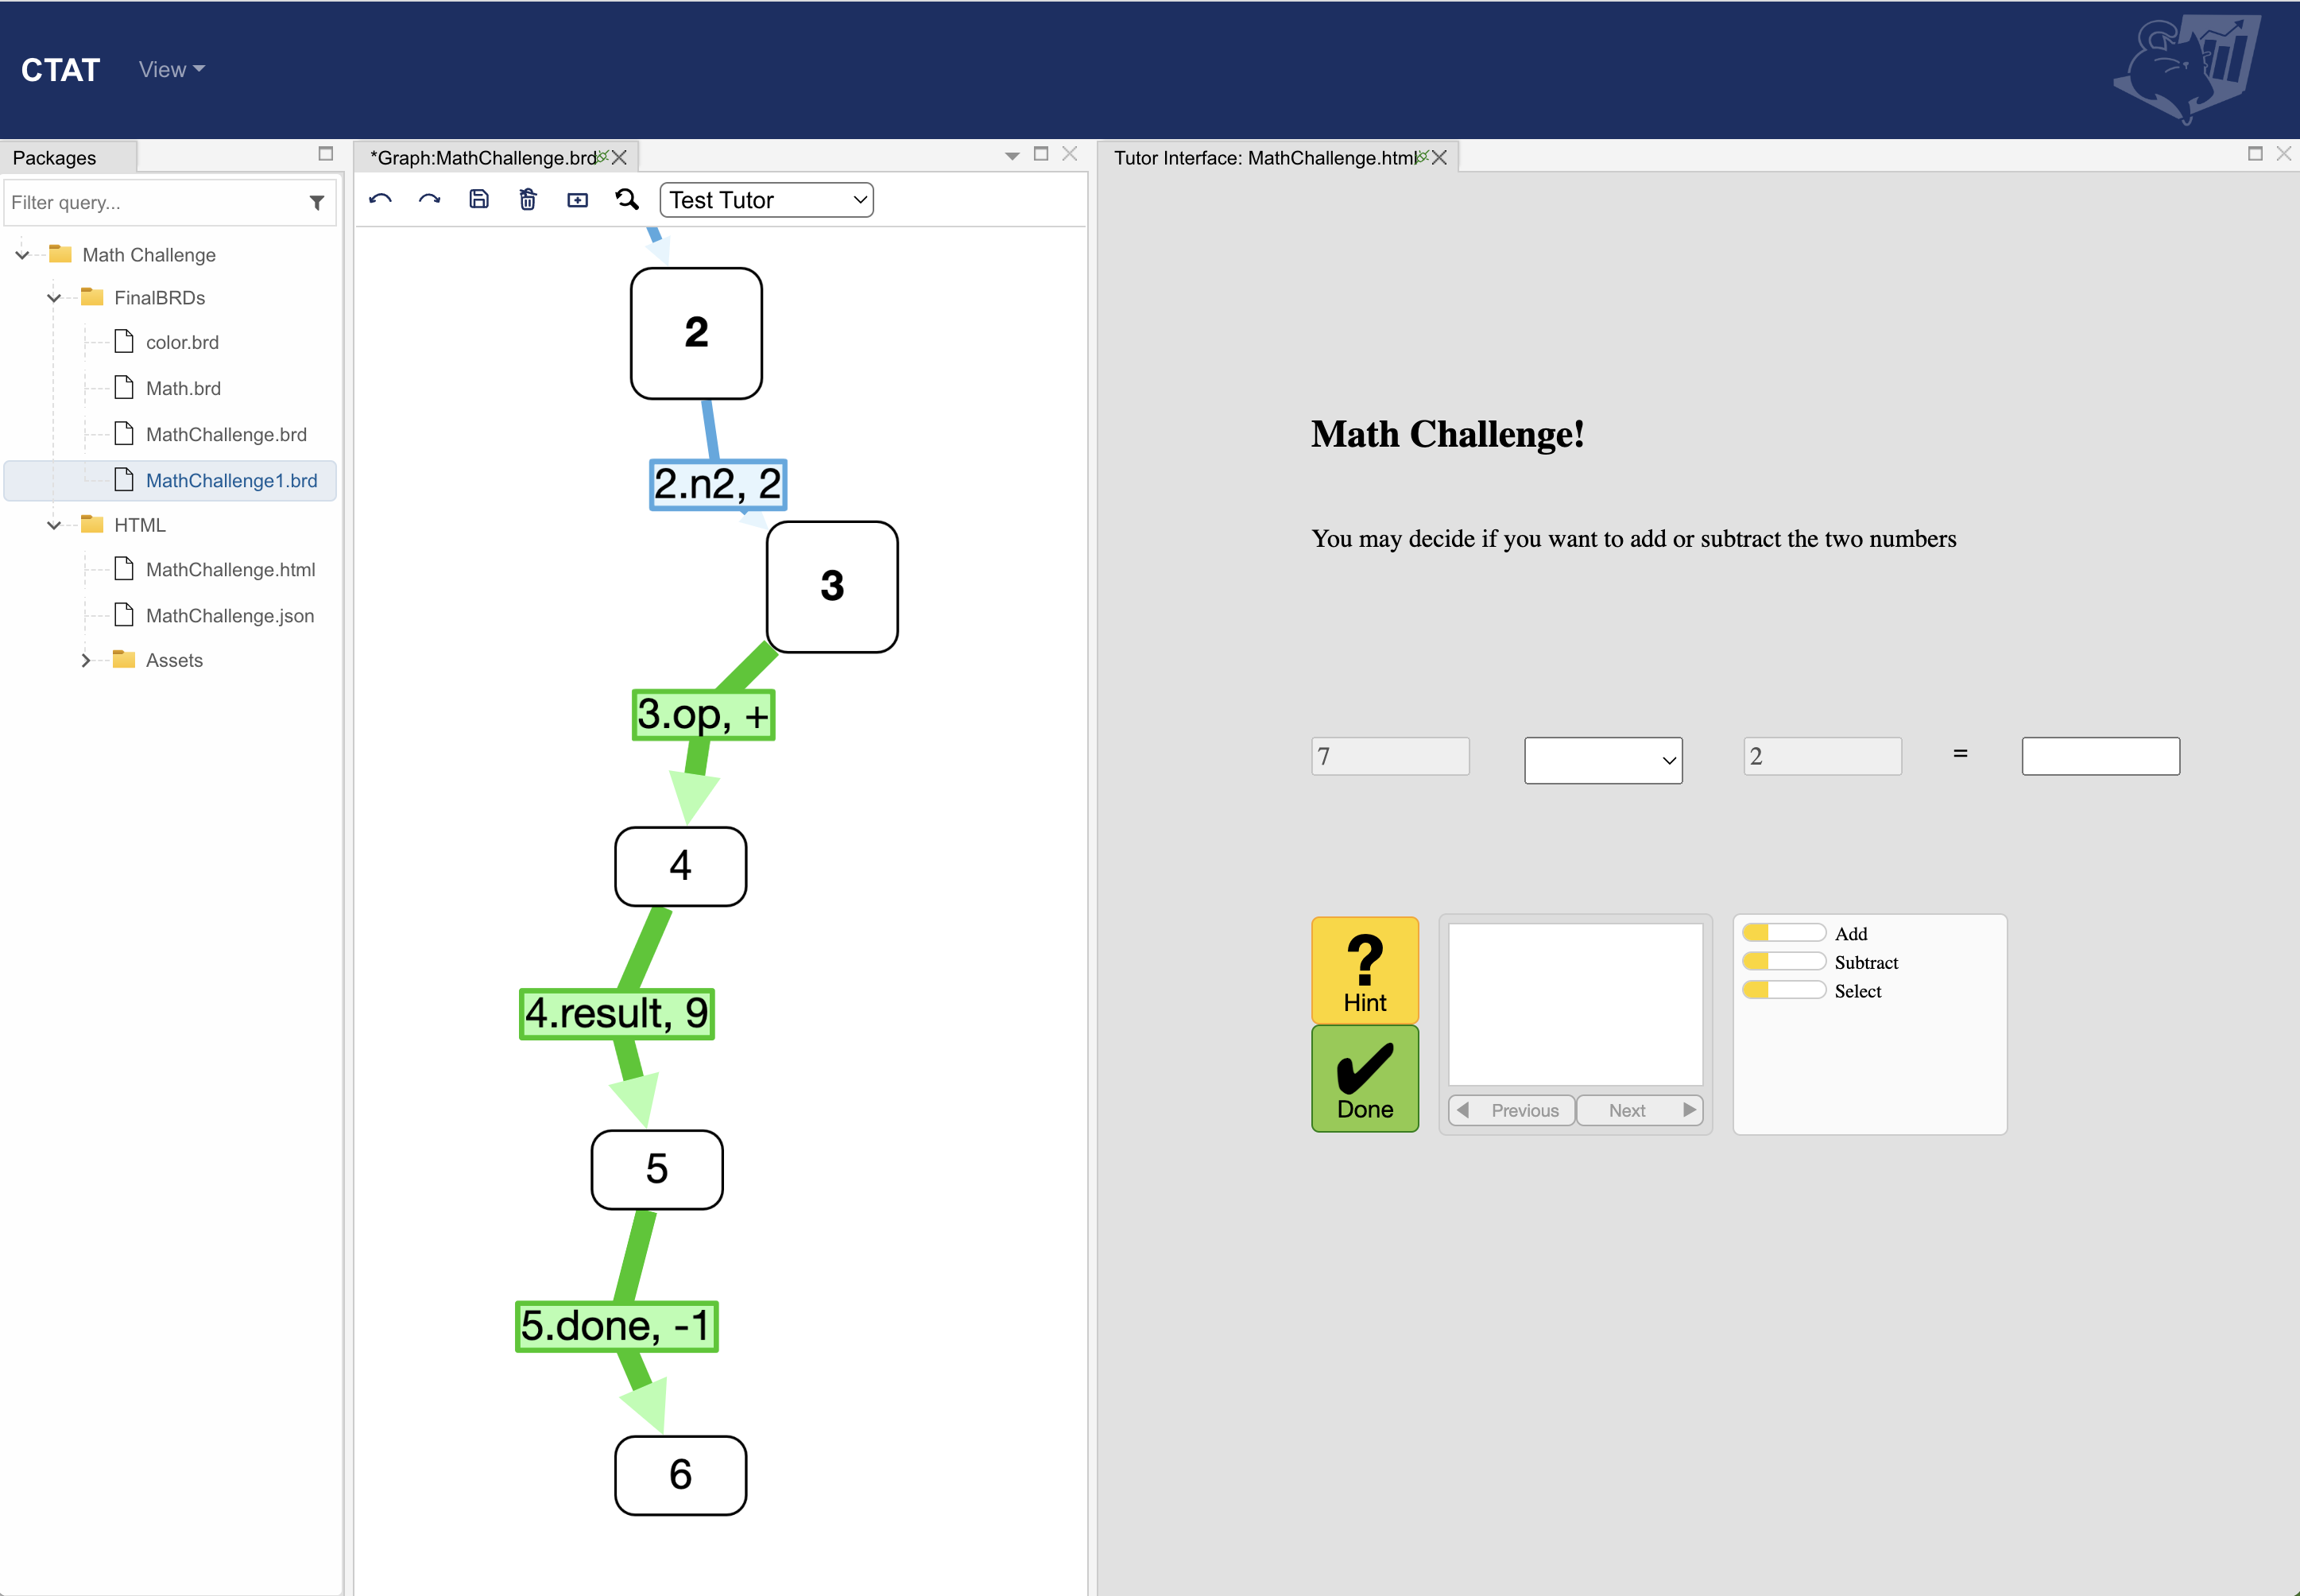
Behavior Recorder
A behavior graph (.brd) file can be built by demonstrating tutor behavior in the user interface connected with CTAT.
A behavior graph is a directed, acyclic graph that represents acceptable ways of solving a problem. The links in the graph represent problem-solving actions, and the nodes represent problem-solving states. A behavior graph may contain multiple paths, corresponding to different ways of solving a problem. It may also contain links that represent incorrect behavior, marked as such by the author who created the graph.
 You can adjust the screen layout in whichever format you prefer, let's take a look at how to do it here: How to adjust screen layout.mp4