Interactive Manager and Preview Manager - Black-Lights/planetscope-py GitHub Wiki
Interactive Manager and Preview Manager
![]()
Simple, user-friendly interactive tools for satellite imagery analysis
Table of Contents
- Overview
- Quick Start Guide
- Interactive Manager
- Preview Manager
- Analysis Functions
- GeoPackage Export
- Integration Workflows
- Troubleshooting
Overview
PlanetScope-py provides simple, user-friendly interactive visualization tools that make satellite imagery analysis accessible to everyone:
- Interactive Manager: Select regions of interest (ROI) by drawing on maps - no need to manually code coordinates
- Preview Manager: See actual Planet satellite imagery before analysis - preview what you're working with
- Analysis Functions: Complete spatial and temporal analysis with quality filtering
- GeoPackage Export: Professional GIS-ready export with comprehensive metadata

Why use these tools?
- Visual ROI Selection: Draw polygons on maps instead of coding coordinates
- Imagery Preview: See actual satellite data before downloading or analysis
- Quality Filtering: Apply cloud cover filters and see results instantly
- Professional Output: GeoPackage files ready for QGIS, ArcGIS, and other GIS tools
- Jupyter Integration: Everything works seamlessly in notebooks
Quick Start Guide
1. Interactive ROI Selection
from planetscope_py import jupyter_roi_selector

# Create interactive map for drawing ROI
map_obj = jupyter_roi_selector("milan")
map_obj  # Draw your polygon and export as 'roi_selection.geojson'
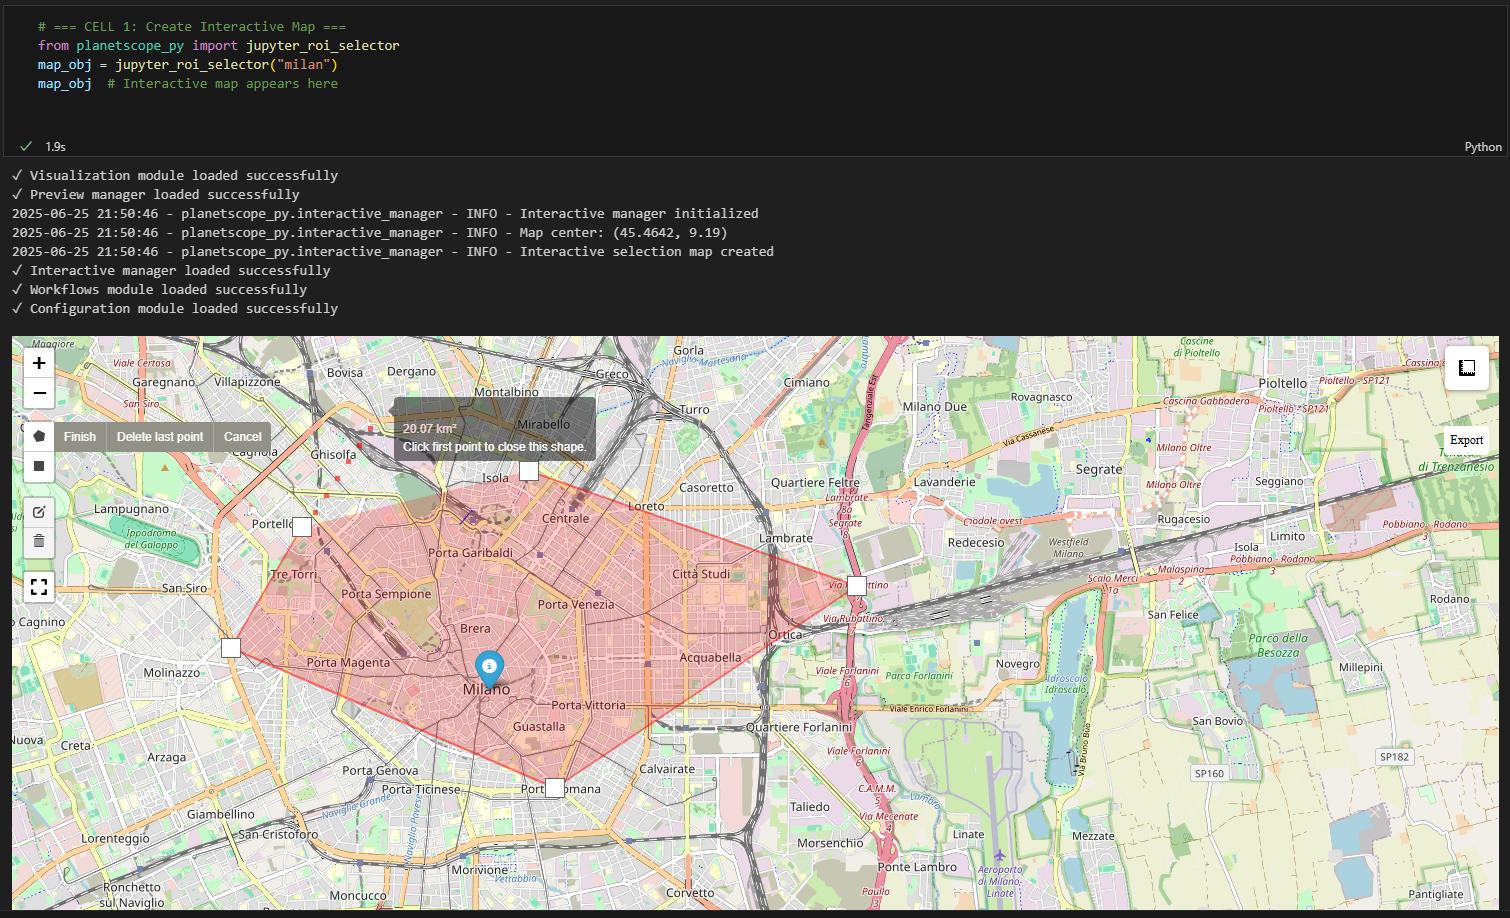
Draw your region of interest directly on the interactive map. Use the polygon or rectangle tools to select your area. Click the export button to save as 'roi_selection.geojson' file.
2. Preview Satellite Imagery
from planetscope_py import quick_preview_with_shapely, PlanetScopeQuery, jupyter_get_shapely_roi

roi_polygon = jupyter_get_shapely_roi("roi_selection.geojson")
query = PlanetScopeQuery()
preview_map = quick_preview_with_shapely(
    query, roi_polygon, "2025-01-01/2025-01-31",
    max_scenes=20, cloud_cover_max=0.0
)
preview_map
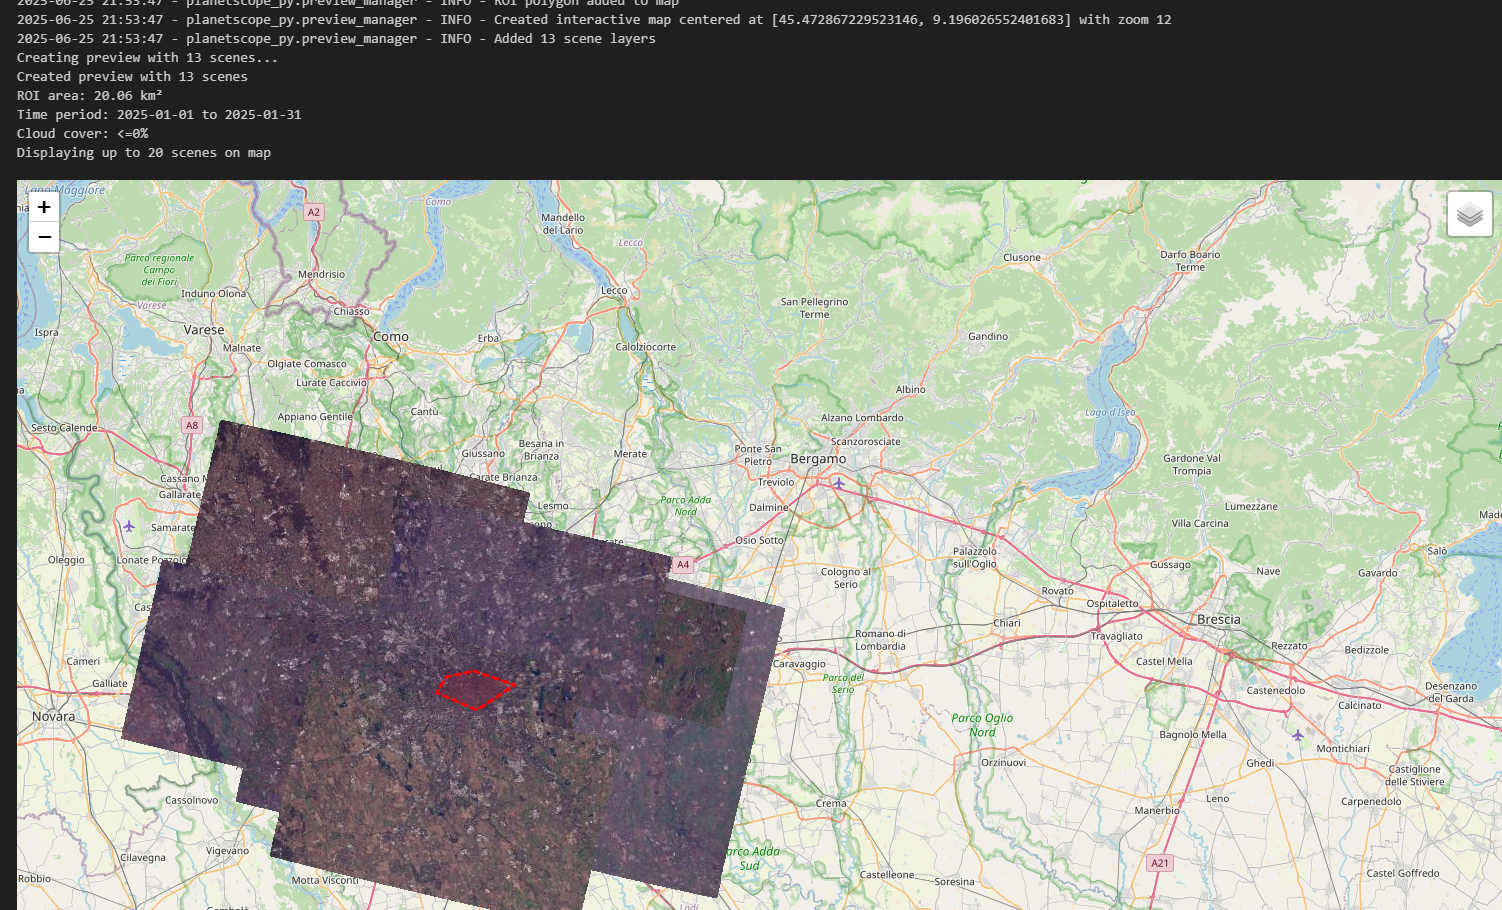
Preview actual Planet satellite imagery before running analysis. This shows real satellite scenes overlaid on your ROI with quality filtering applied.
3. Run Analysis
from planetscope_py import jupyter_quick_analysis

result = jupyter_quick_analysis(
    "roi_selection.geojson", "2025-01-01/2025-01-31", "spatial"
)
print(f"Found {result['scenes_found']} scenes")
Interactive Manager
Core Functions
1. jupyter_roi_selector(location, instructions=True)
Creates Jupyter-optimized ROI selector for easy drawing.
Parameters:
location(str): Preset location ("milan", "rome", "london", "sf", "paris", "berlin", "tokyo", "sydney")instructions(bool, default=True): Whether to show instruction popups
Returns: Folium map object for drawing ROI
from planetscope_py import jupyter_roi_selector

# Quick maps for common locations
milan_map = jupyter_roi_selector("milan")
london_map = jupyter_roi_selector("london", instructions=False)
2. jupyter_get_shapely_roi(geojson_file)
Converts exported GeoJSON to Shapely polygon.
Parameters:
geojson_file(str): Path to GeoJSON file exported from interactive map
Returns: Shapely Polygon object
from planetscope_py import jupyter_get_shapely_roi

roi_polygon = jupyter_get_shapely_roi("roi_selection.geojson")
print(f"ROI area: {roi_polygon.area:.6f} square degrees")
3. create_shapely_polygon_from_coords(coordinates)
Creates Shapely polygon from coordinate list.
Parameters:
coordinates(list): List of [lon, lat] coordinate pairs
Returns: Shapely Polygon object
coords = [9.1, 45.4], [9.2, 45.4], [9.2, 45.5], [9.1, 45.5], [9.1, 45.4](/Black-Lights/planetscope-py/wiki/9.1,-45.4],-[9.2,-45.4],-[9.2,-45.5],-[9.1,-45.5],-[9.1,-45.4)
polygon = create_shapely_polygon_from_coords(coords)
4. export_shapely_objects(polygons, output_dir="./roi_exports")
Exports Shapely polygons to multiple formats.
Parameters:
polygons(list): List of Shapely polygon objectsoutput_dir(str, default="./roi_exports"): Output directory
Returns: Dictionary with format names and file paths/objects
exported = export_shapely_objects([roi_polygon])
# Returns: {'geojson': 'path/to/roi.geojson', 'shapefile': 'path/to/roi.shp',
#          'shapely_polygons': [polygon_objects], 'wkt': 'path/to/roi.wkt'}
Preview Manager
Core Functions
1. quick_preview_with_shapely(query, roi_polygon, time_period, max_scenes=10, **kwargs)
Quick preview with quality filtering for actual satellite imagery.
Parameters:
query: PlanetScopeQuery instanceroi_polygon: Shapely polygon objecttime_period(str): Time period as "YYYY-MM-DD/YYYY-MM-DD"max_scenes(int, default=10): Maximum scenes to display on map
Quality Filter Options (**kwargs):
cloud_cover_max(float, default=0.2): Maximum cloud cover (0.0-1.0)sun_elevation_min(float): Minimum sun elevation in degreesground_control(bool): Require ground control pointsitem_types(list, default=["PSScene"]): Planet item types to search
Returns: Folium map with satellite imagery overlays
from planetscope_py import quick_preview_with_shapely, PlanetScopeQuery

query = PlanetScopeQuery()
preview_map = quick_preview_with_shapely(
    query, roi_polygon, "2025-01-01/2025-01-31",
    max_scenes=20,
    cloud_cover_max=0.0,        # Zero cloud cover
    sun_elevation_min=40,       # Good lighting
)
2. create_scene_preview_map(roi, time_period="last_month", max_scenes=10, **kwargs)
High-level preview function accepting various ROI formats.
Parameters:
roi: ROI as Shapely polygon, coordinate list, GeoJSON dict, or file pathtime_period(str, default="last_month"): Time period specification- "last_month": Previous 30 days
- "last_3_months": Previous 90 days
- "YYYY-MM-DD/YYYY-MM-DD": Custom date range
max_scenes(int, default=10): Maximum scenes to display
Additional Options (**kwargs):
cloud_cover_max(float, default=0.2): Cloud cover thresholdshow_scene_info(bool, default=True): Show scene popups
Returns: Folium map with preview
# From file
preview_map = create_scene_preview_map(
    "roi_selection.geojson", "last_month", max_scenes=15
)

# From Shapely polygon with strict quality
preview_map = create_scene_preview_map(
    roi_polygon, "2025-01-01/2025-01-31",
    cloud_cover_max=0.0, sun_elevation_min=45
)
Analysis Functions
jupyter_quick_analysis(geojson_file, time_period, analysis_type)
Streamlined analysis for Jupyter workflows with three analysis types.
Parameters:
geojson_file(str): Path to GeoJSON file with ROItime_period(str): Time period as "YYYY-MM-DD/YYYY-MM-DD" or shortcutsanalysis_type(str): Type of analysis to perform
Analysis Type Options:
"spatial": Spatial density analysis - calculates scene density per grid cell"temporal": Temporal pattern analysis - analyzes acquisition timing patterns"both": Combined spatial and temporal analysis
Time Period Shortcuts:
"last_month": Previous 30 days"last_3_months": Previous 90 days (recommended for temporal analysis)
Default Settings:
- Spatial resolution: 30 meters
- Cloud cover max: 20%
- Optimization: Auto (FAST for large areas, ACCURATE for smaller areas)
- ROI clipping: Enabled
- Visualizations: Created automatically
Returns: Dictionary with analysis results, statistics, and visualizations
from planetscope_py import jupyter_quick_analysis

# Spatial analysis - analyzes scene density patterns
spatial_result = jupyter_quick_analysis(
    "roi_selection.geojson", "2025-01-01/2025-01-31", "spatial"
)
print(f"Spatial: {spatial_result['scenes_found']} scenes")
print(f"Mean density: {spatial_result['density_result'].stats['mean']:.1f}")

# Temporal analysis - analyzes timing patterns (3-month period recommended)
temporal_result = jupyter_quick_analysis(
    "roi_selection.geojson", "2025-01-01/2025-03-31", "temporal"
)
print(f"Temporal: {temporal_result['scenes_found']} scenes")
print(f"Mean coverage days: {temporal_result['temporal_result'].temporal_stats['mean_coverage_days']:.1f}")

# Both analyses combined
both_results = jupyter_quick_analysis(
    "roi_selection.geojson", "2025-01-01/2025-03-31", "both"
)
print(f"Spatial: {both_results['spatial_analysis']['scenes_found']} scenes")
print(f"Temporal: {both_results['temporal_analysis']['scenes_found']} scenes")
What Each Analysis Does:
Spatial Analysis: Creates a grid over your ROI and calculates how many satellite scenes cover each grid cell. This helps identify well-covered areas versus poorly-covered areas in your region.
Temporal Analysis: Analyzes when satellite scenes were acquired to understand acquisition patterns, timing gaps, and coverage frequency over time. Shows how often satellites pass over your area.
Both: Combines spatial and temporal analysis for comprehensive understanding of satellite coverage patterns both spatially and temporally.
GeoPackage Export
One-Liner Functions
1. create_scene_geopackage(roi, time_period="last_month", output_path=None, clip_to_roi=True, **kwargs)
One-line function to create professional GeoPackage with scene footprints.
Parameters:
roi: ROI as Shapely polygon, coordinate list, or GeoJSON dicttime_period(str, default="last_month"): Time period specificationoutput_path(str, optional): Output path (auto-generated if None)clip_to_roi(bool, default=True): Whether to clip scene footprints to ROI
Schema Options (**kwargs):
schema(str, default="standard"): Attribute schema level- "minimal": Basic scene info (id, date, cloud cover, area)
- "standard": Standard metadata (adds quality, geometry, sun angles)
- "comprehensive": Full metadata (all available Planet attributes)
Quality Filter Options (**kwargs):
cloud_cover_max(float, default=0.3): Maximum cloud coversun_elevation_min(float): Minimum sun elevationquality_category(str): Required quality categoryitem_types(list): Planet item types
Returns: Path to created GeoPackage file
from planetscope_py import create_scene_geopackage

# Basic usage with standard schema
gpkg_path = create_scene_geopackage(roi_polygon, "2025-01-01/2025-01-31")

# With comprehensive metadata and quality filters
gpkg_path = create_scene_geopackage(
    roi_polygon, "last_month", "milan_analysis.gpkg",
    schema="comprehensive",
    cloud_cover_max=0.1,
    sun_elevation_min=30
)
What GeoPackage Export Does:
Creates a professional GIS file containing satellite scene footprints with comprehensive metadata. The file can be opened directly in QGIS, ArcGIS, or other GIS software. Each scene footprint includes quality metrics, acquisition dates, cloud cover, and geometric properties.
The exported GeoPackage contains vector polygons representing each satellite scene's footprint. Attributes include scene ID, acquisition date, cloud cover percentage, quality metrics, and geometry calculations. This allows for professional analysis in any GIS software.
2. quick_geopackage_export(roi, time_period="last_month", **kwargs)
Enhanced one-liner with all Planet API parameters.
Default Settings:
- Schema: "standard"
- Cloud cover max: 30%
- Item types: ["PSScene"]
- Clip to ROI: True
- Output: Auto-generated path
from planetscope_py import quick_geopackage_export

# Basic export
gpkg_path = quick_geopackage_export(milan_polygon, "2025-01-01/2025-01-31")

# With all quality filters
gpkg_path = quick_geopackage_export(
    roi, "last_month",
    cloud_cover_max=0.2,
    sun_elevation_min=30,
    ground_control=True,
    quality_category="standard",
    schema="comprehensive"
)
This function automatically searches for Planet scenes, applies quality filters, and exports the results to a GeoPackage file. The file contains scene footprints clipped to your ROI with comprehensive metadata attributes.
Integration Workflows
Complete Jupyter Workflow

This diagram shows the complete workflow from ROI selection to final analysis and export.
# Cell 1: Interactive ROI Selection
from planetscope_py import jupyter_roi_selector
roi_map = jupyter_roi_selector("milan")
roi_map

# Cell 2: Load ROI and Preview
from planetscope_py import jupyter_get_shapely_roi, quick_preview_with_shapely, PlanetScopeQuery

roi_polygon = jupyter_get_shapely_roi("roi_selection.geojson")
query = PlanetScopeQuery()

preview_map = quick_preview_with_shapely(
    query, roi_polygon, "2025-01-01/2025-01-31",
    max_scenes=15, cloud_cover_max=0.0
)
preview_map

# Cell 3: Analysis
from planetscope_py import jupyter_quick_analysis

result = jupyter_quick_analysis(
    "roi_selection.geojson", "2025-01-01/2025-01-31", "both"
)

print(f"Spatial: {result['spatial_analysis']['scenes_found']} scenes")
print(f"Temporal: {result['temporal_analysis']['scenes_found']} scenes")

# Cell 4: Export to GeoPackage
from planetscope_py import create_scene_geopackage

gpkg_path = create_scene_geopackage(
    roi_polygon, "2025-01-01/2025-01-31",
    schema="comprehensive"
)
print(f"Created GeoPackage: {gpkg_path}")
This complete workflow takes you from drawing an ROI to having professional analysis results and GIS-ready exports.
Quality-Focused Workflow

Apply consistent quality filters across all workflow steps for the best results.
# Consistent quality parameters
quality_params = {
    'cloud_cover_max': 0.0,
    'sun_elevation_min': 40,
    'quality_category': 'standard'
}

# 1. Preview with strict quality
preview_map = quick_preview_with_shapely(
    query, roi_polygon, "2025-01-01/2025-01-31", **quality_params
)

# 2. Analysis with same quality filters
result = jupyter_quick_analysis(
    "roi_selection.geojson", "2025-01-01/2025-01-31", "spatial"
)

# 3. GeoPackage export with quality filters
gpkg_path = create_scene_geopackage(
    roi_polygon, "2025-01-01/2025-01-31", **quality_params
)
Using consistent quality parameters ensures all steps in your workflow use the same high-quality satellite scenes.
Troubleshooting
Common Issues and Solutions
Import Errors
# Problem: ImportError for functions
# Solution: Update to latest version
pip install --upgrade planetscope-py

# Check imports
from planetscope_py import quick_preview_with_shapely  # Should work
Cloud Filtering Issues
# Problem: Cloudy scenes still appear
# Solution: Use stricter filtering
preview_map = quick_preview_with_shapely(
    query, roi_polygon, "2025-01-01/2025-01-31",
    cloud_cover_max=0.0  # Zero cloud cover only
)
Performance Tips
- Limit scene count: Use
max_scenes=10-20for faster preview loading - Strict cloud filtering: Use
cloud_cover_max=0.0for best quality - Optimize analysis: For large areas, temporal analysis automatically uses FAST optimization
- Use appropriate time periods:
- Spatial analysis: 1 month periods work well
- Temporal analysis: 3+ month periods recommended
Function Availability Status
All functions are available in the current version. If you encounter import errors:
- Update the package:
pip install --upgrade planetscope-py - Check dependencies:
pip install folium shapely geopandas - Restart your Jupyter kernel
PlanetScope-py Interactive & Preview Manager - Making satellite imagery analysis simple and visual for everyone.