Monitoring - Azure/AzOps GitHub Wiki
In this Guide
Introduction
The AzOps module generates various logs and metrics to console during execution. The verbosity level is controlled by the numeric value of Message.Info.Maximum in settings.json. Lower values, like 1, indicate minimal information, while 9 indicates the highest verbosity (read more about the different levels).
Note: The default verbosity level is
3, and increasing it may negatively affect runtime performance.
Troubleshooting AzOps
During normal operations, the default verbosity level is sufficient. However, when troubleshooting, it is advisable to increase the verbosity to at least 5 or 8. Going up to 9 makes the module very noisy (read more).
Operationalize monitoring and logging of AzOps
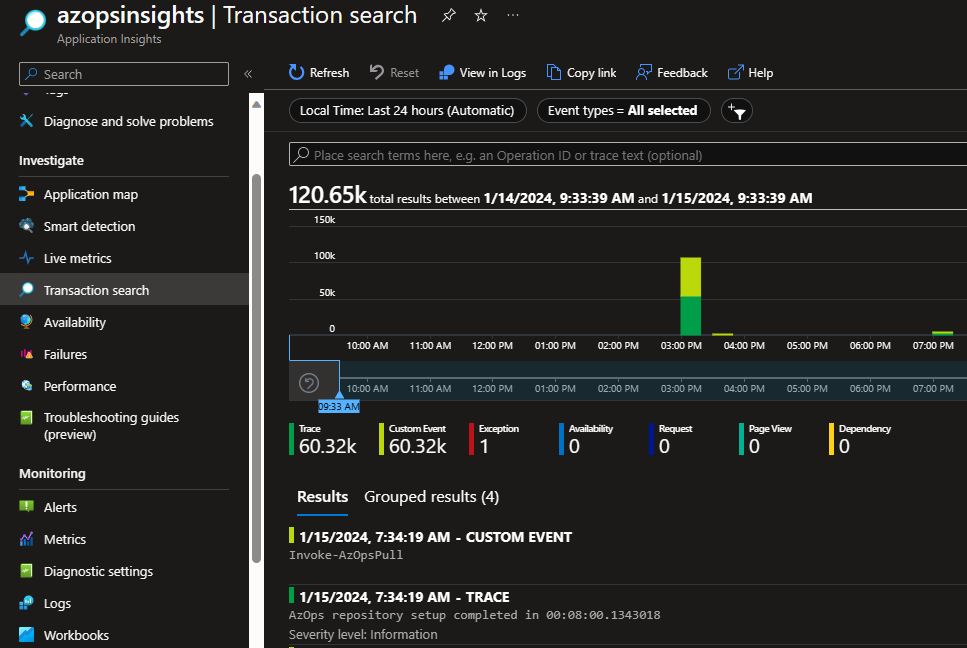
Monitoring and logging takes a leap forward with the capability for AzOps to seamlessly transmit logs to Azure Monitor Application Insights. This integration enhances near real-time visibility, analysis, and optimization, contributing to a more responsive and efficient Azure operational environment.

AzOps uses TrackTrace to create a "breadcrumb trail" in Application Insights. Warnings and errors are emitted as TrackException for diagnosis, and each message generates a TrackEvent. Metrics are emitted as TrackMetric, such as AzOpsPush Time and AzOpsPull Time in seconds.
Note: This is useful for tracking performance, key metrics, and exceptions over time. It is particularly helpful when running the module with several parallel threads (
Core.ThrottleLimit>1), as console output may not work well in parallel. Emitting information to Azure Monitor Application Insights can overcome this without adjustingCore.ThrottleLimit.
Enable Application Insights Monitoring
-
Add a secret named
APPLICATIONINSIGHTS_CONNECTIONSTRING(in GitHub or Azure Pipelines) and enter the connection string for your Application Insights resource (find your connection string).Note: Create the
APPLICATIONINSIGHTS_CONNECTIONSTRINGsecret in the same location where you already haveARM_TENANT_ID. If you are using Azure Pipelines, remember to set the variable type tosecret.Note: AzOps utilizes the connection string as a secret to authenticate. This requires that local authentication is enabled on the Application Insights resource (due to the high performance impact of Application Insights Microsoft Entra ID-based authentication).
Note: AzOps emits each log event immediately as it happens to ensure messages are not lost. This means each event generates a service call to Application Insights that needs to be authenticated. No batching or schedule is used.
-
Set the
Core.ApplicationInsightsvalue insettings.jsontotrue. AzOps will emit logs to both the console and the designated Azure Monitor Application Insights.
Please Note: For this to work with GitHub in the manner intended (applicable to implementations created prior to AzOps release v2.5.0)
Ensure the Credentials section is up-to-date and exists in your pull.yml, push.yml, redeploy.yml, validate.yml files.
env:
  #
  # Credentials
  #

  APPLICATIONINSIGHTS_CONNECTIONSTRING: ${{ secrets.APPLICATIONINSIGHTS_CONNECTIONSTRING }}
Create Alert Rules
Once monitoring is enabled, implement two essential alert rules using the powerful capabilities of Azure Monitor alerts.
-
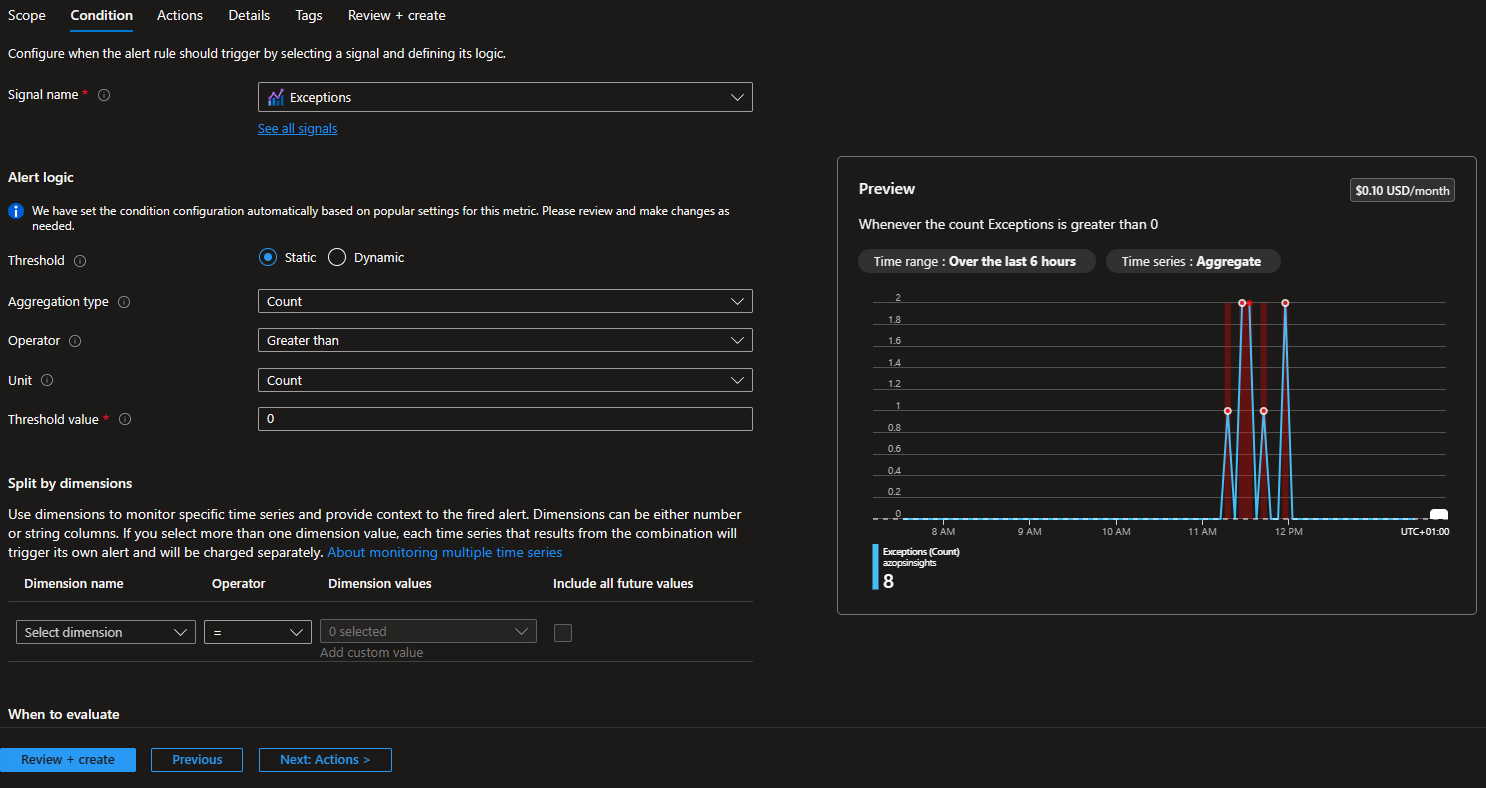
Create a metric alert rule with the condition based on the native
exceptionssignal.- Set a static threshold value of 0 to trigger the alert when the module logs any exception (Warning, Error, Critical).
- Recommended alert detail severity: Warning.

-
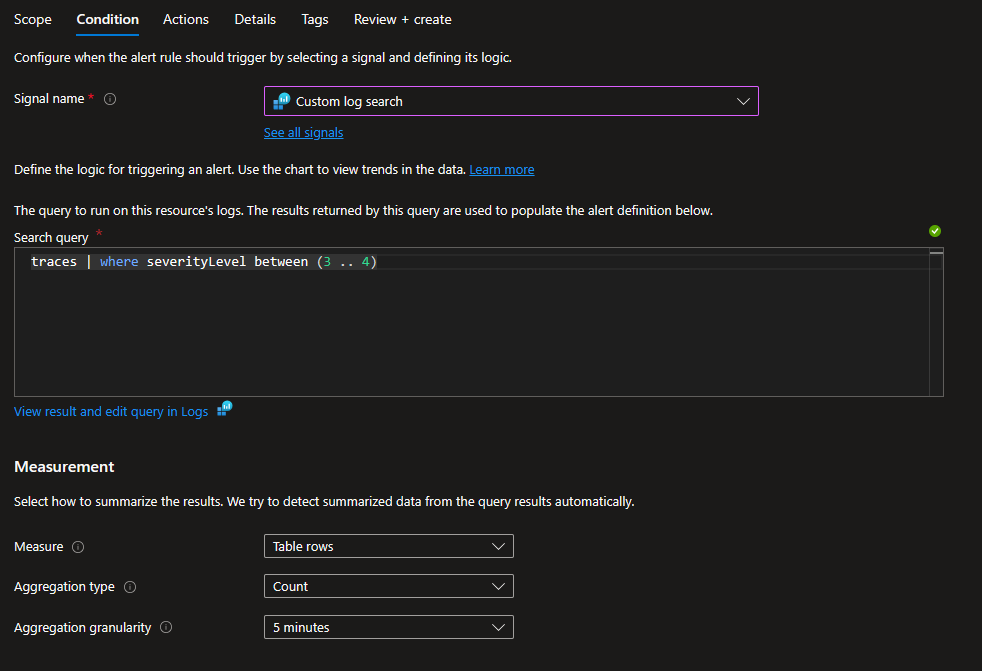
Create a log alert rule with the condition based on the native
Custom log searchsignal.- Use the search query
traces | where severityLevel between (3 .. 4)to trigger the alert for Error or Critical events. - Enhance the alert by splitting dimensions based on the dimension name
messageand ensure to checkinclude all future values. - Recommended alert detail severity: Critical.

- Use the search query