DataClassesSpatialConversions - AtlasOfLivingAustralia/ala-datamob GitHub Wiki
Introduction
2013/14 - i rescued this from the old sites portal, which is behind a closed door - maybe one day i'll revise it to read a little easier
Conversions and blurring
Note: truncating is (potentially) a more robust method for denaturing/blurring locations, as its results are consistent - if a random method is applied, the output result for a given input should be consistent, otherwise potential exists for statistical analysis of the result
see below for a simple truncating algorithm
For conversion between degrees minutes seconds & decimal degrees, see:
DataClassesSpatial?ts=1396308460&updated=DataClassesSpatial#Regarding_co-ordinates_in_degrees_%C2%B0_(arc)minutes_%27_(arc)se
For a primer on the whole topic of geospatial data, see:
ALAhandlingspatiallocationdata.pdf
For psuedo-code to convert + blur
GeospatialConversionPseudoCode.pdf - note: potentially flawed method of blurring referred to in this pdf ...
- if a large number of sensitive records come from one point and are given a different (blurred) location each,
- then statistically, the distribution of blurred locations around the point is of a smaller than expected area -
- this could make it easier to determine the actual point shared by all records
A more complex, better distributed method of choosing random spots on a disc - http://mathworld.wolfram.com/DiskPointPicking.html
A simplified method of denaturing locations can be truncating the number of digits after the decimal point; here's a visual basic algorithm that will truncate lat/long's to 3 decimal places (~100m) -
(fix(LAT_OR_LONG * 1000) / 1000)
(note '^' is a placeholder for previous result)
first, multiply the latitude by 1000 (FIELD * 1000)next, discard anything decimal fix( ^ )finally, return to 3 decimal places ( ^ ) / 1000
in visual-basic's case, the 'fix' function converts a decimal to a whole number, and in the case of negatives, rounds upward toward 0; (this is in contrast to the 'int' function which does the same but rounds downward away from 0)
this method would also work in excel, but you would need to use the 'trunc' function (where a1 is the latitude):
=( trunc( (a1*1000) ) / 1000 )
these will wind up looking like a grid of dots on the map - here is an interesting example of this behaviour... note: if you click on the picture to load this dataset in the spatial portal, you'll need to zoom in on an area of interest
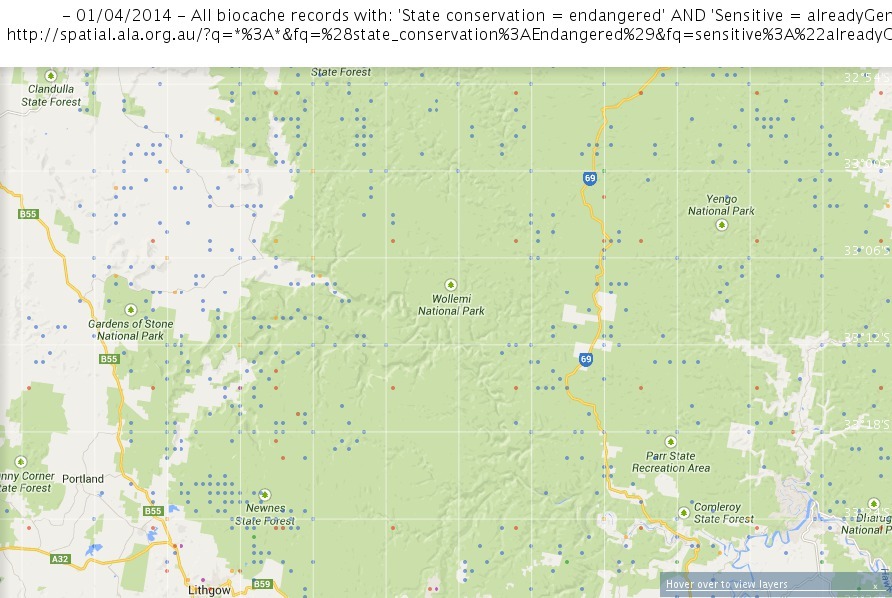 All biocache records with: 'State conservation = endangered' AND 'Sensitive = alreadyGeneralised'
A rough guide to the scale of measurements:
| Measure | Degrees | Decimal degrees | Metres (lat/long) (roughly, equator) | Metres (lat) (roughly, poles) | Metres (long) (roughly, poles) |
|---|---|---|---|---|---|
| 1° | One | 1.00 ° | 111,000 | 111,000 | 85,000 |
| 1’ (arcmin) | 1/60 ° | 0.01666… ° | 1,700 | 1,700 | 1,300 |
| 1” (arcsec) | 1/3600 ° | 0.0002777… ° | 30 | 30 | 22 |
| 0.01° | 1/100 ° | 0.01 ° | 1,000 | 1,000 | 760 |
| 0.001° | 1/1000 ° | 0.001 ° | 100 | 100 | 76 |
Comparison between the different types of measurement - something to note: degrees of latitude are parallel so the distance between each degree remains almost constant, but since degrees of longitude are farthest apart at the equator and converge at the poles, their distance varies greatly.