Executive summary - Ashok-Ab4/House-Prices-AirBnB GitHub Wiki
Executive Summary:
The data chosen for this project was the New York City 2019 Air BnB dataset, which describes the listing activity and booking information for Air BnB listings in New York City for the year 2019. The main objective for the project was to explore the data, organize it and give it some structure to give insights on the nuances and relationships between listing price and all the other different metrics that this dataset had information on. The overarching objective however is to fit multiple regression models on the available data to achieve a fit that can give good predictions on the listing price. This was a public dataset obtained from Kaggle for the purposes of this project. The original dataset obtained from the website had around 50000 rows and 16 columns. A decent size, but potentially taxing computationally so a random sample of 15000 observations was chosen after all the cleaning procedures were completed. Naturally with a dataset of such size a good amount of cleaning went into the data. The dataset contained a large amount of NULL values, which were then curated and replaced with appropriate values to make the dataset compatible for analysis. Once the cleanup was completed, extensive EDA was performed on each predictor and its values and the potential implications that might have on the final model. Quite a few visualizations were included to provide insight to the interpretation that was being made on the structure of the data.
This was followed by a brief feature selection process because there were very few predictors to begin with. Columns that made no foreseeable contribution to the independent variable were either removed entirely or ones that had some form of meaningful data were mutated into new variables.
The model training process was begun with a simple linear model with the predictors available and then interaction terms and potential non-linear terms were added onto the model in the hopes of bettering performance and bringing the model to a more accurate depiction of reality. But neither the interaction terms nor the non linear polynomial terms seemed to make massive differences to the performance metrics, so they were discarded in favor of the simpler model. Multiple other models were then fit on these set of predictors to determine the model which performed the best. The models chosen were trained with the caret package, using a 5 fold cross validation method and these included
- Linear Model
- Ridge Model
- Lasso Model
- Random Forest Model
- Bagging tree model
- Boosted tree model
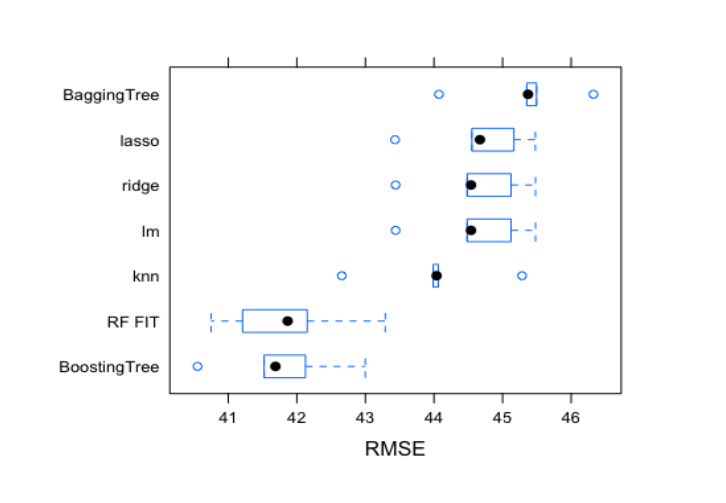
- KNN model These models were judged on least error and most R squared values and based on these metrics the Random Forest Model outperformed the other models and was chosen as the model of choice for this dataset, despite the boosting tree model being a very close second.
This model was then used to make price predictions on the test dataset and performed reasonably well considering that no model had extremely good performance. Boxplots were then made to display which model had the best performance metrics among all of the ones selected.