EDA - Ashok-Ab4/House-Prices-AirBnB GitHub Wiki
Data Preparation and Discovery:
This dataset in its raw form had roughly 50000 rows and 16 columns or predictors. The columns had a few categorical as well as numerical variables, making it a suitable candidate to perform regression analysis on. Out of the 16 predictors, the price variable was chosen as the response variable. Following is a brief summary of all the predictors and their assessments.
- Id – integer variable. Just the identification number for that particular listing. Doesn’t add much value with respect to the independent variable. Will be removed later.
- Host_id –integer variable. The identification number for the host. Host_id could be useful for EDA but has no foreseeable contribution to the independent variable. Will be removed later.
- Name – character variable. Contains the name of the listing. While there might be some connection to the name and potential popularity of the listing, there is no way to quantify that in a model, so it will be removed further.
- Host name – character variable. Name of the host, will be removed for privacy issues and because it also has no meaningful contributions to the response.
- Neighbourhood_group – character variable which will be converted into a factor. Has 5 unique values that will become dummy variables in the dataset.
- Neighbourhood – character variable. Has a large number of unique values making it hard and computationally taxing to convert into factors for different models because of which it will be excluded from the dataset.
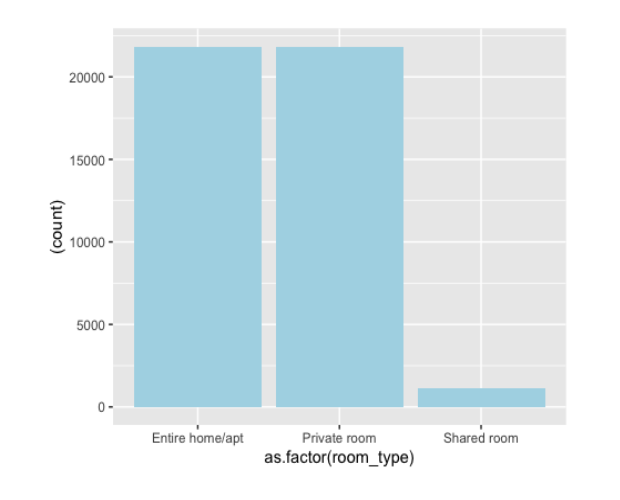
- Room_type – character variable. Has 3 distinct values which will be factorized and dummy coded into the dataset. Potentially one of the most important indicators of price making it an important independent variable
- Latitude – double type variable. Contains one half of the geographical coordinates for the listing
- Longitude – double type variable. Contains the other half of the geographical coordinates. 10)Price – integer variable. The response or predictor variable which is the main focus of the model.
- Minimum nights – integer variable. Minimum required duration of stay which will be included in the model as a numeric variable.
- Availability_365 – Integer variable. Indicates the availability of the listing throughout the calendar year
- Number_of_reviews- integer variable. Indicates the number of reviews that the listing has procured
- Last_review – date variable. Shows the most recent date that the listing procured a review. By itself this information has little use to the model. But depending on how recent the review was, there could be some kind of connection to the popularity of the listing and that indirectly impacts the price. So we will use this variable to create a new variable called latest review which will be factorized depending on how recent the review was. The new fields added to this will be “6 months ago” “1 year ago” “2 years ago” ...... “6 or more years ago”.
- Reviews_per_month – floating point variable. Indicates the average number of reviews per month.
- Calculated_host_listings_count – integer variable. Indicates the total number of listings made per host_id.
Once these preliminary analyses were made a deeper and in depth analysis was made of the individual variables and their relationships. We started with a correlation matrix of the different variables to see if there were any underlying relationships.
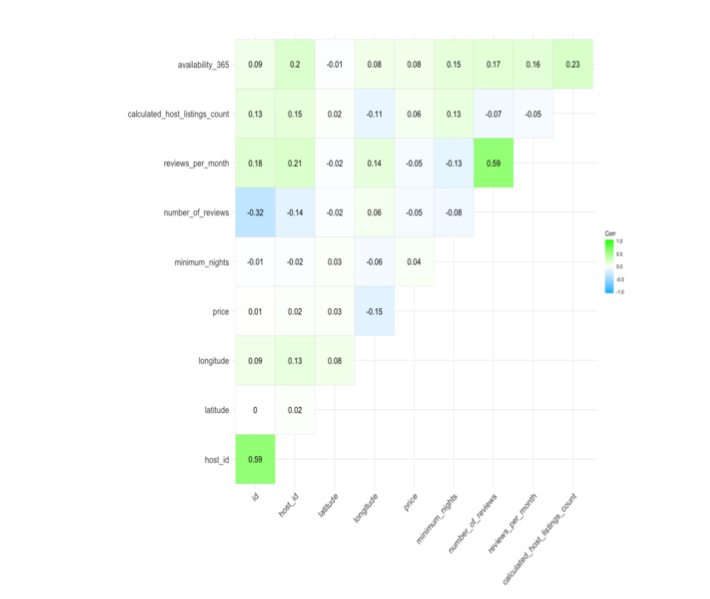
From the matrix it was clear that there no significant relationships between the response variable and any of the other dependent variables, which was odd and indicated that the models that were going to be fit would not be very effective in explaining the way the response varied with respect to the dependent variables.
The response was then explored in detail. A plot was made with the price distribution on the x axis and the count on the y axis.
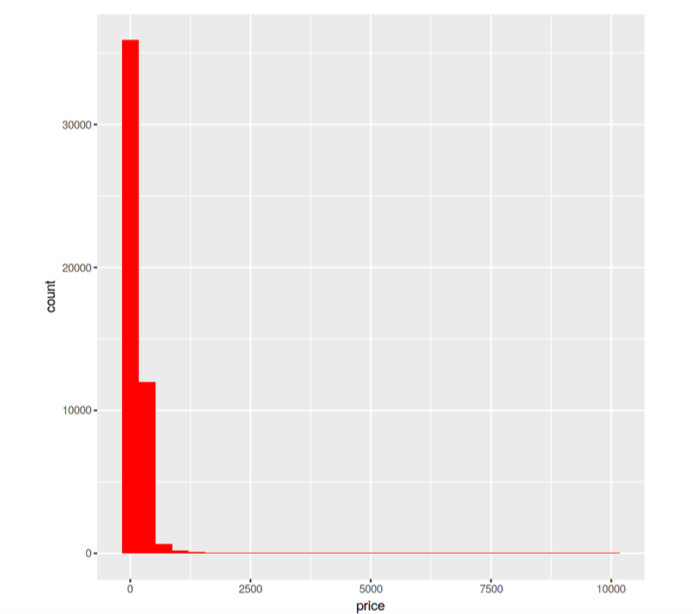
This showed that the price distribution was very skewed with some incredibly large outliers that were removed to make the dataset more uniformly distributed.
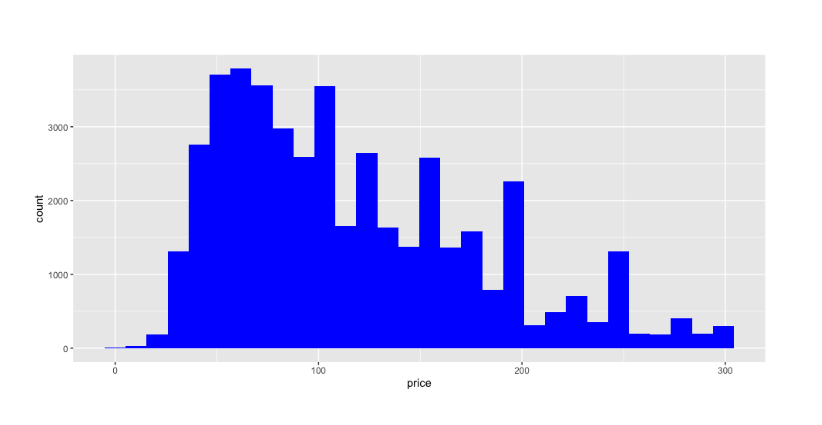
The result was a much more evenly distributed dataset with much lesser skewness without compromising too much of the dataset and making it overfit.
The next was minimum nights which also displayed some odd outliers that were not justifiable with respect to the distribution in the dataset. So the visualization was made for that too.
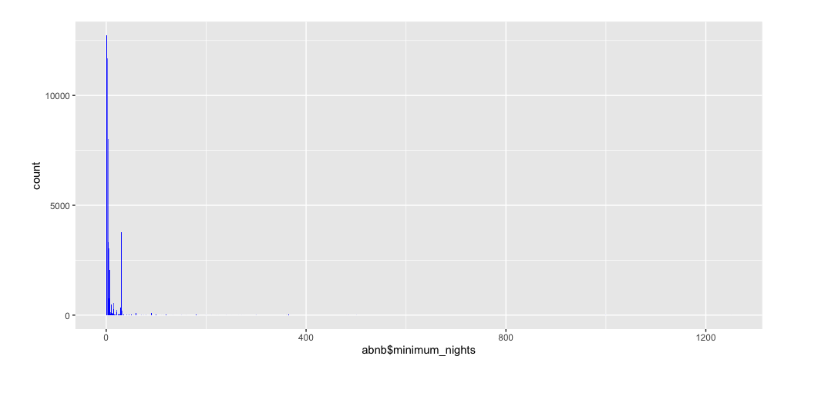
This data also displayed a large skewness to the right with very few values to justify keeping them in the dataset so they were removed as well. Once they were removed the data showed more improvement in the skewness without compromising the integrity of the data as a whole. The large number of Null values in the database were dealt with in two ways – the nulls that were associated with missing values in the number of reviews and reviews per month columns were assigned zeros and “NoReviews” instead and the nulls that were associated with missing values in the name and host name were removed entirely from the dataset. Since id, host_name, name and host_id were considered immaterial to the response variable they were removed from the dataset entirely. The last transformation made to the dataset was with the last review column on the dataset. The date by itself adds no value to the model but the recency of the review might have an effect on the perception of the listing and thereby indirectly affecting the price. Therefore the year was extracted from the last review column and then a scaled value was assigned to it depending on how recent the review was. The factors were – 6 months ago, 1 year ago, 2 years ago, 3 years ago, 4 years ago, 5 years ago, 6 or more years ago. This was completed and the 44k row dataset was now reduced to a random sample of 15k rows. This was then split into training and test datasets with a 75-25 split. These were some other visualizations made during the EDA process to describe the different variables.
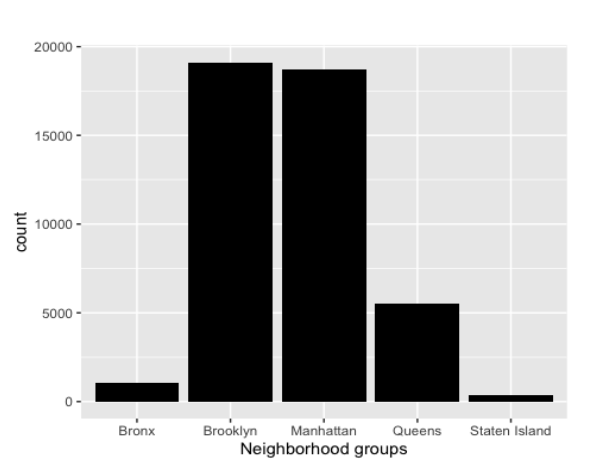
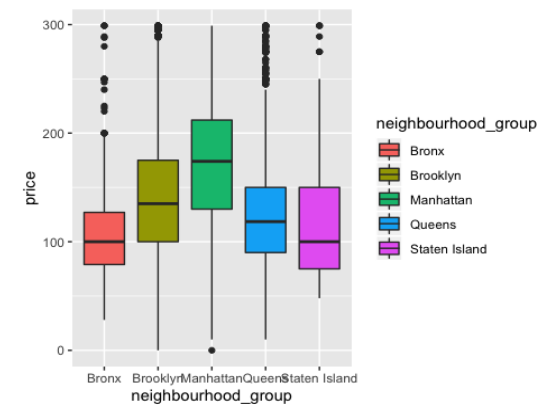
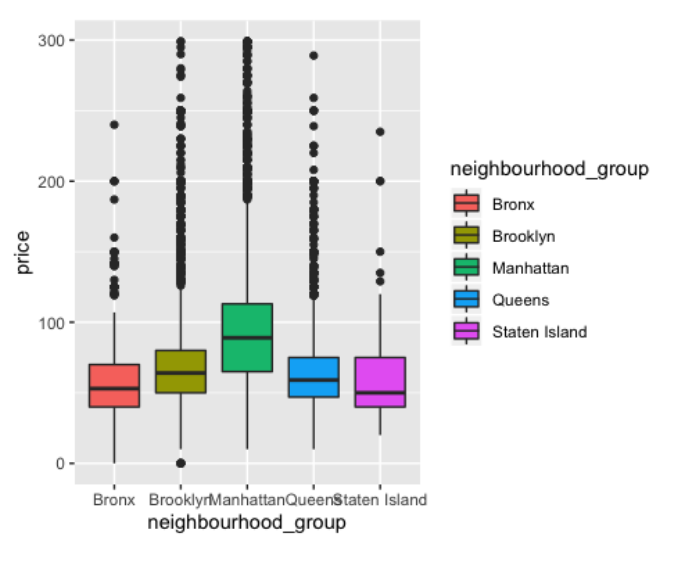
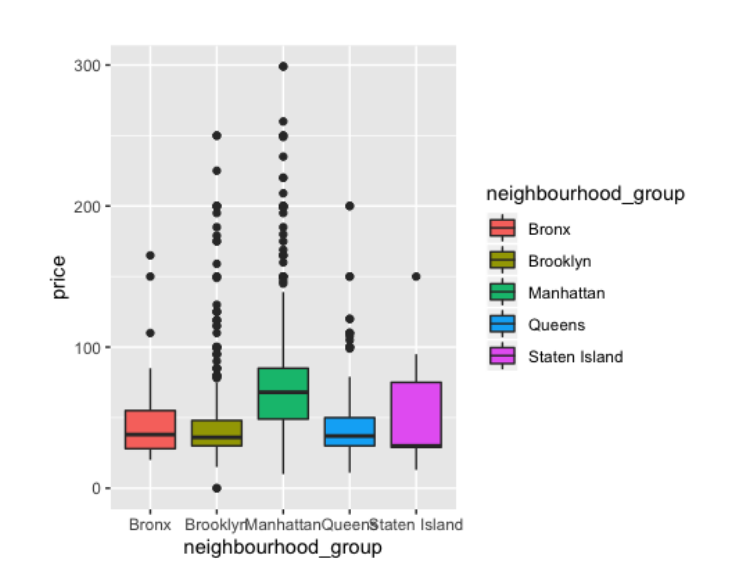
Plots for price vs neighborhood groups for Entire apt/house, private rooms and shared rooms respectively